*Corresponding author. Tel.:#44-141-548-2015; fax:# 44-141-552-0557.
E-mail address:[email protected] (U.S. Bititci)
Strategy management through quantitative modelling of
performance measurement systems
U.S. Bititci
*
, P. Suwignjo, A.S. Carrie
Centre for Strategic Manufacturing, DMEM, University of Strathclyde, Glasgow G11XJ, UK Received 30 March 1998; accepted 29 September 1999
Abstract
This paper is based on previous works on performance measurement and on quanti"cation of relationships between factors which a!ect performance. It demonstrates how tools and techniques developed can be used to evaluate the performance of alternative strategic choices through a quantitative approach to modelling of performance measurement systems. The paper provides a brief background to the research problem and preceding works. The tools and techniques used are brie#y introduced. Use of these tools and techniques to evaluate the performance of alternative manufacturing strategies is demonstrated. Finally, the capability of the approach to deal with dynamic environments is demonstrated using sensitivity analysis. ( 2001 Elsevier Science B.V. All rights reserved.
Keywords: AHP; Performance measurement; Prioritisation of performance measures; Dynamics of performance measures; Resource allocation
1. Introduction
The nature of competition has changed dramati-cally over the last two decades. Quality, speed, and
#exibility, in addition to cost, have emerged as the three most important competitive attributes [1}4]. This has made the traditional "nancially based performance measurement systems less relevant. Over recent years much work has been done by practitioners and researchers to develop new per-formance measurement systems which try to take account of"nancial and non-"nancial measures in balance [5}8]. Extensive, continuing research is
also carried out at the Centre for Strategic Manu-facturing (CSM), University of Strathclyde to de-velop a reference model for a robust and integrated performance measurement system. This research resulted in the development of a reference model and an audit method to assess the robustness and integrity of performance measurement systems used within manufacturing industries [9]. Audits carried out in over 30 organisations using this refer-ence model revealed that the relationships between various performance measures in a system are not understood.
In response to this particular "nding, another line of research was developed within the Centre to examine the appropriate tools and techniques which can be used to understand, model and if possible quantify the relationships between perfor-mance measures which exist in a business. This new
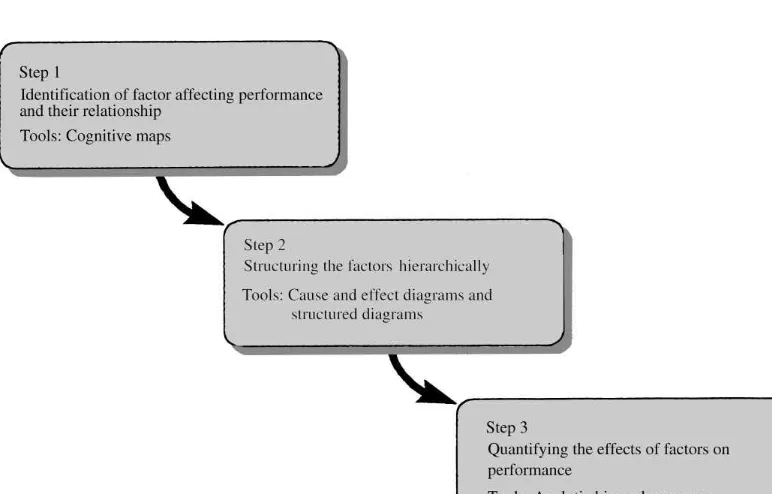
Fig. 1. The framework of the QMPMS approach.
line of enquiry resulted with the development of an approach which facilitates the development of quantitative models for performance measurement systems (QMPMS) [10].
The work presented in this paper demonstrates how the QMPMS approach could be adopted to evaluate the performance and sensitivity of alterna-tive strategic choices. Firstly, the paper presents a brief summary of the QMPMS approach, then the use of the model to evaluate the performance of alternative manufacturing strategies is demon-strated. Finally, the paper concludes with a detailed discussion on the experiences and lessons learned by the researchers.
2. Quantitative model for performance measurement system (QMPMS)
The objective of the research adopted under the heading of QMPMS was to identify tools and tech-niques that would facilitate:
f identi"cation of factors a!ecting performance,
f identi"cation of the relationship between factors
a!ecting performance,
f quanti"cation of these relationships on one
an-other, and on the overall performance of the business, and
f `what ifaanalysis on business performance and
strategy selection.
The three steps of the approach were developed as a result of the QMPMS project as depicted in Fig. 1. The details of this approach have been explained and discussed in some detail in a pre-vious publication [10].
In general, the QMPMS approach classi"es the relationships between factors which a!ect perfor-mance as follows:
f direct (vertical) e!ect,
f indirect (horizontal) e!ect, and f self-interaction e!ect.
Table 1
Competitive characteristics of two alternative manufacturing strategies
Innovator Mass customiser
1. Consistent quality 1. Dependable delivery 2. Rapid product design change 2. Short delivery lead-time 3. Improved product performance 3. Consistent quality 4. Dependable/reliable delivery 4. Product performance
In stage two the cognitive maps are converted into a more formalised structure. Initially, cause and e!ect diagrams are used as a discussion tool to structure the factors which a!ect performance hier-archically. Structure diagrams are then used to formalise the hierarchical nature of the perfor-mance measurements system. Traditional structure diagrams only model the direct (vertical) relation-ships. However, a modi"ed version of the struc-tured diagrams, as used by the QMPMS approach, model also the indirect (horizontal) and self-inter-action relationships between factors which a!ect performance.
Finally, in stage three the Analytical Hierarchy Process is used to quantify the relationship of each factor with the others with respect to overall perfor-mance.
3. Evaluating the performance of alternative manufacturing strategies
Manufacturing strategy adopted by companies has a great impact on their internal environment. Di!erent manufacturing strategy requires di!erent competitive capabilities [11}13]. To build particu-lar competitive capabilities as required by the adopted manufacturing strategy, companies must employ speci"c types of machines, tooling, layout, human resources, information#ows, systems, pro-cedures, and technology. The con"guration of those entities determines the generic performance of the manufacturing system: cost, quality, delivery, and#exibility. Evaluation of the alternative manu-facturing strategies requires that the performance of the strategies on cost, quality, delivery, and# ex-ibility can be quanti"ed and aggregated. This is not a straightforward task, since cost, quality, delivery, and#exibility are measured in di!erent dimensions. Cost is measured in pounds, quality may be mea-sured in parts per million of critical defects, delivery may be measured by % orders delivered on time, and #exibility may be measured in terms of time, volume or cost.
As the operating environment of a"rm changes rapidly, the selection of manufacturing strategy to be adopted is becoming more di$cult. A manufac-turing strategy, which is successfully being
em-ployed today, cannot be guaranteed to deliver the same results over the next two years. Consequently, the evaluation of alternative manufacturing strat-egies must take into account the dynamics of the external and internal environments.
It is the hypothesis of the work presented in this paper that the QMPMS approach could be an e!ective tool for evaluating the e!ectiveness and sensitivity of alternative manufacturing strategies.
For example, suppose an engineering company wants to expand its business by introducing a new product line and also wants to construct a new factory to produce the new product line. As the characteristics of the new factory will be in#uenced by the manufacturing strategy adopted, an analyti-cal evaluation must be carried out to decide what kind of manufacturing strategy should be adopted. This analysis could be carried out using the QMPMS framework.
Assuming the company employs a &make to order' policy, based on the generic manufacturing strategies identi"ed by Sweeney and Szwejczewski [12,13], two alternative strategies can be adopted by the company depending on the volume of de-mand. If demand is low the company should adopt
&Innovator' strategy. If demand is high the com-pany should adopt &Mass Customiser' strategy. These two strategies require di!erent competitive characteristics as illustrated in Table 1.
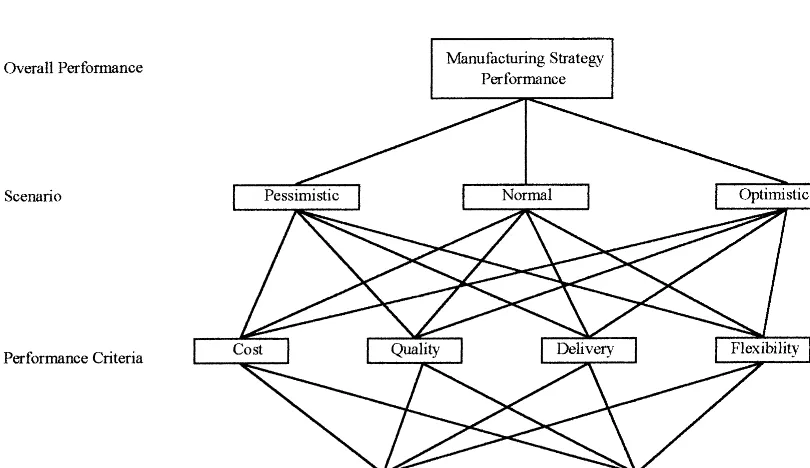
Fig. 2. Hierarchical structure of manufacturing strategy performance evaluation. #exible. The next two competitive capabilities of
the innovator strategy are improved product per-formance and dependable delivery. Referring to the generic performance of a manufacturing system mentioned earlier, the innovator must be excellent in quality, #exibility and delivery. Although it is necessary to control cost, it is not the principal characteristic for competitiveness.
The mass customiser strategy prioritises depend-able delivery and short-delivery lead-times. Both these competitive capabilities relate to delivery in the generic performance of a manufacturing system. The next two competitive characteristics are consis-tent quality and product performance. The ability of the mass customiser to win competition is a! ec-ted much more by performance in delivery and quality rather than performance in #exibility and cost.
Using the QMPMS approach, the hierarchical structure of the evaluation of the performance of Innovator and Mass Customiser manufacturing strategies can be constructed as indicated in Fig. 2. The level 0 of the structure is the overall mance of the manufacturing strategies. The perfor-mance of the manufacturing strategies depends on
the volume of the demand (the scenario) as in-dicated by level 1 of Fig. 2. There are three possibil-ities of level of demand: low (pessimistic scenario), average (normal scenario) and high (optimistic scenario). Level 2 of the structure is performance criteria. Based on the generic performance of manufacturing strategy, the performance of the al-ternatives can be evaluated based on the criteria cost, quality, delivery and#exibility. Finally, level 3 of the structure is the alternative manufacturing strategies, which could be adopted.
Evaluation of these alternative strategies is car-ried out level by level starting from the top level down to the lower levels. The"rst evaluation as-sesses the possibilities of scenarios occurring in the planning period. The second evaluation assesses the relative e!ects of each criterion on performance under a particular scenario.
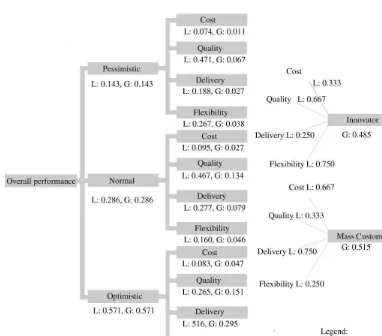
Fig. 3. Evaluation manufacturing strategy performance.
each alternative can be computed through the com-position process as explained earlier. Using the AHP software (ExpertChoice [20]) the perfor-mance of Innovator and mass customiser strategies can be evaluated as indicated in Fig. 3. From the evaluation, it can be seen that the performance of mass customiser strategy (0.515) is better than the performance innovator strategy (0.485), given that the probability of demand for low, average and high are 14.3%, 28.6% and 57.1%, respectively.
4. The dynamics and sensitivity analysis
Management uses a set of "nancial and
non-"nancial performance measures to monitor and
control the operation of companies through a set of performances. As external environments change rapidly, the set of performance measures employed by companies should also change to re#ect changes in the environment. That is, performance measures reported to the management should change as a re-sult of changes in customers, competitors, internal improvement and so on. Walker proposed the use of dynamic management reporting to keep perfor-mance measures up to date [14].
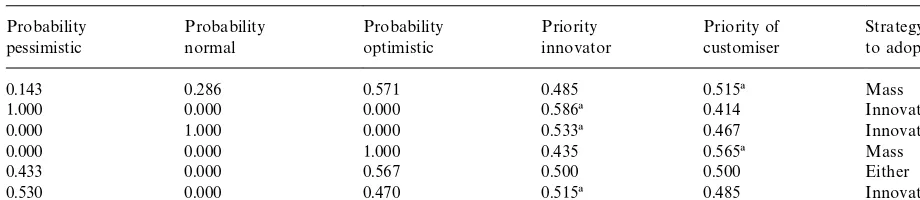
Table 2
Sensitivity analysis of manufacturing strategy performance Probability
0.143 0.286 0.571 0.485 0.515! Mass
1.000 0.000 0.000 0.586! 0.414 Innovator
0.000 1.000 0.000 0.533! 0.467 Innovator
0.000 0.000 1.000 0.435 0.565! Mass
0.433 0.000 0.567 0.500 0.500 Either
0.530 0.000 0.470 0.515! 0.485 Innovator
!Preferred strategy.
other classes because of changes in the internal or external environments of the business. The QMPMS can cope with the dynamism through the sensitivity or what-if analysis.
For example, for the manufacturing strategy evaluation explained earlier, the actual level of de-mand cannot be known in advance. The judgement of the probability of occurrence of low, average, and high demand are based on the information available at the time of evaluation. The judgement may change some time later if more information is available. Based on the current judgement, the pri-ority (performance) of mass customiser strategy is better than the priority (performance) of innovator strategy. However, it is important to analyse fur-ther how the performance will change if the prob-ability of demand level changes. Again the AHP software could be used to evaluate the sensitivity analysis. The results of such analysis, based on the model presented earlier, are illustrated in Table 2. If the probability of low demand is 100%, the perfor-mance of the innovator strategy will be better than the performance of the mass customiser strategy. While, if the probability of high demand is 100%, the Mass Customiser strategy will perform better than the Innovator strategy.
Finally, if the probability of the occurrence of average demand is 100%, the performance of Inno-vator strategy will be better than the performance of mass customiser strategy. In general, if the prob-ability of the occurrence of low demand is greater than 43.3%, the performance of innovator strategy will be better than the performance of mass cus-tomiser strategy as indicated by Table 2. The
sensi-tivity analysis can also be carried out on changes of the impacts of performance criteria on performance under di!erent scenarios.
5. Discussion and conclusion
A quantitative model for performance measure-ment systems, with an example of its application to strategy management has been presented. Using the QMPMS, factors a!ecting performance can be identi"ed and their e!ects quanti"ed. The applica-tion of the model to evaluate the performance of alternative manufacturing strategies shows that the e!ects of multidimensional factors on performance can be aggregated into a single dimensionless unit (priority). The example presented in the paper is highly simpli"ed. The evaluation, in practice will be more complicated as all important factors a!ecting the performance of manufacturing strategy will need to be included in the model, and the interac-tions among factors should be considered and agreed.
An important bene"t gained from the QMPMS approach is that the interaction of the factors can be clearly identi"ed and expressed in quantitative terms. This identi"cation will bring us one step forward in understanding the dynamic behaviour of factors a!ecting performance. However, to gain valid results, managers using AHP technique should be aware of&rank reversal'phenomenon, for which AHP has been criticised [15}19].
relates to managers'reluctance in completing in the pair-wise comparison questionnaires, particularly if the model involves identi"cation and quanti" ca-tion of a large number of factors a!ecting perfor-mance. Consequently, the number of pair-wise comparison questionnaires will be quite large and completion of all the questionnaires will be time consuming. Distributing the questionnaires to sev-eral people who have a good understanding and knowledge of the business and subject can elimin-ate this problem.
The second problem of the QMPMS application relates to achieving a single judgement in pair-wise comparison if more than one person is involved in completing in the questionnaires. Even though Saaty [20] provides formulae for computing the priority of group judgement using geometric mean, achieving consensus among the members of the group seems better than just using the geometric mean. Several discussions may be re-quired to elaborate the real situation before a gen-eral consensus judgement over a particular issue can be achieved. Cognitive Mapping is also an e!ective tool which could be used to elaborate the problem.
The QMPMS approach also facilitates the pro-duction of performance reports, which integrate several multidimensional measures into a single performance index.
Furthermore, companies operate in a dynamic environment; consequently performance measure-ment is a dynamic process. This means that the priorities and criticality of performance measures will change over time as the internal and external operating environments of the business change. At a particular company, performance measures which are critical today, could change after a peri-od of time, to become trivial performance measures. It is important to recognise these changes as soon as possible so that the basis of the quantitative model for the performance measurement system can be changed accordingly. However, changes of some factors up to a certain level would have no signi"cant e!ects on performance measurement and the current performance measurement system would not need to be changed. The sensitivity anal-ysis available through the QMPMS approach can be used to identify when to review and change the
structure, content and priorities within a perfor-mance measurement system.
Finally, the paper demonstrated the theoretical feasibility of using the QMPMS approach and par-ticularly the use of the Analytical Hierarchy Pro-cess (in the form of ExpertChoice Software) in evaluation of the suitability and sensitivity of sev-eral strategic choices through quanti"cation of the relationships between performance measures and factors a!ecting performance.
References
[1] D.A. Garvin, Competing on the eight dimensions of qual-ity, Harvard Business Review (November}December) (1987) 101}109.
[2] G. Stalk, Time}the next source of competitive advantage, Harvard Business Review (July}August) (1988) 41}51. [3] D. Gerwin, An agenda of research on#exibility of
manu-facturing processes, International Journal of Operations and Production Management 7 (1) (1987) 38}49. [4] N. Slack, The#exibility of manufacturing system,
Interna-tional Journal of Operations and Production Manage-ment 7 (4) (1987) 35}45.
[5] R.S. Kaplan, D.P. Norton, Translating Strategic into Action } The Balanced Scorecard, Harvard Business School Press, Boston, 1996.
[6] K.F. Cross, R.L. Lynch, The SMART way to de"ne and sustain success, National Productivity Review 8 (1) (1988}1989) 23}33.
[7] J.R. Dixon, A.J. Nanni, T.E. Vollman, The New Perfor-mance Challenge: Measuring Operations for World Class Competition, Dow Jones-Irwin, Homewood, IL, 1990. [8] S. Globerson, Issues in developing a performance criteria
system for an organisation, International Journal of Pro-duction Research 23 (4) (1985) 639}646.
[9] U.S. Bititci, A.S. Carrie, L. McDevitt, T. Turner, Integ-rated performance measurement systems: A reference model, Proceedings of IFIP - WG 5.7 1997 Working Con-ference, Ascona-Ticino-Switzerland, 1997, pp. 15}18. [10] P. Suwignjo, U.S. Bititci, A.S. Carrie, Quantitative models
for performance measurement system, International Jour-nal of Production Economics (March 2000).
[11] J.G. Miller, A. Roth, A taxonomy of manufacturing strat-egies, Management Science 40 (3) (1994) 285}304. [12] M.T. Sweeney, M. Szwejczewski, Manufacturing strategy
and performance: a study of the UK engineering industry, International Journal of Production Managment 16 (5) (1996) 23}41.
[14] K.B. Walker, Corporate performance reporting revisited-the balanced scorecard and dynamic management report-ing, Industrial Management and Data Systems 96 (3) (1996) 24}30.
[15] V. Belton, T. Gear, On a short-coming of Saaty's method of analytic hierarchies, Omega 11 (3) (1982) 226}230. [16] T.L. Saaty, L.G. Vargas, The legitimacy of rank reversal,
Omega 12 (5) (1984) 513}516.
[17] J.S. Dyer, Remarks on the analytic hierarchy process, Management Science 36 (3) (1990) 249}258.
[18] P.T. Harker, L.G. Vargas, Reply to&Remarks on the ana-lytic hierarchy process'by J.S. Dyer, Management Science 36 (3) (1990) 269}273.
[19] S. Schenkerman, Avoiding rank reversal in AHP decision support models, European Journal of Operational Research 74 (1994) 407}419.