ANALYSIS
Single species conservation in a multispecies fishery: the case
of the Australian eastern gemfish
Sean Pascoe *
Centre for the Economics and Management of Aquatic Resources(CEMARE),Department of Economics,Uni6ersity of Portsmouth, Locksway Road,Portsmouth,Hants,PO4 8JF,UK
Received 12 October 1998; received in revised form 15 June 1999; accepted 15 June 1999
Abstract
The inability of fishers to avoid bycatch when operating in a multispecies fishery can create problems when the bycatch species itself is the subject of conservation-based controls. Increased protection of the bycatch species can only be achieved through a reduction in the overall catch of the fishery. Such a problem has arisen in the Australian south east fishery where the stock of one bycatch species has fallen substantially over recent years. A model of the fishery was used to estimate the costs of protecting the remaining stock and the potential commercial benefits from the recovery of the stock. The analysis suggests that the costs of protecting the stock may be greater than the commercial benefits arising from a recovered stock. Non-market benefits of stock conservation are not included in the model analysis, but are considered in the discussion. © 2000 Elsevier Science B.V. All rights reserved.
Keywords:Bycatch; Bioeconomic modeling; Linear programming; Species conservation
www.elsevier.com/locate/ecolecon
1. Introduction
The objective of fisheries management in most countries is to ensure the continuing existence of the resource, whilst improving the economic and financial status of the fishing operators. In most cases, these objectives are complementary. While for some species there may be an economic
argu-ment to deplete a stock based on commercial use values (Clark, 1990), for most species improving the economic performance of a fishery involves increasing, or at least maintaining, the size of the stock.
In a multispecies fishery, the criteria for optimal exploitation is less obvious. The more commonly advocated forms of stock management are inap-propriate given that managers are concerned with the exploitation of a range of species (Kirkley and Strand, 1988). This in itself would not be a prob-lem, except that many multispecies fisheries are characterized by joint production (Kirkley and * Tel.: +44-1705-844242; fax:+44-1705-844037.
E-mail address:[email protected] (S. Pascoe)
Strand, 1988; Thunberg et al., 1995). As fishing gear is not species specific and stocks of different species occupy the same habitat as the ‘target’ species, fishers usually catch a range of species that they were not intentionally targeting.
The inability of fishers operating in a multispe-cies fishery to avoid the incidental capture of some species can cause problems when a bycatch species is itself the target of conservation mea-sures. Incentives exist for individual fishers to continue fishing for the target species at the ex-pense of the bycatch species, provided the mar-ginal value of the catch (excluding the discarded bycatch) exceeds the marginal cost (including the opportunity cost of targeting different species groups) (Pascoe, 1998). This is essentially a princi-pal-agent problem arising out of the agent’s incen-tive structure differing from the principal’s preferences (Moyle, 1998). The provision for in-clusion of unique stocks in endangered-species legislation in many countries around the world, even though the species as a whole may not be endangered, has exacerbated the problem. Re-gional depletion of one species in a multispecies fishery can result in severe restrictions being placed on the fishery as a whole. This problem is currently being experienced in the USA through the listing of some stocks of salmon along the Pacific coast. The listing of Snake River sockeye salmon as endangered in 1991 has seen a continu-ing debate over whether to increase measures to protect the species (at the cost of reduced hy-droelectricity generation) or maintain the status quo and risk the extinction of the stock (Lewis, 1994). The listing of Snake River chinook salmon resulted in the fishery being closed during the spawning run in 1994. The closure resulted in the estimated loss (in terms of foregone capture) of 23 000 king salmon in order to save eight chinook (Ess, 1994).1
One-third of the salmon stocks in the Columbia River are extinct, whilst a further 40% are at risk of extinction (Bragg, 1994).
A similar problem has developed in the Aus-tralian south east fishery, where the stock of eastern gemfish (Rexea solandri) has fallen to a
level where fears for the survival of the stock have been raised (Bureau of Resource Science, 1998). The eastern gemfish stock was considered for listing under the Endangered Species Protection Act (1992) at the fourth meeting of the Endan-gered Species Advisory Committee (ESAC) and Endangered Species Scientific Sub-committee (ESSS) in September, 1994. The species was re-jected for listing at that time on the basis that management plans had been introduced to further halt its decline. Managers had responded to the stock collapse by imposing a zero total allowable catch (TAC) on eastern gemfish. However, eastern gemfish are also caught as bycatch with many other species. As a result, it is expected that considerable quantities of eastern gemfish are still being caught as bycatch and discarded (Bureau of Resource Science, 1998). This has caused concern to fisheries managers, scientists, fishers, and con-servation groups, some of whom have called for further measures to protect the stock.
The purpose in this paper is to present a method for assessing the commercial benefits and costs of attempting to protect a single species in a multispecies fishery. The method involves the use of a linear programming model to estimate the value of a fishery with and without recovery of the threatened bycatch species, and the costs of introducing measures to enable the species to recover. The model is applied to the Australian southeast fishery to examine the commercial benefits and costs of gemfish recovery.
2. Gemfish and the south east fishery
The south east fishery is the main supplier of fresh fish to the Sydney and Melbourne markets, the largest fish markets in Australia. Over 100 species are caught in the fishery, although over 80% of the value of landings is accounted for by 15 species (ABARE, 1993a). Individual transfer-able quotas (ITQs) were introduced for these spe-cies in 1992 in order to protect the stocks and improve the economic performance of the fleet.
Gemfish have been a major species harvested by the inshore sector of the fleet since the early 1970s. Two stocks of gemfish have been identified 1Ironically, Snake River King salmon has also subsequently
in the fishery (Kailola et al., 1993). Eastern gemfish is caught off the south coast of New South Wales, with most catch occurring during the winter spawning run. Western gemfish are caught mostly off the west coast of Victoria and are largely taken as bycatch of other species.
A 3000 tonne TAC was introduced for eastern gemfish in 1988 following concerns that the stock was either over exploited or being affected by unknown environmental factors (Kailola et al., 1993). The TAC was subsequently revised down-wards in response to falling recruitment in the fishery, with a zero TAC being imposed in 1993. In 1997, the TAC was increased to 1000 tonnes was part of an adaptive-harvesting strategy to validate the models used in the stock assessments (AFMA, 1997). However, only 374 tonnes were caught (Bureau of Resource Science, 1998). A zero TAC was again proposed for 1998 (AFMA, 1997), but a 300 tonne TAC was imposed in recognition that bycatch was unavoidable as long as the fishery remained open (Bureau of Resource Science, 1998).
The recovery of the stock will largely rely on the conservation of the remaining resource. In such a case, overquota catch and subsequent dis-carding of eastern gemfish could threaten the biological status of the stock. The discarding of an otherwise valuable fish is also seen by many groups (including fishers) as a waste of the re-source. Most discarded gemfish die before being returned to the water, mostly as a result of the effects of decompression.
3. Modeling benefits and costs of stock conservation
The possibility of extinction of a fish stock is a function of prices, costs, biological features of the fish stock, and the rate of entry and exit to the fishery (Cheng et al., 1981). Given problems of non-malleability of capital (Clark et al., 1985; Schellberg, 1993), fish stocks can be driven below their minimum viable biomass under certain price and cost conditions (Cheng et al., 1981; Weisbuch et al., 1997). As the cost of capturing bycatch species is negligible (since they were caught
inci-dentally), the survival or extinction of the bycatch species in an unmanaged (open access) fishery will largely depend on their relative contribution to the income of the fisher.
Management measures can be introduced, how-ever, to protect individual species within a multi-species fishery. These measures can include area, seasonal, or total closures. However, such mea-sures also impose costs on fishers in terms of foregone revenue from the catch of the target (and other bycatch) species. Estimating these costs are not straightforward, as fishers have the capa-bility to adjust their activity to compensate (to some extent) for the restrictions imposed. Closing down a fishery, or prohibiting the landing of a particular species, will result in a reallocation of effort to other fisheries or other target species.
Given the complexity of most multispecies fisheries, some form of model is required in order to estimate these effects. This also requires as-sumptions about fishers’ behavior to be made. An assumption that is often made is that fishers are profit maximizers, subject to constraints imposed by management, the environment (such as weather), and social factors. Given this assump-tion, a mathematical programming model can be developed to estimate changes in the allocation of effort between alternative activities in response to various management changes. Such models have been developed for a number of multi-species fisheries (Brown et al., 1978; Siegel et al., 1979; Sinclair, 1985; Murawski and Finn, 1985; Frost et al., 1993; Pascoe, 1997; Mardle et al., 1999).
fished) across the fishery. As noted above, the advantage of using a mathematical programming model in this case is that effort allocation is endogenous, and hence changes in effort alloca-tion arising from changes in management can be estimated. This is more realistic than many simu-lation models that assume a constant effort allo-cation or impose an exogenously determined allocation based on a priori expectation of effort reallocation following management changes.
The objective function of the model is the max-imization of total fishery gross margins (TOTGM), given by
TOTGM=%
k
(REVk−COSTk) (1)
where REVk is the total revenue in sector k and COSTkis the total variable costs in sector k. The total revenue in each sector is given by
REVk=% i
%
m
pi,mLANDi,k,m (2)
where pi,m is the price received for species i in month m, and LANDi,k,m is the quantity of spe-ciesilanded in monthmby boats in sectork. The total variable cost of fishing for each sector is given by
COSTk=FUELk+CREWk+MARKk (3)
whereFUELkis the fuel cost incurred by boats in sector k, CREWk is the payments to crew in sector k and MARKk is the marketing costs in-curred by sectork. The estimation of these costs is given in Eqs. (4) – (6):
FUELk=bkfk% g
%
m
DAYSk,m,g (4)
CREWk=rkREVk (5)
MARKk =mkREVk (6)
where DAYSk,m,g are the number of days em-ployed by a boat in sector k fishing for species groupgin monthm,bkis the number of boats in sector k, (k is the average fuel cost per day for boats in sectork,rkis the crew share of revenue, and rk is the marketing commission incurred by boats in sector k. The groups are defined by the main target species caught in a particular area
and depth range, but include all other species caught in the same area and depth range. Several species may be targeted simultaneously within a group. The proportional distribution of the spe-cies within these groups may change from month to month, but the general species composition within each group is fairly stable over the year.
The number of days that can be fished each month and over the year is also limited. The number of days that a boat in sectorkcan fish for group g is given in Eq. (7) and Eq. (8):
%
g
DAYSk,g,m5dk (7)
%
g
%
m
DAYSk,m,g5ck (8)
where dkis the maximum number of days a boat in sector k can fish in any month, and ck is the maximum number of days that can be fished by a boat in sector k over the year.
There are no direct catch – effort relationships at the individual species level, as the species are targeted by some boats and caught as bycatch by others. Instead, the catch of species i by sector k in monthm(CATCHi,k,m) is estimated as a linear function of effort exerted on each species group (i.e. defined by area, depth and main species targeted) and catch per unit of effort of each species in each group, given by
CATCHi,k,m=bk% g
lk,m,gag,iDAYSk,m,g (9)
wherelk,m,gis the average catch per day of a boat in sector k fishing for group g in month m, and
The catch can be either landed or discarded, such that:
CATCHi, k, m=LANDi, k, m+DUMPi, k, m (10)
whereLANDi,k,mandDUMPi,k,mare the quantity of catch of speciesiin monthmby boats in sector k landed or discarded, respectively. Discarding occurs as the level of landings of each species is constrained by its TAC. However, as the species are caught jointly, it may be profitable to continue fishing and only land the species for which the TACs have not been filled, discarding the over-quota catch. Hence, the level of landings may be less than the level of catch. The quota constraint is imposed at the total landings level, such that:
TLANDi=% k
%
m
LANDi,k,m5ti (11)
where TLANDi is the total level of landings of species i and tiis the TAC.
4. Modeling the south east fishery
The model was applied to the Australian south east fishery in order to assess the benefits and costs of conservation of gemfish.
A clustering technique was used to identify unique species groups by main target species, location and depth. Sixteen species groups are incorporated into the model. Each group is made up of various combinations of the quota species, as well as a composite ‘other species’ component. Average monthly catch rates for each group were determined from logbook data over the period 1986 to 1991. Data after this period were excluded because of concerns over reliability of reported catches following the introduction of ITQs. Only data for 1991 were used to determine the monthly catch rate for species groups that were dominated by gemfish and orange roughy. This is because stocks of these species have been in decline since 1986. An average over the entire period would result in higher catch rates being incorporated into the model than occurred in the fishery.
In the model the fleet is split up into three sectors M, the inshore trawler sector, the offshore trawler sector and the Danish seiner sector. Effort,
ex-pressed as days fished, was limited each month based on historical effort levels. The total level of effort that could be employed by a boat over the year was also limited based on historical levels. The species groups to which boats could apply effort was also limited, and was based on historical fishing patterns of the sectors. In some cases, only one boat group had access to a particular species group. For example, only offshore boats had ac-cess to species groups containing orange roughy, while only Danish seiners had access to the species group dominated by whiting. The set of available species groups for each sector was defined by an activity map,Vg,k, which had a value of 1 if a boat in sector kcould harvest a particular groupg, or 0 (zero) if the boat in sectorkcould not harvest the group g.
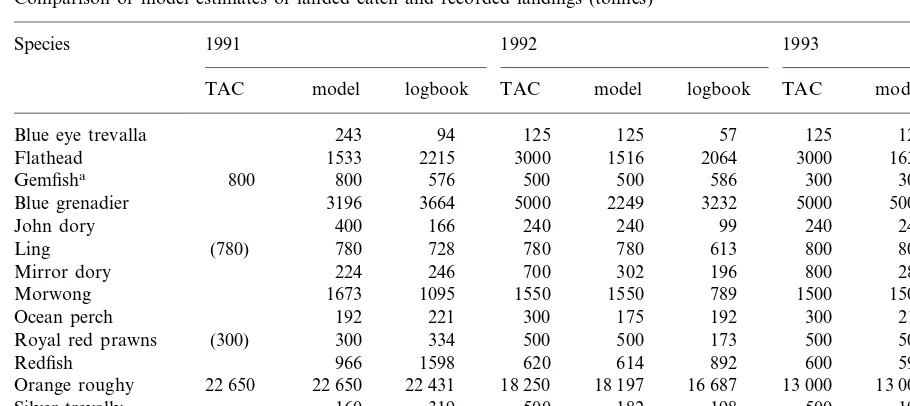
Table 1
Comparison of model estimates of landed catch and recorded landings (tonnes) 1991
Species 1992 1993
TAC model logbook TAC model logbook TAC model logbook 68
Blue eye trevalla 243 94 125 125 57 125 125
1533 2215 3000
Flathead 1516 2064 3000 1635 1298
Gemfisha 800 800 576 500 500 586 300 300 354
3196 3664 5000 2249 3232 5000 5000 3184
Blue grenadier
400 166 240
John dory 240 99 240 240 103
782 800
800 613
780
Ling (780) 780 728 780
224 246 700
Mirror dory 302 196 800 286 284
1673 1095 1550 1550 789 1500 1500
Morwong 709
250 212
300 192
175
Ocean perch 192 221 300
(300) 300 334 500 500 173 500 500
Royal red prawns 184
966 1598 620 614 892 600 592
Redfish 785
22 650 22 650
Orange roughy 22 431 18 250 18 197 16 687 13 000 13 000 10 481
500 319
160 500 195 152
Silver trevally 182 198
2119 2694
Warehou 2741 3000 2159 1587 3000 2211
Whiting 1471 1642 2100 1320 777 2000 1331 1091
aBoth eastern and western gemfish combined.
substantial overestimate of the catch. Restricting effort ensures that, in the model, a variety of species are caught in each month and reduces the potential for catches to be substantially overestimated.
Given this, additional constraints were added to the model to restrict the maximum and minimum number of days that can be fished for any one group. These constraints are given by
DAYSk,m,g]nk forVg,k"0 (12)
DAYSk,m,g50.3dk (13)
for k=inshore sector and Vg,k"0.
DAYSk,m,g=0 forVg,k=0 (14)
wherenkis the minimum number of days fished by a boat in sectorkon any one group in any month. Eq. (13) applies to boats in the inshore sector only, and is imposed to prevent concentration of effort on any one species groups.
5. Model validation
The process of model verification and validation is not straightforward. Oreskes et al. (1994) claim that verification and validation of numerical
mod-els of natural systems is impossible. They argue that the existence of uncertain parameters in a model ensure that it can never be verified as a true representation of the system. While the ability of a model to replicate known events is often used to validate models, this does not prove that the model accurately represents the system (Oreskes et al., 1994). Nevertheless, the converse would hold: if a model cannot reasonably replicate known out-comes, then it definitely does not represent the system.
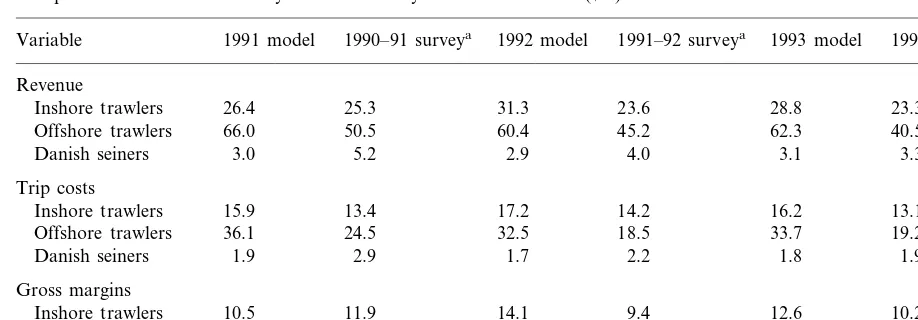
Table 2
Comparison of model and survey estimates of key economic variables ($m)
1990–91 surveya 1992 model 1991–92 surveya 1993 model 1992–93 surveya Variable 1991 model
Revenue
Inshore trawlers 26.4 25.3 31.3 23.6 28.8 23.3
50.5 60.4 45.2 62.3 40.5
Offshore trawlers 66.0
5.2 2.9 4.0
3.0 3.1
Danish seiners 3.3
Trip costs
13.4 17.2 14.2
Inshore trawlers 15.9 16.2 13.1
24.5 32.5 18.5
36.1 33.7
Offshore trawlers 19.2
1.9
Danish seiners 2.9 1.7 2.2 1.8 1.9
Gross margins
11.9 14.1 9.4
10.5 12.6
Inshore trawlers 10.2
26.0 27.9 26.7
Offshore trawlers 29.8 28.6 21.3
2.3 1.2 1.8
1.1 1.3
Danish seiners 1.4
aSource: ABARE, 1993b.
The estimates of landings derived from the model were compared with recorded landings for each year (Table 1). ITQs were introduced on a broad basis in 1992, but TACs for orange roughy and gemfish (both eastern and western combined) were in place in 1991. It was found that limits on landings were also necessary on ling and royal red prawns to prevent overestimation of landings of these species in the 1991 simulation.2
For the 1992 and 1993 simulations, both model estimated land-ings and recorded landland-ings were less than the TAC for most species. In the majority of these cases, the estimated landings were closer to the recorded landings than the TAC. The model does appear, however, to consistently overestimate landings of a number of high value but low quantity species.
The significance of any divergence between the level of landings estimated using the model and recorded landings is difficult to determine. The newness of the ITQ system, problems in allocation and the lack of an established quota trading market
may have resulted in difficulties in quota leasing (Pascoe, 1993). This in turn may have resulted in less catch than might otherwise have been taken, even though quota may still have been available. Where quota could not be obtained by operators, catch of some species may have been discarded, resulting in recorded landings being lower than the true catch. An implicit assumption in the model is that quota can be transferred between boats within each sector of the trawl fleet and between sectors with no impediments or transactions costs.
The estimates of revenue, costs, and gross margin derived from the model were also compared with estimates derived from an economic survey of the fishery (ABARE, 1993b) (Table 2). In most cases, the model estimates of revenues and gross margins were higher than the survey derived estimates, but were generally of similar orders of magnitude. As one estimate is based on a calendar year (January – December) and the other on a financial year (July – June), there is no expectation that the esti-mates should be identical. The relatively higher revenues estimated for the offshore sector using the model is largely a result of using market prices for orange roughy. Most orange roughy is sold directly to processors and incurs little or no handling charges once it leaves the boat. As processor prices were generally not available at the level of detail required in the model, it was assumed that the market price would be similar to the processor price 2The overestimation of ling and royal red prawns was
once the marketing charges had been deducted. As the revenue estimate is before marketing charges are deducted, the total revenue is substan-tially higher than the revenue received from pro-cessors. This higher revenue is largely offset by the higher costs, most of which is as a result of the higher marketing charges assumed in the model. As a result, the gross margin estimated using the model is similar to the survey estimate for the offshore sector.
6. Simulations and results
A number of different simulations were re-quired in order to estimate the relative benefits of gemfish conservation. Conservation of the stock will only result in benefits to the industry (and by implication society, assuming no non-pecuniary benefits) if the future flow of benefits exceeds the costs in terms of foregone profits in the short term. The benefits of recovery and the costs in terms of foregone production need to be deter-mined relative to the profits that could be earned by maintaining the status quo.
The model analyses took the form of three simulations. The first simulation represented the existing situation. This was to provide a bench-mark against which the other scenarios could be assessed. The second simulation represented a fully recovered stock. This was to estimate the potential commercial benefits of stock recovery relative to the benchmark scenario (i.e. status quo). The third simulation involved imposing ad-ditional restrictions on the fishery that may be required to achieve stock recovery. This was to estimate the relative cost of the stock recovery.
In the simulation assuming that the stocks of gemfish had fully recovered, the catch rate of the spawning run group (lk,m,g) was increased until an estimated 3000 tonnes of gemfish were caught in total in the fishery (including bycatch). It was assumed that real prices would not change from their base level as a result of the increase in gemfish supply. Increased landings of gemfish is likely to have some impact on price. However, as gemfish were exported prior to the decline in catches, it is likely that the gemfish price will be
largely determined by the world price. Further, while gemfish prices have risen as a result of the decline in catches in recent years, this increase has been moderated by the existence of close (largely imported) substitutes.
In order to estimate the costs of gemfish recov-ery, it was assumed that catches of gemfish (as compared to landings of gemfish) would need to be reduced to zero to provide the greatest chance for the recovery of the stock. This was run to estimate the relative costs of taking further action to protect gemfish stocks. By setting a zero catch on gemfish, an implicit assumption is made that managers can prevent fishers from targeting groups in which gemfish are caught. The differ-ence between the gross margins under the current situation (zero landings) and the zero catch sce-nario are indicative of the costs associated with stock recovery.
The fishery is subject to random fluctuations in abundance from year to year for most species. To incorporate this feature of the fishery, the model was run with different stock levels. As there are 16 species, there are potentially thousands of combi-nations that could be examined. Catch distribu-tions (ag,i) were randomly varied between three different levels — the base level and up or down by 20%. The model was run 1000 times with a random number determining whether a particular stock in a simulation should be increased, de-creased, or remain the same.
The results of the model simulations are pre-sented in Table 3. These represent the mean val-ues of the 1000 stochastic simulations associated with each scenario. Variability in the results are indicated by the coefficients of variation (i.e. the standard deviation expressed as a percentage of the mean). The model is designed to estimate the possible range of catch and discarding rather than to forecast the actual level that may occur (this will ultimately depend on actual species abun-dance and market factors for the year). As a result, the relative values of the model outcomes are of more significance than the actual values themselves.
manage-Table 3
Estimated gross margins, catch and landings
Current management Full recovery Zero gemfish catch (zero TAC)
Gross margin ($m)
(5)a 39.5 (4) 26.0
Total fishery 34.7 (6)
(6) 17.0 (5)
12.3 4.4
Inshore trawlers (5)
21.2
Offshore trawlers (7) 21.1 (7) 21.6 (7)
1.3
Danish seiners (14) 1.3 (14) 0 (0)
(6) 34.7 (6)
33.1 21.4
Total catch (kt) (7)
Total landings (kt) 31.9 (6) 33.9 (6) 20.8 (7)
aFigures in parentheses are coefficients of variation. ment (Table 3). This reduction in gross margin is not shared equally between the three sectors of the fishery, but is borne entirely by the inshore and Danish seine fleet. It may be necessary to prevent Danish seiners from operating altogether as gemfish is an unavoidable bycatch (albeit at very small levels) for these operators in all months of the year (Table 3). These results assume, of course, that such a policy could be enforced.
A fully recovered gemfish stock may only in-crease total annual gross margins by about 13% relative to the situation under current manage-ment (Table 3). The benefit of such a recovery will be borne solely by the inshore fleet.
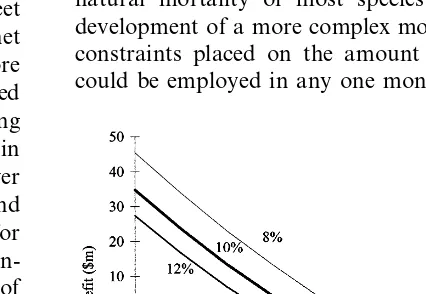
From this, there are no net benefits from recov-ery of the gemfish stock to the Danish seiner fleet or the offshore fleet. There would only be a net benefit in reducing harvest now to the inshore fleet if the increased returns from the recovered stock could be realized in 4 – 6 years, depending on the discount rate (Fig. 1). The net benefits in Fig. 1 were derived by assuming that the lower returns were realized prior to stock recovery and the higher level of returns after stock recovery for an indefinite period. The net benefits to the in-shore fleet were estimated for various periods of stock recovery, and ignore the costs to the Danish seine fleet. Including the costs to the Danish seine fleet would further reduce the benefits, requiring even a faster recovery period to break even. As the expected recovery period is not sufficient to offset the costs to even the inshore fleet, the benefits of recovery are clearly not sufficient to offset the costs to the fishery as a whole.
7. Discussion
The model of the fishery is fairly simplistic so the results have to be viewed with some caution. The assumption of the linear relationship between catch and effort in any one month may result in an overestimation of the catch. While similar as-sumptions are often employed in bioeconomic models (see, for example, Brown et al., 1978; Siegel et al., 1979; Vestergaard, 1996), a preferable approach would be to have the catch per unit of effort varying with the size and vulnerability of the stock. Unfortunately, the complexity of the interactions between species over the year and the absence of information on stock size, growth, and natural mortality of most species inhibited the development of a more complex model. Given the constraints placed on the amount of effort that could be employed in any one month on any one
group of species, it is likely that the catches are not substantially overestimated. From the model validation, the model was able to produce esti-mates of catch that were considered reasonable when compared with the recorded catches over the same period. However, the model could not be expected to provide reasonable estimates of catch and discarding in the future if the fleet size and behavior differed substantially from that which occurred over the period of the data.
While the model allowed fishers to change their allocation of effort between trawling activities in response to the landings restrictions, it did not allow operators to change fishing gear. This is an often seen response in fisheries managed under ITQs. However, in the case of the south east fishery, quotas were initially allocated only to trawler operators. While other gear types existed in the fishery (e.g. long line), these were subject to a different management regime. Permits to oper-ate in the fishery were gear specific. This pre-vented trawler operators using alternative gear types to take their catch.
The model results suggest that reducing gemfish catch to zero would only produce benefits to the inshore sector if the stock could recover to a level that can sustain a catch of 3000 tonnes a year within 4 – 6 years, depending on the discount rate used. It could be assumed that Danish seiners would be exempt from the ban on catching gemfish as they catch only a small quantity, whereas the effects of such a ban would be to totally prevent them from operating. Therefore, the estimated costs to this sector can be effectively ignored as they would not, presumably, be in-curred. The offshore fleet is likely to be largely unaffected by such a ban.
It may be many years before a normal age structure of the fishery emerges, and there remains a risk that the stock may never recover (Rowlings, 1995). The 1997 stock assessment indicated that the spawning biomass is only 40% of its target level (Bureau of Resource Science, 1998). Nicholls (1993) estimated that that five or six strong co-horts would need to be sustained for at least 4 or 5 years for there to be any viable fishery in the future. This would require a minimum of 9 years (i.e. the fifth cohort survives 4 years), assuming
that the first of the strong cohorts appeared the first year of the additional conservation measures. Given this, it is not likely that the stock will recover in the necessary period to ensure a net commercial benefit from additional conservation measures.
Non-market benefits of conserving the gemfish stock (for example, existence value and option value) have not been considered in the above analysis. It is conceivable that the nonmarket benefits may be substantial, particularly if there is a high risk of stock extinction. Loomis and White (1996) suggest that, based on a meta-analysis of contingent valuation studies of a range of species, the benefits of species preservation outweigh even the most expensive preservation efforts. If the non-market benefits from conserving the resource are estimated to exceed the loss to the commercial fishers, there may still be benefits to society as a whole in conserving the resource. However, be-cause this is likely to impose a cost on the com-mercial fishery, it is likely that some form of compensation will need to be paid.
The non-market benefits in this instance, how-ever, may not be substantial. While a separate and unique stock, the eastern gemfish are the same species as western gemfish. Additional gemfish stocks are found around New Zealand. Most studies that have estimated non-use values of wildlife resources have examined the value of a species (e.g. Boyle and Bishop, 1987; Rubin et al., 1991), rather than stocks. Assuming that existence and option values are relevant at the species rather than stock level, then the existence value of a stock would only be significant if the species as a whole was threatened. The non-use value of an individual decreases as the number of individuals in existence increases (Eagle and Betters, 1998).
previ-ously, while the stock does not appear to be deteriorating further, there are few indications that rebuilding is taking place.
The analysis has not considered the relative costs of adopting some other form of manage-ment policy in order to protect gemfish. The only alternative policy could be to close the entire fishery down during the spawning run to prevent targeted and incidental catch of gemfish. This is likely to impose the same cost on inshore fishers as the zero catch of gemfish, because the gemfish ban effectively closes the fishery to inshore fishers during the spawning run. However, a total closure may also have implications for the offshore fleet (who are also capable but currently do not catch gemfish due the absence of quota) and Danish seiners who could be expected to be exempt from a ban. Hence the cost to the industry as a whole from a closure is likely to be greater than that given the current TAC system. Input controls and other technical measures have generally proved ineffective in conserving individual species within a multispecies fishery because of the technical interactions in the fishery, as demonstrated by the collapse of several major stocks around the world in recent years in input-control managed fisheries (in particular, the collapse of the Canadian cod stocks off the Grand Banks and several stocks of other species in the US north east fishery). Incen-tives can only be created to avoid particular spe-cies though either output controls or a penalty (tax) system for landing threatened species. Of these two options, output controls have generally been the most acceptable. Where penalties have been imposed, these have often proved to be less than the social value of the species, resulting in a sub-optimal outcome (Eagle and Betters, 1998).
8. Conclusions
The analysis highlights the potential conflict between economic and biological objectives of management. In many cases managers have an expectation that the conservation requirements of management can only be met when the stock is healthy and capable of producing either the maxi-mum sustainable yield or maximaxi-mum economic
yield. In the case of a single species fishery, the economically optimal utilization of the resource generally requires a healthy fish stock (although as pointed out earlier, an optimal harvesting strat-egy from an economic viewpoint could involve the depletion of a slow growing stock). With a multi-species fishery, an optimal-harvesting strategy for a species may differ substantially from that of the strategy of a single species fishery (Anderson, 1975).
In most fisheries, it is very difficult to fish a stock to biological extinction. It is generally un-profitable to continue targeting a species at low stock levels, particularly if other species are avail-able that are likely to provide a greater return per unit cost of effort. As a result, the non-market benefits associated with a stock are likely to be preserved even if a stock is fished to commercial extinction (the level at which it is no longer profitable to continue to harvest). In a multispe-cies fishery with imperfect gear selectivity for indi-vidual species, there will often arise situations where some stocks are exploited more heavily than others.
With most fisheries resources around the world currently being overexploited, and with the col-lapse of several major fish stocks in recent years (such as off the north east of the USA and off the east coast of Canada), the issue of conservation of single species within multispecies fisheries will be-come increasingly important. The introduction of output controls into these fisheries will be a neces-sary, but not sufficient, condition for conservation.
As a result, managers may need to review their conservation objectives. Fishery managers and so-ciety as a whole must decide if they want to conserve every species in the multispecies commu-nity, at what level, and at what cost. In some cases, such as the case of the eastern gemfish, the benefits may not outweigh the costs.
Acknowledgements
(ABARE). Useful comments were provided by Louisa Coglan and three anonymous reviewers. The cluster analysis was undertaken by Neil Klaer from the Bureau of Resource Science, Australia (now at CSIRO, Hobart).
References
ABARE, 1993a. Annual Fisheries Statistics 1993. ABARE, Canberra.
ABARE, 1993b. Fisheries Surveys Report 1993. ABARE, Canberra.
Bishop, R.C., 1978. Endangered species and uncertainty: the economics of a safe minimum standard. Am. J. Agric. Econom. 60, 10 – 18.
Boyle, K.J., Bishop, R.C., 1987. Valuing wildlife in benefit-cost analyses: a case study involving endangered species. Water Resour. Res. 23, 943 – 950.
AFMA, 1997. News from the Board. Professional Fisherman. June 1997, 12.
Anderson, L.G., 1975. Analysis of open-access commercial exploitation and maximum economic yield in biologically and technologically interdependent fisheries. J. Fish. Res. Board Can. 32, 1825 – 1842.
Anderson, L.G., 1982. The economics of multi-purpose fleet behavior. In: Murman, L.J., Spulber, D.F. (Eds.), Essays in the Economics of Renewable Resources. New Holland. Bragg, J., 1994. Myths of salmon recovery. Pacific Fishing
(August) 15, 33 – 37.
Brown, B.E., Brennan, J.A., Palmer, J.E., 1978. Linear pro-gramming simulations of the effects of bycatch on the management of mixed species fisheries off the Northeastern coast of the United States. Fish. Bull. 76, 851 – 860. Bureau of Resource Science, 1998. Fisheries Status Report
1998. AGPS, Canberra.
Cheng, K.S., Lin, C.J., Wang, A.Y., 1981. Analysis of modified model for commercial fishing with possible extinctive fishery resources. J. Environ. Econom. Manag. 8, 151 – 155. Clark, C.W., 1990. Mathematical Bioeconomics: The Optimal
Management of Renewable Resources, 2nd edition. John Wiley, New York.
Clark, C.W., Munro, G.R., Charles, A.T., 1985. Fisheries, dynamics and uncertainty. In: Scott, A. (Ed.), Progress in Natural Resource Economics. Clarendon Press, Great Britain, pp. 99 – 120.
Eagle, J.G., Betters, D.R., 1998. The endangered species act and economic values: a comparison of fines and contingent valuation studies. Ecol. Econom. 26, 165 – 171.
Ess, C., 1994. AK Salmon: less fish, more money. Pacific Fishing (October) 15, 16 – 17.
Frost, H., Rodgers, P., Valatin, G., Lantz, F., Lewy, P., Vestergaard, N., 1993. A Bioeconomic Model of the North Sea Multispecies Multiple Gears Fishery. South Jutland University Press, Esbjerg.
Kailola, P.J., Williams, M.J., Stewart, P.C., Reichelt, R.E., McNee, A., Grieve, C., 1993. Australian Fisheries Re-sources. Bureau of Resource Science, Canberra.
Kirkley, J.E., Strand, I.E., 1988. The technology and manage-ment of multispecies fisheries. Appl. Econom. 20, 1279 – 1292.
Lewis, Y., 1994. Life support for Columbia salmon. Pacific Fishing (November) 15, 42 – 53.
Loomis, J.B., White, D.S., 1996. Economic benefits of rare and endangered species: a summary and meta-analysis. Ecol. Econom. 18, 197 – 206.
Mardle, S., Pascoe, S., Tamiz, M. and Jones D. 1999. Resource allocation in the North Sea: an application of multi-objec-tive programming. Annals of Operations Research [in press] Moyle, B., 1998. Species conservation and the principal-agent
problem. Ecol. Econom. 26 (3), 313 – 321.
Murawski, S.A., Finn, J.T., 1985. Optimal effort allocation among competing mixed species fisheries, subject to fishing mortality constraints. Can. J. Fish. Aquatic Sci. 43, 90 – 100. Nicholls, R., 1993. Geelong brings a resolve to make workshop
better. Aust. Fish. 52, 6 – 10.
Oreskes, N., Shrader-Frechette, K., Belitz, K., 1994. Verifica-tion, validation and confirmation of numerical models in the earth sciences. Science 263, 646.
Pascoe, S., 1993. ITQs in the south east fishery. Marine Resour. Econom. 8, 395 – 401.
Pascoe, S. 1997. A preliminary bioeconomic model of the UK component of the fisheries of the English Channel, CE-MARE Research Paper P 112, CECE-MARE.
Pascoe, S. 1998. Bycatch Management and the Economics of Discarding. FAO Fisheries Technical Report 370, FAO, Rome, 140p.
Rowlings, K., 1995. Eastern gemfish... will they come back? Aust. Fish. 54, 8 – 9.
Rubin, J., Helfand, G., Loomis, J., 1991. A benefit-cost analysis of the northern spotted owl. J. For. (December) 89, 25 – 30. Schellberg, T., 1993. The problem of non-malleable capital revisited: a study of the Pacific halibut fishery. Nat. Resour. Model. 7, 245 – 276.
Siegel, R.A., Mueller, J.J., Rothschild, B.J., 1979. A linear programming approach to determining harvesting capacity: a multiple species fishery. Fish. Bull. 77, 425 – 433. Sinclair, S.F., 1985. A linear programming analysis of Scotian
Shelf offshore fisheries. In: Mahon, R (Ed.), Towards the Inclusion of Fisheries Interactions in Management Advice (Canadian Technical Report of Fisheries and Aquatic Sci-ence No 1347), pp. 92 – 103.
Thunberg, E.M., Bresnyan, E.W., Adams, C.M., 1995. Eco-nomic analysis of technical interdependencies and the value of effort in a multi-species fishery. Marine Resour. Econom. 10, 59 – 76.
Vestergaard, N., 1996. Discard behavior, highgrading and regulation: the case of the Greenland shrimp fishery. Marine Resour. Econom. 11 (4), 247 – 266.