Statistik Asuransi Gempa Bumi Indonesia 2017
Indonesian Earthquake Insurance Statistics 2017
Bapak dan Ibu Direksi Perusahaan Asuransi yang saya hormati,
Dengan mengucap Puji Syukur Kehadirat Tuhan Yang Maha Esa, buku “Laporan Statistik Asuransi Gempa Bumi Indonesia (LSAGBI) Desember 2017” telah selesai disusun. Laporan ini merupakan salah satu hasil Misi Maipark dalam membangun database kebencanaan dan diharapkan mampu mendukung industri asuransi umum dalam mengelola risiko kebencanaan.
Pada laporan periode ini terdapat kajian yang kami
tambahkan dan perdalam. Tambahan kajian dilakukan
atas perbandingan pertumbuhan premi industri asuransi umum Indonesia dan beberapa negara ASEAN tahun 2017. Kami juga menambahkan kajian pertumbuhan premi asuransi umum dan harta benda Indonesia 7 tahun terakhir. Pendalaman kajian dilakukan atas data premi, eksposur dan jumlah risiko meliputi kenaikan dan penurunan yang terjadi atas suatu wilayah atau okupasi. Kematangan data sesi juga diulas lebih lanjut sebagai salah satu alat pendukung dalam melakukan estimasi pertambahan premi ke depan. Ulasan aktuaria dan ulasan asuransi kali ini lebih menyoroti kesesuaian metode pencadangan klaim atas risiko gempa bumi dan manfaat data mining di (re)asuransi. Atas adanya format baru dalam zonasi dengan resolusi rendah terbaru untuk Indonesia, kami
melakukan pemutakhiran Cresta Zone menjadi per
provinsi saja.
Hasil di atas tak lepas dari dukungan seluruh industri
asuransi umum. Kami menyadari atas kebutuhan
peningkatan mutu laporan dan melalui saran maupun kritik yang disampaikan akan dipergunakan dalam perbaikan ke depan.
Akhir kata, semoga laporan yang disajikan dapat
memenuhi harapan dan kami mohon maaf jika terdapat kesalahan penulisan dan data yang disajikan.
Hormat kami,
Dear Sir / Madam,
Our gratitude to God Almighty, the “Indonesian Earthquake Insurance Statistic Report December 2017” is ready to publish. This report is one of the results of the Maipark’s Mission in developing catastrophe database and is expected to support the general insurance industry in catastrophe risk management.
There are some additional and more deep study in this report. Additional study were done on the comparison of premium growth of Indonesia's general insurance industry and some ASEAN countries in 2017. We also adding study on premium growth of general insurance and property of Indonesia in the last 7 years.
More deep study is done on premium, exposure and number of risk data relate to the increase and decrease upon region or occupation.
The maturity of data session is also studied further as one of the supporting tools for estimating the increase in future premium.
Actuarial reviews and insurance reviews highlight the appropriateness of claims reserve methods for earthquake risks and the benefits of data mining on (re)insurance. Due to introduction upon new format in zoning with new low resolution for Indonesia, we are updating the Cresta Zone to province only.
The above results can not be separated from the support of the entire general insurance industry. We are aware the need to improve the quality of the report and suggestions and criticisms will be used in the future improvements.
Finally, hopefully the report could meet the expectations and we apologize for any possible errors presented and data in this report.
Sincerely,
Yasril Y. Rasyid
President Director
Kata Pengantar
Foreword
iKata Pengantar...i Foreword Daftar Isi...ii Contents Keadaan Ekonomi 2017: Economy Outlook 2017:
Ekonomi dan Asuransi di Kawasan ...2
Economy and Insurance in the Region
Produk Domestik Bruto 2017.………...3
Gross Domestic Product 2017
Keadaan Asuransi 2017 Insurance Outlook 2017: Premi Asuransi 2017...4 Insurance Premium 2017 Industri Asuransi 2017...4 Insurance Industry 2017
Catatan Asuransi Gempa Bumi 2004 -2017: Earthquake Insurance 2004-2017:
Premi 2004-2017 ...5
Premium 2004-2017
Eksposur 2004-2017 ...6
Exposure 2004-2017
Analisis Perkembangan Data 2016 -2017...7 Data Development Analysis of 2016-2017
10 Besar Klaim Events 2004-2017 ...12
Top 10 Claim Events 2004-2017 Premi Asuransi Gempa Bumi 2017:
Earthquake Insurance Premium 2017:
Premi Per Okupasi UY 2012-2017 ...14
Premium by Occupation UY 2012-2017
Premi Per Interest UY 2012-2017 ...15
Premium by Interest UY 2012-2017
Premi: Distribusi Okupasi UY 2017 ...16
Premium: Occupation Distribution UY 2017 Eksposur Asuransi Gempa Bumi 2017:
Earthquake Insurance Exposure 2017:
Eksposur Per Okupasi UY 2012-2017 ...17
Exposure by Occupation UY 2012-2017
Eksposur Per Interest UY 2012-2017... ...18
Daftar Isi
Jumlah Risiko Asuransi Gempa Bumi 2017:
Earthquake Insurance Number of Risk 2017:
Jumlah Risiko Per Okupasi UY 2012-2017 ...20
Number of Risk by Occupation UY 2012-2017
Klaim Events Asuransi Gempa Bumi 2017 ...21
Earthquake Insurance Claim Events 2017
Shakemap untuk Sibolangit dan Tabanan...22
Shakemap for Sibolangit dan Tabanan
Daftar Gempa Bumi 2017 Magnitudo≥ 6.0 Mw ...24
Earthquake List 2017 Magnitude≥ 6.0 Mw
Ulasan Aktuaria: Kesesuaian Metode Segitiga Terhadap Karakteristik Risiko Bencana Alam………...26 Actuarial Review: Compatibility of triangle method to the catastrophe risk characteristics
Ulasan Asuransi: Data Mining di (Re)Insurance...29 Actuarial Review:Data Mining in (Re)Insurance
Data Detail:
Detail Data:
Tabel 2.1 Exposure Aggregate National per Provinsi...34
Table 2.1 National Aggregate Exposure by Province
Tabel 2.2 Exposure Aggregate National per Okupasi...35
Table 2.2 National Aggregate Exposure by Occupacy.
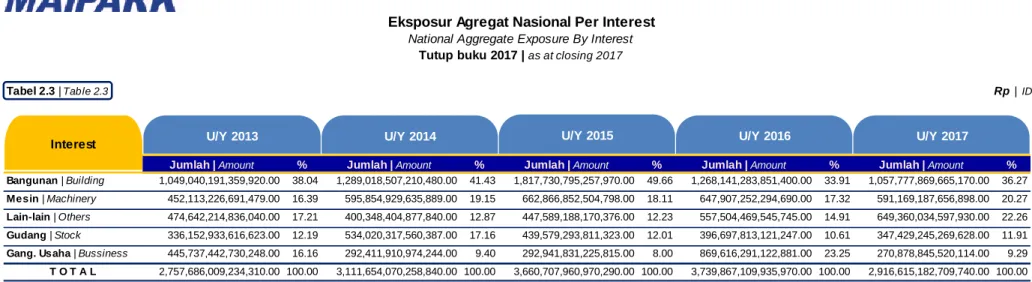
Tabel 2.3 Exposure Aggregate National per Interest...37
Table 2.3 National Aggregate Exposure by Interest
Tabel 2.4 Exposure Aggregate National per Kelas Konstruksi...39
Table 2.4 National Aggregate Exposure by Class Construction
Tabel 2.5 Exposure Aggregate National Onrisk per Provinsi...41
Table 2.5 National Aggregate Exposure Onriks by Province
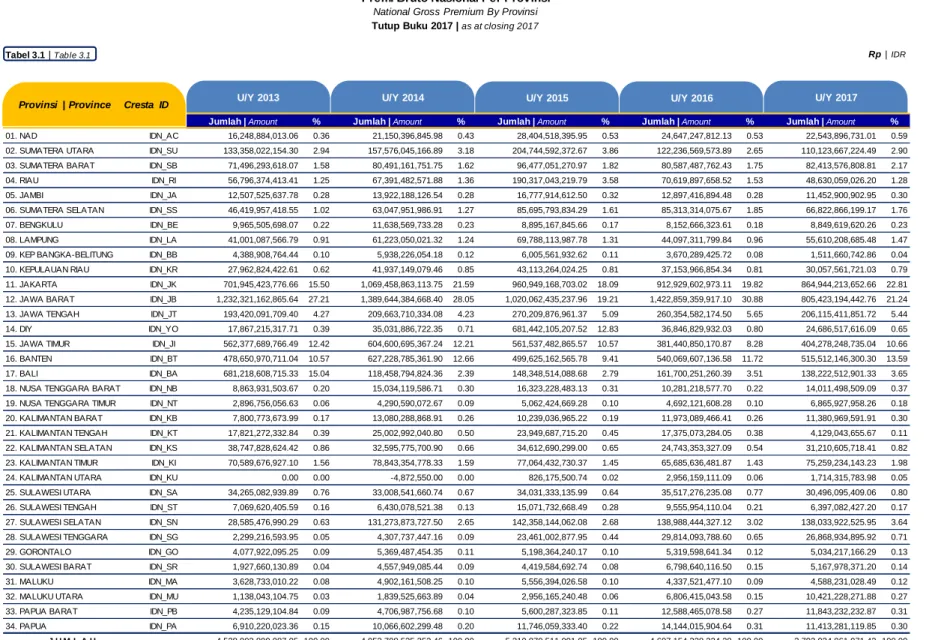
Tabel 3.1 Premi Bruto National per Provinsi ...42
Table 3.1 National Gross Premium by Province
Tabel 3.2 Premi Bruto National per Okupasi...43
Table 3.2 National Gross Premium by Occupation
Tabel 3.3 Premi Bruto National per Interest ...45
Table 3.3 National Gross Premium by Interest
Tabel 3.4 Premi Bruto National per Kelas Konstruksi ...47
Table 3.4 National Gross Premium by Class Construction
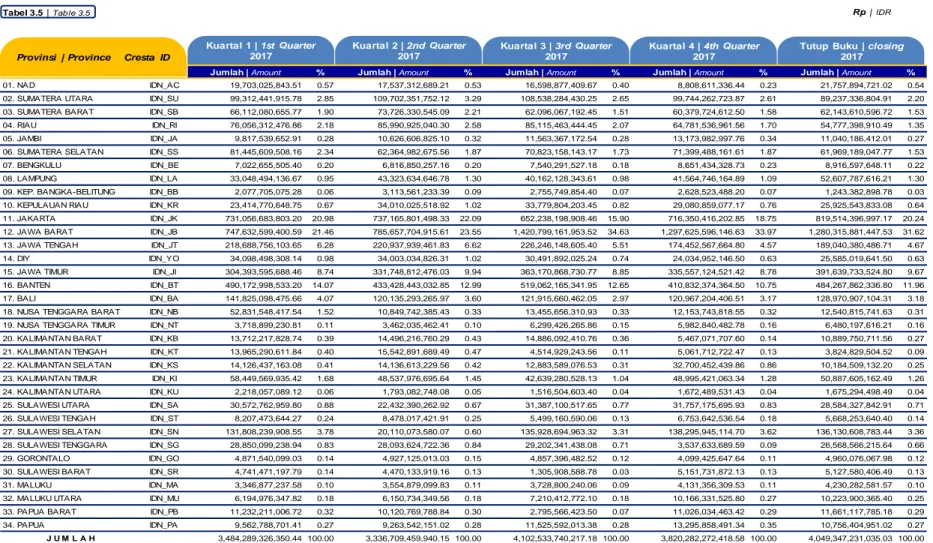
Tabel 3.5 Premi Bruto National Onrisk per Provinsi...49
Table 3.5 National Gross Premium Onrisk by Province
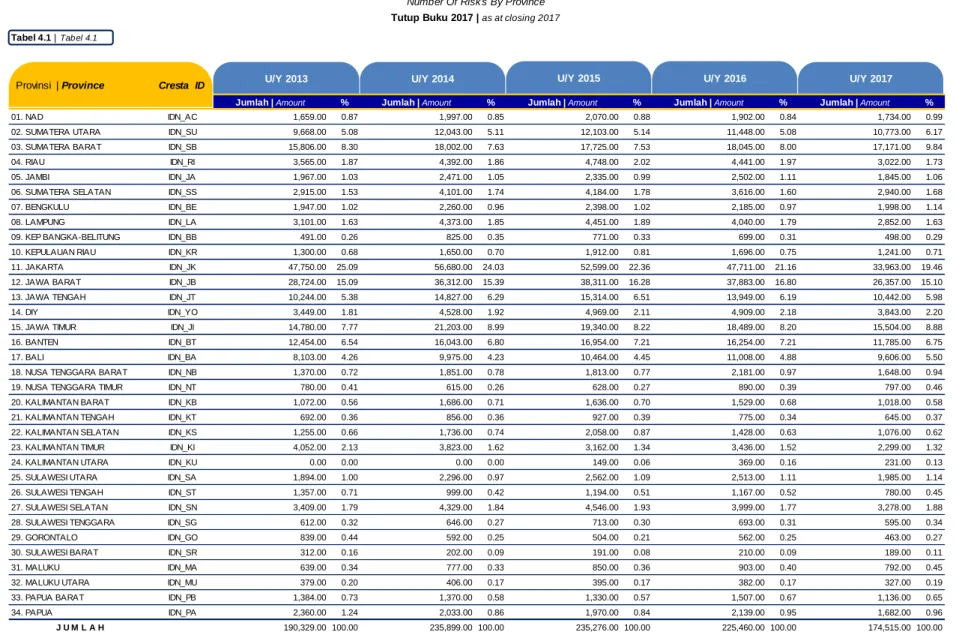
Tabel 4.1 Jumlah Risiko per Provinsi ...50
Table 4.1 Number Of Risk By Province
Tabel 4.2 Jumlah Risiko per Okupasi ...51
Table 4.2 Number Of Risk By Occupation
Tabel 4.3 Jumlah Risiko per Kelas Konstruksi...53
Table 4.3 Number Of Risk By Class Construction
Tabel 4.4 Jumlah Risiko Onrisk per Provinsi...55
Table 4.4 Onrisk Number of risk by Province
Daftar Isi
Contents
Tabel 5.2 Frekuensi Klaim per Okupasi ...56
Table 5.2 Claim Frequency By Occupation
Tabel 5.3 Frekuensi Klaim per Provinsi ...57
Table 5.3 Claim Frequency By Province
Tabel 5.5 Nominal Klaim per Okupasi ...59
Table 5.5 Claim By Occupation
Tabel 5.6 Nominal Klaim per Provinsi ...60
Table 5.6 Claim By Province
Risk & Loss:
Risk & Loss:
Underwriting Year 2013 - 2017, Seluruh Okupasi ...63 Underwriting Year 2013 - 2017, All Occupation
Underwriting Year 2017, Seluruh Okupasi ...64 Underwriting Year 2017, All Occupation
Underwriting Year 2016, Seluruh Okupasi ...65 Underwriting Year 2016, All Occupation
Underwriting Year 2015, Seluruh Okupasi ...66 Underwriting Year 2015, All Occupation
Underwriting Year 2014, Seluruh Okupasi ...67 Underwriting Year 2014, All Occupation
Underwriting Year 2013, Seluruh Okupasi ...68 Underwriting Year 2013, All Occupation
Underwriting Year 2013 - 2017, Okupasi Agrikultural...69 Underwriting Year 2013 - 2017, Agricultural Occupation
Underwriting Year 2017, Okupasi Agrikultural ...70 Underwriting Year 2017, Agricultural Occupation
Underwriting Year 2016, Okupasi Agrikultural ...71 Underwriting Year 2016, Agricultural Occupation
Underwriting Year 2015, Okupasi Agrikultural ...72 Underwriting Year 2015, Agricultural Occupation
Underwriting Year 2014, Okupasi Agrikultural ...73 Underwriting Year 2014, Agricultural Occupation
Underwriting Year 2013, Okupasi Agrikultural ...74 Underwriting Year 2013, Agricultural Occupation
Underwriting Year 2013 - 2017, Okupasi Komersial...75 Underwriting Year 2013 - 2017, Commercial Occupation
Underwriting Year 2017, Okupasi Komersial ...76 Underwriting Year 2017, Commercial Occupation
Underwriting Year 2016, Okupasi Komersial ...77 Underwriting Year 2016, Commercial Occupation
Underwriting Year 2015, Okupasi Komersial ...78 Underwriting Year 2015, Commercial Occupation
Underwriting Year 2014, Okupasi Komersial ...79
Daftar Isi
Underwriting Year 2013 - 2017, Okupasi Industrial...81 Underwriting Year 2013 - 2017, Industrial Occupation
Underwriting Year 2017, Okupasi Industrial ...82 Underwriting Year 2017, Industrial Occupation
Underwriting Year 2016, Okupasi Industrial ...83 Underwriting Year 2016, Industrial Occupation
Underwriting Year 2015, Okupasi Industrial ...84 Underwriting Year 2015, Industrial Occupation
Underwriting Year 2014, Okupasi Industrial ...85 Underwriting Year 2014, Industrial Occupation
Underwriting Year 2013, Okupasi Industrial ...86 Underwriting Year 2013, Industrial Occupation
Underwriting Year 2013 - 2017, Okupasi Residential...87 Underwriting Year 2013 - 2017, Residensial Occupation
Underwriting Year 2017, Okupasi Residensial ...88 Underwriting Year 2017, Residensial Occupation
Underwriting Year 2016, Okupasi Residensial ...89 Underwriting Year 2016, Residensial Occupation
Underwriting Year 2015, Okupasi Residensial ...90 Underwriting Year 2015, Residensial Occupation
Underwriting Year 2014, Okupasi Residensial ...91 Underwriting Year 2014, Residensial Occupation
Underwriting Year 2013, Okupasi Residensial ...92 Underwriting Year 2013, Residensial Occupation
Exposure, Premi Bruto, Jumlah Risiko & Klaim
per Okupasi, Underwriting Year 2017 ...93 Exposure, Gross Premium, Number of Risk & Claim
by Occupation, Underwriting Year 2017 Exposure, Premi Bruto, Jumlah Risiko & Klaim
per Okupasi, Underwriting Year 2016 ……….……...…..…..94 Exposure, Gross Premium, Number of Risk & Claim
by Occupation, Underwriting Year 2016 Exposure, Premi Bruto, Jumlah Risiko & Klaim
per Okupasi, Underwriting Year 2015 ………...…...…...95 Exposure, Gross Premium, Number of Risk & Claim
by Occupation, Underwriting Year 2015 Exposure, Premi Bruto, Jumlah Risiko & Klaim
per Okupasi, Underwriting Year 2014 ...96 Exposure, Gross Premium, Number of Risk & Claim
by Occupation, Underwriting Year 2014 Exposure, Premi Bruto, Jumlah Risiko & Klaim
per Okupasi, Underwriting Year 2013 ...97 Exposure, Gross Premium, Number of Risk & Claim
by Occupation, Underwriting Year 2013
Daftar Isi
Contents
Exposure, Premi Bruto, Jumlah Risiko & Klaim
per Provinsi, Underwriting Year 2017 ...98 Exposure, Gross Premium, Number of Risk & Claim
by Province, Underwriting Year 2017
Exposure, Premi Bruto, Jumlah Risiko & Klaim
per Provinsi, Underwriting Year 2016 ...99 Exposure, Gross Premium, Number of Risk & Claim
by Province, Underwriting Year 2015
Exposure, Premi Bruto, Jumlah Risiko & Klaim
per Provinsi, Underwriting Year 2015 ...100 Exposure, Gross Premium, Number of Risk & Claim
by Province, Underwriting Year 2014
Exposure, Premi Bruto, Jumlah Risiko & Klaim
per Provinsi, Underwriting Year 2014 ...101 Exposure, Gross Premium, Number of Risk & Claim
by Province, Underwriting Year 2013
Exposure, Premi Bruto, Jumlah Risiko & Klaim
per Provinsi, Underwriting Year 2013 ...102 Exposure, Gross Premium, Number of Risk & Claim
by Province, Underwriting Year 2012
Lampiran:
Annexes:
Daftar Istilah Statistik ...104 Statistical Glossary
Tarif dan Zona Asuransi Gempa Bumi Indonesia ...106 IndonesiaEarthquakeInsurance Tariff and Zone
Daftar Cresta Zone Untuk Indonesia ...123 Cresta Zone List For Indonesia
Skala untuk First Loss, Rate Polis Jangka Pendek, Periode Indemnity ...130 Scale for Fisrt Loss, Short Period Policy Rate, Indemnity Period
Kode Okupasi ...133 Occupation Code
Daftar Isi
Produk Domestik Bruto 2017
Gross Domestic Product 2017Premi Sektor Asuransi 2017
Insurance Sector Premium 2017Asuransi Gempa Bumi 2004-2017
Earthquake Insurance 2004-2017Gambaran Ekonomi – Industri Asuransi 2017
Economic – Insurance Industry Outlook 2017
16.70% 10.61% 2.72% -0.10% 6.01% 0.80% 9.93% 6.40% 12.13% 3.16% 7.54% 2.43%
Non-Life Insurance Premium Growth 2011 - 2017
Ekonomi dan Asuransi di Kawasan
Economy and Insurance in the Region
Keadaan Ekonomi 2017
.
Economic Outlook 2017
Thailand
Population 68,9 Million
GDP USD 407,026 Million
Vietnam
Population 92,7 Million
GDP USD 205,276 Million
Philippine
Population 103,3 Million
GDP USD 304,905 Million
Malaysia
Population 31,2 Million
GDP USD 296,536 Million
Singapore
Population 5,6 Million
GDP USD 296,976 Million
Indonesia
Population 261,1 Million
GDP USD 932,259 Million
7.00% 6.30% 5.40% 4.80% 3.10% 2.50% 6.23% 6.04% 5.40% 5.06% 3.96% 3.61% Philippine Vietnam Indonesia Malaysia Thailand SingaporeGDP Growth 2011 - 2017
Annual Average Growth 2011 - 2017 Growth 2017
Pertumbuhan premi asuransi umum di Indonesia pada tahun 2017 tergolong kecil dibandingkan dengan Vietnam dan Filipina yang memiliki kemiripan kondisi market asuransi umum dengan Indonesia. Berbeda dengan kondisi market asuransi umum di Negara Singapura yang telah matang, pertumbuhan premi asuransi umum relatif kecil.
General insurance premium growth of Indonesia in 2017 is relatively smaller than Vietnam and the Philippines which have similar general insurance market condition compared to Indonesia. In contrast, general insurance market conditions in Singapore has matured with relatively small growth of general insurance premium.
Reasuransi MAIPARK | 2
IDR 9.913 Trillion
IDR 398,9 Trillion
Rp9.913 triliun adalah total Produk Domestik Bruto (PDB) Indonesia pada tahun 2017. Tiga sektor usaha dengan kontribusi paling besar adalah: (i) Industri Pengolahan – 21,22%, (ii) Perdagangan Besar Eceran; Reparasi Mobil dan Sepeda Motor – 13,23% dan (iii) Pertanian, Kehutanan dan Perikanan – 12,68%.
IDR9,913 trillion is Indonesia’s GDP 2017. Three sectors with highest contribution are: (i) Processing Industry – 21.22%, (ii) Grocery, Retail and Automotive Trading – 13.23% and (iii) Farming, Forestry and Fisheries – 12.68%.
Rp398,9 triliun adalah besaran PDB dalam kelompok usaha Jasa Keuangan dan Asuransi. Sektor ini berkontribusi sebesar
Produk Domestik Bruto 2017
Gross Domestic Product 2017
Selama 7 tahun terakhir, pertumbuhan PDB Indonesia mencapai titik tertinggi sebesar 6,17% pada tahun 2011. Sejak tahun 2011 sampai dengan tahun 2015, pertumbuhan PDB mengalami tren negatif. Pertumbuhan PDB paling kecil adalah sebesar 4,83% pada tahun 2015. Setelah itu, sejak tahun 2016 pertumbuhan PDB mulai menunjukkan tren positif yaitu sebesar 5,03% pada tahun 2016 dan 5,07% pada tahun 2017.
Laju pertumbuhan pada sektor Jasa Keuangan dan Asuransi tahun 2017 mencapai 5,48% dimana angka tersebut lebih kecil dari pertumbuhan tahun sebelumnya yang mencapai 8,9%. Laju pertumbuhan tertinggi terjadi pada sektor Informasi dan Komunikasi yaitu mencapai 9,81%.
For the last 7 years, Indonesia's GDP growth has reached the highest rate of 6.17% in 2011. After that, GDP growth shows negative trend, reaching the smallest value of 4.83% in 2015. GDP growth began showing positive trend since 2016 i.e. 5.03% in 2016 and 5.07% in 2017.
The growth rate of Financial Services and Insurance sector has only reached 5.48% in 2017, lower than the previous year growth i.e. 8.9%. The highest growth rate occurred in the Information and Communications sector which is 9.81%.
Source: Badan Pusat Statistik, 2017
In trillion IDR
Keadaan Ekonomi 2017
.
Economic Outlook 2017
6,864.13 7,287.64 7,727.08 8,158.19 8,568.12 8,982.50 9,434.60 9,912.70 2010 2011 2012 2013 2014 2015 2016 2017 5.07% 5.03% 4.84% 5.02% 5.58% 6.03% 6.17%
Premi Asuransi 2017
Insurance Premium 2017
Produksi premi asuransi jiwa lebih tinggi dibandingkan dengan asuransi umum. Dari total produksi premi 2017 sebesar Rp241 triliun, asuransi jiwa berkontribusi sebesar 73,85% sedangkan asuransi umum hanya 26,15%. Dari total asuransi umum tersebut , 28,95% merupakan produksi premi asuransi umum dari lini bisnis harta benda.
Life insurance premium production is higher than general insurance. Life insurance contribute 73.85% of Rp241 trillion, the total premium production in 2017, whereas general insurance contribute only 26.15%. The premium production of general insurance from the property line of business is 28.95% of total general insurance premium.
6
Perusahaan
Reasuransi
Reinsurance
76
Perusahaan
Asuransi Umum
General Insurance
54
Perusahaan
Asuransi Jiwa
Life Insurance
5
Asuransi
Wajib dan Sosial
Mandatory and Social Insurance
AJ
AU-O
AU-P
Uraian/Description Premi /Premium
Asuransi Jiwa/
Life Insurance (AJ) 178,433,166
Asuransi Umum - Harta Benda/
General Insurance - Property (AU-P) 18,290,350
Asuransi Umum - Lainnya/
General Insurance - Others (AU-O) 44,896,100
Industri Asuransi 2017 -
Insurance Industry 2017
In million IDR
Source: OJK, AAUI 2017
Source: OJK, AAUI, 2017 7.57%
18.58%
73.85%
Keadaan Asuransi 2017
.
Insurance Outlook 2017
8.64 9.64 10.82 12.66 16.08 17.67 19.25 18.29
2010 2011 2012 2013 2014 2015 2016 2017
General Insurance – Property Premium
-4.98% 8.91% 9.92% 26.97% 17.07% 12.26% 11.54% In trillion IDR
Angka pertumbuhan premi asuransi umum dari tahun 2011 sampai dengan 2017 memiliki kecenderungan menurun. Tahun 2017 memiliki angka pertumbuhan terkecil dalam 7 tahun terakhir, yaitu 2,72% dimana premi harta benda mengalami penurunan sebesar 4,98%.
General insurance premium growth from 2011 to 2017 tend to decrease. The smallest growth for the last 7 years occurred in 2017, i.e. 2.72% with the property premium decrease i.e. 4.98%.
28.70 33.86 38.97 46.80 55.17 58.89 61.51 63.19
2010 2011 2012 2013 2014 2015 2016 2017
General Insurance Premium
2.72% 4.45% 6.73% 17.90% 20.08% 15.10% 17.99%
In trillion IDR Source: AAUI
Reasuransi MAIPARK | 4
Pada tanggal 19 Juli 2017, OJK telah memberikan izin usaha di bidang reasuransi kepada PT Reasuransi Nusantara
Makmur, sehingga semenjak itu jumlah perusahaan reasuransi menjadi enam perusahaan. Kami mengucapkan selamat dan
berharap dengan kehadiran perusahaan reasuransi yang baru ini dapat meningkatkan kualitas industri asuransi di Indonesia secara keseluruhan.
OJK has granted reinsurance license to PT Reasuransi Nusantara Makmur on July 19, 2017, making the number of reinsurance companies become six companies. We congratulate and hope that the presence of this new reinsurance company may improve the quality of the insurance industry as a whole in Indonesia.
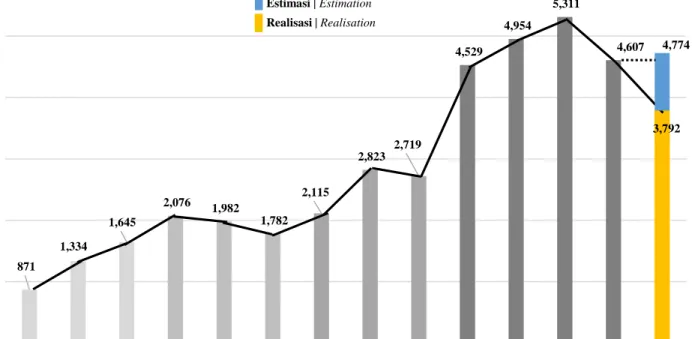
Grafik ini menampilkan pertumbuhan premi dari underwriting year (UY) 2004-2017 per 31 Januari 2018. UY 2017 masih belum matang dan masih akan bertambah sampai dengan akhir tahun 2018 nanti. Dari pengalaman tahun-tahun sebelumnya, kami mengestimasi produksi premi untuk UY 2017 ini dapat mencapai Rp4,8 triliun hingga akhir tahun 2018. Diharapkan tahun 2018 nanti akan menjadi titik balik atas penurunan yang terjadi selama dua tahun terakhir.
Penurunan paling signifikan dapat dilihat pada premi UY 2016 dibandingkan dengan UY 2015. Penurunan premi paling besar teridentifikasi di Provinsi DIY-Kota Yogyakarta (Zona 4) dari Rp681,44 milyar menjadi Rp36,85 milyar (lihat Tabel 3.1) yang sebagian besar terjadi di Okupasi Komersial.
This graph shows premium growth from UY 2004-2017 as at 31 January 2018. UY 2017 is not yet mature and will still increase until the end of 2018. Referring to previous years experience, we estimate that the premium production for UY 2017 may reach Rp4, 8 trillion until the end of 2018. We hope 2018 will be a turning point of the decline occurring in the last two years.
The most significant decline in premium obtained by comparing UY 2016 to UY 2015. The highest premium decline is identified in Yogyakarta Province (Zone 4), which goes down from Rp681.44 billion to Rp36.85 billion (see Table 3.1) and mostly occurr in Commercial Occupation.
Premi 2004-2017
Premium 2004-2017
871 1,334 1,645 2,076 1,982 1,782 2,115 2,823 2,719 4,529 4,954 5,311 4,607 3,792 1,000 2,000 3,000 4,000 5,000 6,000 2004 2005 2006 2007 2008 2009 2010 2011 2012 2013 2014 2015 2016 2017In Billio
n
s IDR
4,774 Estimasi | Estimation Realisasi | RealisationCatatan Asuransi Gempa Bumi 2004 - 2017
Seperti pertumbuhan premi, hal yang sama dapat dilihat pada pertumbuhan eksposur yang ditampilkan untuk UY 2004-2017 pada grafik di atas. Untuk UY 2017, kami juga mengestimasi eksposur dapat mencapai Rp3,8 kuadriliun sampai dengan akhir tahun 2018 dengan sebaran eksposur yang tetap terpusat lebih dari 50% di Jawa bagian barat.
Pemusatan dan peningkatan eksposur di Jawa bagian barat dapat dilihat pada data eksposur UY 2016. Terjadi kenaikan eksposur signifikan di Provinsi Jawa Barat sebesar Rp563 triliun yang didominasi Kabupaten Bekasi. Di daerah lain terjadi penurunan, contohnya di Provinsi DIY sebesar Rp374 triliun yang didominasi Kota Yogyakarta.
Following the premium growth, the same condition can be seen in exposure growth shown above from 2004-2017 UY. For 2017 UY, we also estimate that the exposures may reach Rp3.8 quadrillion until the end of 2018 constantly concentrated 50% in western of Java.
Concentration and increment in western of Java can be seen in 2016 UY exposure data. Exposure increase significantly in West Java Province i.e. Rp563 trillion which is dominated by Bekasi Regency. There are declines in some other areas, for example in Yogyakarta Province i.e. Rp374 trillion which is dominated by Yogyakarta City.
Eksposur 2004-2017
Exposure 2004-2017
692 1,026 1,458 1,606 1,481 1,498 1,671 2,156 1,973 2,758 3,112 3,661 3,739 2,917 500 1,000 1,500 2,000 2,500 3,000 3,500 4,000 2004 2005 2006 2007 2008 2009 2010 2011 2012 2013 2014 2015 2016 2017In
T
rillion
s
IDR
3,782 Realisasi | Realisation Estimasi | EstimationCatatan Asuransi Gempa Bumi 2004 - 2017
Earthquake Insurance 2004 – 2017
Analisis Perkembangan Data 2016 -2017
Data Development Analysis of 2016-2017
Data risiko gempa bumi dalam suatu Underwriting Year (UY) yang telah disesikan kepada Maipark akan mengalami perkembangan dari waktu ke waktu seiring adanya mutasi data yang dikirimkan oleh ceding seperti perubahan, pembatalan dan penyesuain data. Jika diamati dalam rentang waktu tertentu, secara agregat suatu saat data tersebut akan mengalami kematangan, yaitu suatu kondisi dimana data tidak berubah atau mengalami perubahan yang sangat kecil.
Pada Tabel 1 sampai Tabel 3 disajikan pergerakan data premi, eksposur dan jumlah risiko untuk beberapa UY per tanggal tutup buku (31 Januari) untuk mengetahui gambaran atas kematangan data. Sebagai contoh:
1. Premi UY 2011 sampai dengan 31 Januari 2012 adalah sebesar Rp2.070.445,34 juta (kotak hijau). 2. Premi UY 2011 sampai dengan 31 Januari 2018 adalah sebesar Rp 2.823.169,51 juta (kotak merah). 3. Premi UY 2014 sampai dengan 31 Januari 2017 adalah sebesar Rp4.958.383,13 juta (kota warna hitam). Cara baca ini juga berlaku untuk Tabel 2 dan Tabel 3 berikut:
The earthquake risk data of UY that has been ceded to Maipark will develop from time to time as there are data mutations such as endorsement, cancellations, adjustments from ceding. If observed within a period of time, data in aggregate will tends to maturity i.e. a condition where the data does not change or very small change.
Table 1 to 3 shows the development of premium, exposure and number of risk data for several UY as at closing book ( 31 January) to find out the description of data maturity. As example:
1. Premium UY 2011 as at January 31, 2012 i.e. Rp2,070,445.34 million (green box) 2. Premium UY 2011 as at January 31, 2018 i.e. Rp2,823,169,51 million (red box). 3. Premiums UY 2014 as at January 31, 2017 i.e. Rp4.958.383,13 million (black box) This “how to read” also applies to the following Table 2 and 3.
Catatan Asuransi Gempa Bumi 2016 - 2017
Earthquake Insurance 2016 – 2017
Tabel 1 | Table 1
Segitiga Premi per UY | Premium Triangle by UY
Dalam jutaan Rp. | Million DR
TAHUN PENGEMBANGAN | DEVELOPMENT YEAR
UY 0 1 2 3 4 5 6 2011 2,070,445.34 2,699,574.80 2,813,422.50 2,813,961.47 2,823,404.23 2,823,320.44 2,823,169.51 2012 2,034,099.90 2,638,969.99 2,643,245.93 2,721,173.02 2,719,859.51 2,719,136.34 2013 3,349,840.45 4,251,233.19 4,530,273.70 4,529,021.24 4,528,803.89 2014 3,089,921.60 5,006,925.76 4,958,383.13 4,953,708.54 2015 4,444,115.68 5,334,948.61 5,310,870.51 2016 3,659,205.85 4,607,154.33 2017 3,792,034.06 Tabel 2 | Table 2
Segitiga Eksposur per UY | Exposure Triangle by UY
Dalam millian Rp. | Billion IDR
Reasuransi MAIPARK | 8
Catatan Asuransi Gempa Bumi 2016 - 2017
Earthquake Insurance 2016 – 2017
Tabel 3 | Table 3
Segitiga Jumlah Risiko per UY | Number of Risks Triangle by UY
Jika perbedaaan premi antar tahun pengembangan dalam tabel-tabel di atas disajikan dalam rasio maka diperoleh tabel berikut:
If the premium difference between development year in the table above is presented in ratio then it’s obtained the following table :
Tabel 4 | Table 4
Segitiga Rasio Perbedaan Premi | Ratio of Premium Deviation Triangle
Analisis Perkembangan Data 2016 -2017
Data Development Analysis of 2016-2017
TAHUN PENGEMBANGAN | DEVELOPMENT YEAR
UY 0 1 2 3 4 5 6 2011 115,148 161,354 165,901 165,923 165,943 165,964 166,007 2012 126,283 171,926 173,047 173,777 173,844 173,845 2013 152,088 187,803 189,173 190,297 190,329 2014 164,001 234,326 235,857 235,899 2015 170,878 234,024 235,276 2016 182,474 225,460 2017 174,515 RASIO | RATIO * UY 1:0 2:1 3:2 4:3 5:4 6:5 2011 30.39% 4.22% ε 0.34% ε ε 2012 29.74% 0.16% 2.95% ε ε 2013 26.91% 6.56% ε ε 2014 62.04% -0.97% ε 2015 20.05% -0.45% 2016 25.91% 1:0 =𝑃𝑟𝑒𝑚𝑖 𝑡𝑎ℎ𝑢𝑛 1 −𝑃𝑟𝑒𝑚𝑖 𝑡𝑎ℎ𝑢𝑛 0 𝑃𝑟𝑒𝑚𝑖 𝑡𝑎ℎ𝑢𝑛 0 = 4,607,154.33−3,659,205.85 3,659,205.85 = 25.91%
*) Rasio = Persentase perbedaan premi antar Tahun Pengembangan| Percentage of premium deviation between Development Year
ε: nilai yang lebih kecil dari -0,1% atau 0,1% | value smaller than -0.1% or 0,1% Tabel 5 | Table 5
Segitiga Rasio Perbedaan Eksposur | Ratio of Exposure Deviation Triangle
RASIO | RATIO UY 1:0 2:1 3:2 4:3 5:4 6:5 2011 29.72% 4.05% ε 0.31% ε ε 2012 29.73% ε 2.28% ε ε 2013 26.82% 5.96% ε ε 2014 57.19% -0.53% -0.10% 2015 22.55% -0.42% 2016 29.65%
Catatan Asuransi Gempa Bumi 2016 - 2017
Earthquake Insurance 2016 – 2017
Berdasarkan Tabel 4 dan 5 dapat diperoleh informasi bahwa untuk premi dan eksposure UY 2011 mengalami erubahan kecil (ε) pada tahun pengembangan kelima dan keenam. Oleh karena, itu data premi dan eksposur UY 2011 dikatakan matang di tahun pengembangan keempat.
Dari uraian di atas kematangan data premi dan eksposur UY dapat dilihat semakin cepat dan hal ini dapat diakibatkan karena keakuratan data semakin baik sehingga mempercepat proses validasi data.
Based on Table 4 and 5 the premium and exposures in UY 2011 experienced small changes in the fifth and sixth development year. Therefore, premium and exposure UY 2011 is said to be mature in fourth development year.
From the above description can be seen that the maturity of premium and exposure in UY more quickly and this can be caused due to the more accuracy such that speed up the process of data validation.
Analisis Perkembangan Data 2016 -2017
Data Development Analysis of 2016-2017
Tabel 6 | Table 6
Segitiga Rasio Perbedaan Jumlah Risko | Ratio of Number of Risk Deviation Triangle
RASIO | RATIO UY 1:0 2:1 3:2 4:3 5:4 6:5 2011 40.13% 2.82% ε ε ε ε 2012 36.14% 0.65% 0.42% ε ε 2013 23.48% 0.73% 0.59% ε 2014 42.88% 0.65% ε 2015 36.95% 0.53% 2016 23.56%
Gambaran untuk kematangan Jumlah Risiko berbeda dengan uraian premi dan eksposur. Dalam Tabel 6 dapat dilihat bahwa pola kematangannya tidak mengikuti pola premi dan eksposur.
Sehubungan dengan kebutuhan analisis perkembangan premi di UY 2017 saat kematangan terjadi, maka perlu dilakukan beberapa asumsi dalam proses tersebut. Langkah dan asumsi yang digunakan adalah:
1. Premi UY 2016 diasumsikan telah matang di 2018 (per 31 Januari 2018).
2. Estimasi/prediksi nilai premi UY 2017 saat matang di 2019 (per 31 Januari 2019):
a. Asumsi pertambahan premi UY 2017 mengikuti pertumbuhan premi asuransi umum 2017 sebesar 2,72% dan diterapkan pada UY 2016 per 31 Januari 2018 atau,
b. Asumsi pertambahan premi UY 2017 mengikuti pola kematangan sebesar 24,3% yang diterapkan pada UY 2017 posisi 31 Januari 2018.
3. Penyebaran nilai estimasi/prediksi premi UY 2017 dari point 2 sesuai provinsi. Hasil estimasi ini dapat dilihat dalam Tabel 7.
Reasuransi MAIPARK | 10
Catatan Asuransi Gempa Bumi 2016 - 2017
Earthquake Insurance 2016 – 2017
The maturity description for number of risks differs from the of premium and the exposure. In Table 6 it can be seen that the maturity pattern does not follow the premium and exposure.
Inline with the needs of analysis of premium development UY 2017 when the maturity occurs, it is necessary to make some assumptions in the process. The steps and assumptions are:
1. UY 2016 premium is assumed to have matured in 2018 (as at 31 January 2018). 2. Premium estimation / prediction of UY 2017 matured in 2019 (as at 31 January 2019):
a. The assumption of the premium increase for UY 2017 follows the growth of general insurance premium of 2017 i.e. 2.72% and applied to UY 2016 as at January 31, 2018 or,
b. The assumption of the premium growth follows the maturity pattern i.e. 24.3% against the 2017 UY 2017 closing position.
c. Deployment of estimated value / prediction of UY 2017 premium from point 2 according to province. The results of this estimate can be seen in Table 7.
Analisis Perkembangan Data 2016 -2017
Tabel 7 | Table 7
Estimasi Premi UY 2017| Premium Estimation of UY 2017
Catatan Asuransi Gempa Bumi 2016 - 2017
Earthquake Insurance 2016 – 2017
*) Tutup buku 2017|Closing book 2017
**) Estimasi kenaikan 2,72% terhadap Premi UY 2016) |Growth Estimation 2,72 to premium of UY 2016)
***) Estimasi kenaikan 24,3% terhadap premi UY 2017 (tutup buku 2017) |Growth Estimation 24,3% to premium UY (closing 2017)
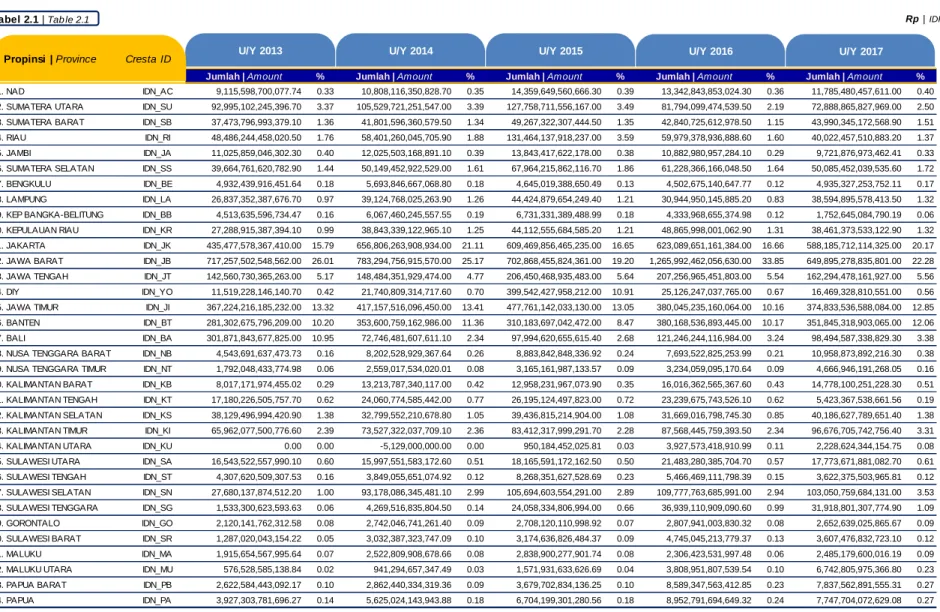
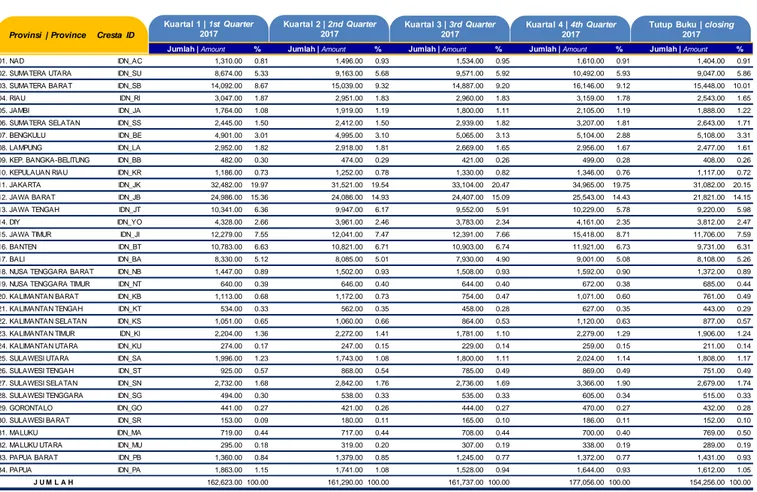
01. NAD IDN_AC 24,647,247,812.13 22,543,896,731.01 25,317,652,952.62 28,022,063,636.65 02. SUMATERA UTARA IDN_SU 122,236,569,573.89 110,123,667,224.49 125,561,404,266.30 136,883,718,360.04 03. SUMATERA BARAT IDN_SB 80,587,487,762.43 82,413,576,808.81 82,779,467,429.57 102,440,075,973.35 04. RIAU IDN_RI 70,619,897,658.52 48,630,059,026.20 72,540,758,874.83 60,447,163,369.57 05. JAMBI IDN_JA 12,897,416,894.48 11,452,900,902.95 13,248,226,634.01 14,235,955,822.37 06. SUMATERA SELATAN IDN_SS 85,313,314,075.67 66,822,866,199.17 87,633,836,218.53 83,060,822,685.57 07. BENGKULU IDN_BE 8,152,666,323.61 8,849,619,620.26 8,374,418,847.61 11,000,077,187.98 08. LAMPUNG IDN_LA 44,097,311,799.84 55,610,208,685.48 45,296,758,680.80 69,123,489,396.05 09. KEP BANGKA-BELITUNG IDN_BB 3,670,289,425.72 1,511,660,742.86 3,770,121,298.10 1,878,994,303.37 10. KEPULAUAN RIAU IDN_KR 37,153,966,854.34 30,057,561,721.03 38,164,554,752.78 37,361,549,219.24 11. JAKARTA IDN_JK 912,929,602,973.11 864,944,213,652.66 937,761,288,173.98 1,075,125,657,570.26 12. JAWA BARAT IDN_JB 1,422,859,359,917.10 805,423,194,442.76 1,461,561,134,506.84 1,001,141,030,692.35 13. JAWA TENGAH IDN_JT 260,354,582,174.50 206,115,411,851.72 267,436,226,809.65 256,201,456,931.69 14. DIY IDN_YO 36,846,829,932.03 24,686,517,616.09 37,849,063,706.18 30,685,341,396.80 15. JAWA TIMUR IDN_JI 381,440,850,170.87 404,278,248,735.04 391,816,041,295.52 502,517,863,177.66 16. BANTEN IDN_BT 540,069,607,136.58 515,512,146,300.30 554,759,500,450.70 640,781,597,851.27 17. BALI IDN_BA 161,700,251,260.39 138,222,512,901.33 166,098,498,094.67 171,810,583,536.35 18. NUSA TENGGARA BARAT IDN_NB 10,281,218,577.70 14,011,498,509.09 10,560,867,723.01 17,416,292,646.80 19. NUSA TENGGARA TIMUR IDN_NT 4,692,121,608.28 6,865,927,958.26 4,819,747,316.03 8,534,348,452.12 20. KALIMANTAN BARAT IDN_KB 11,973,089,466.41 11,380,969,591.91 12,298,757,499.90 14,146,545,202.74 21. KALIMANTAN TENGAH IDN_KT 17,375,073,284.05 4,129,043,655.67 17,847,675,277.38 5,132,401,264.00 22. KALIMANTAN SELATAN IDN_KS 24,743,353,327.09 31,210,605,718.41 25,416,372,537.59 38,794,782,907.98 23. KALIMANTAN TIMUR IDN_KI 65,685,636,481.87 75,259,234,143.23 67,472,285,794.18 93,547,228,040.03 24. KALIMANTAN UTARA IDN_KU 2,956,159,111.09 1,714,315,783.98 3,036,566,638.91 2,130,894,519.49 25. SULAWESI UTARA IDN_SA 35,517,276,235.08 30,496,095,409.06 36,483,346,148.67 37,906,646,593.46 26. SULAWESI TENGAH IDN_ST 9,555,954,110.04 6,397,082,427.20 9,815,876,061.83 7,951,573,457.01 27. SULAWESI SELATAN IDN_SN 138,988,444,327.12 138,033,922,525.95 142,768,930,012.82 171,576,165,699.76 28. SULAWESI TENGGARA IDN_SG 29,814,093,788.60 26,868,934,895.92 30,625,037,139.65 33,398,086,075.63 29. GORONTALO IDN_GO 5,319,598,641.34 5,034,217,166.29 5,464,291,724.38 6,257,531,937.70 30. SULAWESI BARAT IDN_SR 6,798,640,116.50 5,167,978,371.20 6,983,563,127.67 6,423,797,115.40 31. MALUKU IDN_MA 4,337,521,477.10 4,588,231,028.49 4,455,502,061.28 5,703,171,168.41 32. MALUKU UTARA IDN_MU 6,806,415,043.58 10,421,228,271.88 6,991,549,532.77 12,953,586,741.95 33. PAPUA BARAT IDN_PB 12,588,465,078.58 11,843,232,232.87 12,930,871,328.72 14,721,137,665.46 34. PAPUA IDN_PA 14,144,015,904.64 11,413,281,119.85 14,528,733,137.25 14,186,708,431.97 TOTAL 4,607,154,328,324.28 3,792,034,061,971.42 4,732,468,926,054.70 4,713,498,339,030.48 Provinsi | Province Cresta ID Premi UY 2016 * Premi UY 2017 Premi UY 2017
(Estimasi)**
Premi UY 2017 (Estimasi)***
Rasio CAE dari 10 kejadian pada tabel di atas memiliki rentang sangat lebar, yaitu 0,09% hingga 86,89%. Lebarnya rentang ini merupakan gambaran dari sifat risiko bencana yang cenderung memiliki frekuensi rendah untuk kejadian yang tergolong
catastrophic, sehingga kejadian dengan kerugian yang tinggi tidak banyak tercatat dalam rentang waktu pengamatan yang
relatif singkat dibanding skala waktu kegempaan yang periode ulangnya dapat mencapai ratusan tahun.
Salah satu dari kejadian di atas yang dapat digolongkan bersifat catastrophic adalah kejadian gempa Padang, 30 September 2009. Gempa dengan intensitas maksimum IX MMI ini memang memiliki intensitas cukup tinggi di daerah pemukiman, yaitu VII hingga VIII MMI di wilayah Padang Pariaman. Pada intensitas VIII MMI, kerusakan ringan dapat terjadi pada bangunan dengan konstruksi yang kuat. Kerusakan berat dapat terjadi pada bangunan dengan konstruksi kurang baik.
CAE ratio of ten events in the above table has a very wide range, i.e. 0.09% to 86.89%. The width of this range is representation of catastrophe risk characteristic that tends to have low frequency for catastrophic level, therefore not many events with high level of damage (catastrophic level) have been recorded in a relatively short time of observation compare with time scale of seismicity which have return period until hundreds of years.
One of the above events that classified as catastrophic level is Padang earthquake event in 30thSeptember, 2009. The event
have significantly high intensity with maximum IX MMI in residential areas, i.e. VII-VIII MMI in Padang Pariaman region. Intensity VIII MMI can cause minor damage in building with strong construction. Severe damage can happen in building with not good quality of construction.
No. Kejadian Tanggal
Kejadian Kekuatan Gempa Kedalaman (KM) MMI Maksimum Eksposure Terdampak
Klaim Rasio CAE Jumlah Risiko Number Event Date of Loss Magnitude Depth (KM) Maximum MMI Affected Exposure Claim CAE Ratio NoR
1 ACEH 26/12/04 9.1 Mw 30.00 IX 958,757.93 833,093.96 86.89% 25 2 YOGYA 27/05/06 6.3 Mw 12.50 IX 22,607,377.57 295,480.84 1.31% 299 3 PADANG 06/03/07 6.3 Mwc 11.00 VIII 5,975,640.89 28,979.07 0.48% 98 4 BENGKULU 12/09/07 8.4 Mw 34.00 VIII 870,834.57 61,366.69 7.05% 384 5 PADANG 16/08/09 6.7 Mwc 20.00 VI 3,105,777.10 42,782.94 1.38% 7 6 TASIKMALAYA 02/09/09 7.0 Mw 46.00 VII 37,059,693.77 33,662.98 0.09% 291 7 PADANG 30/09/09 7.6 Mw 81.00 IX 1,434,892.35 1,142,460.10 79.62% 2,135 8 BIMA 09/11/09 6.6 Mwc 18.00 VI 10,261,909.77 47,771.65 0.47% 6 9 MERAPI 25/10/10 6,912,282.28 30,534.72 0.44% 4 10 KELUD 13/02/14 51,122,470.86 271,330.55 0.53% 48 volcanic eruption volcanic eruption
10 Besar Claim Events 2004-2017
Top 10 Claim Events 2004-2017
Reasuransi MAIPARK | 12
dalam jutaan Rp | In million IDR
Catatan Asuransi Gempa Bumi 2014 - 2017
Earthquake Insurance 2004 – 2017
Catatan (Note):
Premi Asuransi Gempa Bumi 2017
EQ Insurance Premium 2016Eksposur Asuransi Gempa Bumi 2017
EQ Insurance Exposure 2016Jumlah Risiko Asuransi Gempa Bumi 2017
EQ Insurance NOR Risk 2016Claim Event Asuransi Gempa Bumi 2017
EQ Insurance Claim Events 2016Asuransi Gempa Bumi 2013 - 2017
Tabel di atas menampilkan data premi per 31 Januari 2018 menurut okupasi di lima UY terakhir. Dapat dilihat bahwa penurunan premi UY 2017 terhadap UY 2013 secara signifikan terjadi pada okupasi agrikultur (52%) dan okupasi komersial (40,6%). Namun demikian, perubahan premi sepanjang UY 2013 hingga UY 2017 pada okupasi komersial cenderung lebih fluktuatif dibanding okupasi agrikultural. Di sisi lain, okupasi industrial adalah satu-satunya okupasi yang secara konsisten mengalami penurunan sejak UY 2015. Walaupun secara keseluruhan perubahan premi tidak berpola, peringkat premi per okupasi masih konsisten di setiap UY, yaitu 1-Industrial, 2-Komersial, 3-Residential dan 4-Agrikultural.
The table above shows premium data as at 31thJanuary, 2018 based on occupation in the last five UY. It can be seen that
premium decrease significantly at UY 2017 to UY 2013 in agricultural occupation (52%) and commercial occupation (40.6%). However, change of premium throughout UY 2013 until UY 2017 on commercial occupation tends to be more volatile than agricultural occupation. In other side, industrial occupation is the only occupation that has consistently decrement since UY 2015. In despite of that, there is no pattern in change of premium overall, premium ranking per occupation still consistent in every UY, i.e. 1-Industrial, 2-Commercial, 3- Residential and 4-Agriculture.
Premium per Okupasi UY 2013-2017
Premium by Occupation UY 2013-2017
UY Agrikultural ∆ Komersial ∆ Industrial ∆ Residensial ∆ Total ∆
2013 35.25 19.8% 1,811.75 175.3% 2,207.21 31.0% 474.59 36.7% 4,528.80 66.6% 2014 28.99 -17.8% 1,114.37 -38.5% 3,195.75 44.8% 614.60 29.5% 4,953.71 9.4% 2015 29.40 1.4% 1,789.84 60.6% 2,917.80 -8.7% 573.82 -6.6% 5,310.87 7.2% 2016 32.69 11.2% 1,111.12 -37.9% 2,877.21 -1.4% 586.13 2.1% 4,607.15 -13.3% 2017 16.77 -48.7% 1,075.69 -3.2% 2,254.02 -21.7% 445.56 -24.0% 3,792.03 -17.7% 2013 to 2017 -52.4% -40.6% 2.1% -6.1% -16.3% Reasuransi MAIPARK | 14
Premi Asuransi Gempa Bumi
Earthquake Insurance Premium 2017
Premium per Interest UY 2013-2017
Premium by Interest UY 2013-2017
UY Building ∆ Machinery ∆ Others ∆ Stock ∆ Bussiness
Interruption ∆ Total ∆ 2013 1,633.18 47.2% 694.82 28.6% 790.82 74.7% 507.94 35.2% 902.02 274.3% 4,528.80 66.6% 2014 2,034.88 24.6% 940.21 35.3% 617.69 -21.9% 883.01 73.8% 477.92 -47.0% 4,953.71 9.4% 2015 2,748.38 35.1% 927.13 -1.4% 628.99 1.8% 588.29 -33.4% 418.15 -12.5% 5,310.87 7.2% 2016 1,685.57 -38.7% 794.67 -14.3% 709.66 12.8% 483.09 -17.9% 934.22 123.4% 4,607.15 -13.3% 2017 1,418.33 -15.9% 719.03 -9.5% 857.39 20.8% 448.64 -7.1% 348.65 -62.7% 3,792.03 -17.7% 2013 to 2017 -13.2% 3.5% 8.4% -11.7% -61.4% -16.3%
Tabel di atas memuat data produksi premi per 31 Januari 2018 per interest di lima UY terakhir. Perubahan signifikan pada produksi premi UY 2017 terhadap UY 2013 hanya terjadi pada Business Interruption (BI) interest, yaitu mengalami penurunan sebesar 61,4 %. Walaupun demikian, BI interest juga satu-satunya yang pernah mengalami kenaikan di atas 100% dan mencapai 274,3% di UY 2013. Detil kontribusi produksi premi per wilayah untuk BI interest pada UY 2017 dapat dilihat pada Grafik 1. Lebih lanjut dapat pula dilihat bahwa interest pada building, stock dan machinery cenderung turun di tiga UY terakhir, sedangkan other interest masih mengalami kenaikan walaupun tidak terlalu signifikan.
26,44% 17,72% 22,58% 10,41% Provinsi lain 22,84% Kab. Bekasi 10,28% Kab. Bogor 2,86% Kab. Karawang: 5,81% Kota/Kab. lain di Jawa Barat 7,49%
Premi Asuransi Gempa Bumi
Earthquake Insurance Premium 2017
dalam miliar Rp | In billion IDR
Grafik 1. Proporsi Premi Gangguan Usaha UY 2017
Keterangan dan Kode Okupasi
Description & Occupation Code
Jumlah Risiko Number of Risk Premi Premium Exposure Exposure
Trading and Storage 293 62,864 522,525,673,951.60 389,864,553,617,229.00
Private Building 297 72,352 442,321,685,077.55 309,783,625,381,403.00
Conventional Power Stations, . . . 281 177 239,980,637,932.10 182,844,543,298,812.00
Hotels, Entertainment, Sports, Services 294 8,740 234,845,991,277.53 166,245,895,414,568.00
Cement, Chalk, Lime and Gypsum Industry 211 266 183,832,143,546.77 135,647,277,583,220.00
Mass Communication 292 9,104 164,771,475,434.04 115,752,337,709,501.00
Iron Mines, Blast Furnaces, Iron Foundries,
Iron works 202 13 142,810,005,888.85 96,974,573,371,919.50
Retining Installations (Gold, Silver, Platinum,
etc) 200 10 132,345,644,116.34 87,958,514,718,500.00
Mechanical Engineering and Apparatus
Construction 221 1,144 125,512,023,419.13 114,179,704,387,301.00
Chemical Products, pharmaceutical products 230 610 120,715,365,422.22 94,605,154,086,349.00
Premi: Distribusi Okupasi UY 2017
Premium: Occupation Distribution UY 2017
Reasuransi MAIPARK | 16
Premi Asuransi Gempa Bumi
Earthquake Insurance Premium 2017
dalam Rp | In IDR
Menggantikan posisi okupasi private building di UY 2016, produksi premi tertinggi pada UY 2017 ditempati oleh okupasi trading dan storage. Pergantian posisi ini tidak diimbangi dengan perubahan peringkat jumlah risiko. Peringkat 1 hingga 6 pada UY 2017 masih ditempati oleh okupasi-okupasi yang telah menempati posisi 10 besar pada UY 2016. Okupasi cement, chalk, lime and gypsum industry mengalami kenaikan peringkat paling signifikan, yaitu dari 9 menjadi 5 dengan kenaikan produksi premi kurang lebih sebesar 61 M.
Replacing occupation position of private building in UY 2016, the highest premium production in UY 2017 is trading and storage occupation. This change is not equal to the change of number of risk ranking. First until sixth rank in UY 2017 still taken by occupations that have achieved top ten in UY 2016. Cement, chalk, lime and gypsum industry occupation has increase significantly, i.e. from 9 to 5 with incremental of premium production is about 61 Billion.
Eksposur per Okupasi UY 2013-2017
Exposure by Occupation UY 2013-2017
UY Agriculture (A) ∆ Commercial (C) ∆ Industrial (I) ∆ Residensial (R) ∆ Total ∆
2013 25.96 10.3% 996.96 117.5% 1,417.21 12.5% 317.54 37.5% 2,757.67 39.8% 2014 22.52 -13.3% 742.37 -25.5% 1,961.97 38.4% 384.80 21.2% 3,111.65 12.8% 2015 24.10 7.0% 1,157.52 55.9% 2,094.57 6.8% 384.44 -0.1% 3,660.63 17.6% 2016 26.02 8.0% 811.28 -29.9% 2,492.37 19.0% 409.82 6.8% 3,739.49 2.2% 2017 12.21 -53.1% 777.66 -4.1% 1,814.60 -27.2% 312.14 -23.9% 2,916.62 -22.0% 2013 to 2017 -52.9% -22.0% 28.0% -1.7% 5.8% I 62,22% C 26,66% R 10,7% 293 | 13,37% 294 | 5,7% 292 | 3,97% Lain | 5,7%
Premi Asuransi Gempa Bumi
Earthquake Insurance Premium 2017
dalam triliun Rp | In trillion IDR
Tabel di atas memuat data eksposur per 31 Januari 2018 per okupasi di lima UY terakhir. Berbeda dengan okupasi agrikultur, okupasi komersial memiliki penurunan eksposur UY 2017 terhadap UY 2013 yang tidak berimbang dengan penurunan produksi premi. Detil persentase eksposur komersial (C) per kode okupasi untuk UY 2017 dapat dilihat pada Grafik 2. Hal cukup menarik terjadi juga pada perubahan eksposur okupasi industrial di UY 2015 dan UY 2016, dimana perubahan eksposur bertolak belakang dengan perubahan produksi premi yang bernilai negative, Tabel Premium per
Okupasi UY 2013-2017, halaman 14.
Keterangan | Information:
292: Mass communication
293: Trading and storage
294: Hotels, Entertainment, Sport, Services
Grafik 2. Proporsi Eksposur per Okupasi UY 2017 Graph 2. Exposure Proportion by Occupation UY 2017
Tabel di atas memuat data eksposur per 31 Januari 2018 per interest di lima UY terakhir. Mengikuti peringkat penurunan produksi premi per interest di UY 2017, eksposur BI memiliki penurunan terbesar, yaitu 68,9%. Eksposur BI memiliki fluktuasi kenaikan dan penurunan sangat tinggi di dua UY terakhir, setelah mengalami kestabilan di UY 2015. Nilai eksposur BI di UY 2017 yang memiliki nilai terkecil selaras dengan kontribusinya pada zona 4, yaitu zona dengan proporsi eksposur terbesar. Di sisi lain, eksposur stock dan others memiliki pola yang konsisten di tiga UY terakhir.
The table above contains exposure as at 31thJanuary, 2018 per interest in the last five UY. Following ranking of premium
production decrement per interest in UY 2017, BI exposure have greatest decrement, i.e. 68.9%. After stable in UY 2015, BI exposure have fluctuation increasing and decreasing very high in the last two UY. BI exposure have the smallest value in UY 2017 aligned to its contribution in zone 4, i.e. zone with the largest proportion of exposure. In other side, stock and others exposure have consistent pattern in the last three years.
Eksposur per Interest UY 2013-2017
Exposure by Interest UY 2013-2017
UY Building (B) ∆ Machinery(M) ∆ Others (O) ∆ Stock (S) ∆
Bussiness Interruption (BI) ∆ Total ∆ 2013 1,049.03 30.5% 452.11 14.2% 474.64 53.3% 336.15 20.0% 445.74 142.8% 2,757.67 39.8% 2014 1,289.02 22.9% 595.85 31.8% 400.35 -15.7% 534.02 58.9% 292.41 -34.4% 3,111.65 12.8% 2015 1,817.73 41.0% 662.87 11.2% 447.59 11.8% 439.49 -17.7% 292.95 0.2% 3,660.63 17.6% 2016 1,268.23 -30.2% 647.23 -2.4% 557.53 24.6% 396.64 -9.7% 869.85 196.9% 3,739.49 2.2% 2017 1,057.78 -16.6% 591.17 -8.7% 649.36 16.5% 347.43 -12.4% 270.88 -68.9% 2,916.62 -22.0% 2013 to 2017 0.83% 30.76% 36.81% 3.35% -39.23% 5.76% Reasuransi MAIPARK |18 Zona 4 56,64% Zona 3 29,76% BI: 4,88% O: 14,28% S: 6,42% M: 8,79% B: 22,09%
Eksposur Asuransi Gempa Bumi 2017
Earthquake Insurance Exposure 2017
dalam triliun Rp | In trillion IDR
Grafik 3. Proporsi Eksposur per Zona Tarif UY 2017 Graph 3. Exposure Proportion by rate Zone UY 2017
Zona 2: 4,56% Zona 1: 3,92% Zona 5: 5,3% Keterangan | information: B= Building M= Machinery S = Stock O = Others
Eksposur: Distribusi Okupasi UY 2017
Exposure: Occupation Distribution UY 2017
Keterangan dan Kode Okupasi
Description & Occupation Code
Jumlah Risiko Number of Risk Premi Premium Eksposure Exposure
Trading and Storage 293 62,864.00 522,525,673,951.60 389,864,553,617,229.00
Private Building 297 72,352.00 442,321,685,077.55 309,783,625,381,403.00
Conventional Power Stations, Buildings
with Boiler 281 177.00 239,980,637,932.10 182,844,543,298,812.00
Hotels, Entertainment, Sports, Services 294 8,740.00 234,845,991,277.53 166,245,895,414,568.00
Cement, Chalk, Lime and Gypsum Works 211 266.00 183,832,143,546.77 135,647,277,583,220.00
Mass Communication 292 9,104.00 164,771,475,434.04 115,752,337,709,501.00
Mechanical Engineering and Apparatus
Construction 221 1,144.00 125,512,023,419.13 114,179,704,387,301.00
Petrochemical Works 232 169.00 118,656,475,115.18 103,722,810,529,566.00
Iron Mines, Blast Furnaces, Iron
Foundries, Ironwo 202 13.00 142,810,005,888.85 96,974,573,371,919.50
Chemical Products, pharmaceutical
products 230 610.00 120,715,365,422.22 94,605,154,086,349.00
Eksposur Asuransi Gempa Bumi 2017
Earthquake Insurance Exposure 2017
Dalam Rp | In IDR
Konsisten dengan peringkat produksi premi per okupasi pada halaman 16, enam peringkat pertama okupasi yang memiliki kontribusi eksposur tertinggi ditempati oleh okupasi yang sama. Selain itu, okupasi petrochemical works yang tidak terdapat pada daftar 10 besar okupasi dengan produksi premi tertinggi di UY 2017 menempati posisi 7 dan menyebabkan okupasi
Jumlah Risiko per Okupasi UY ‘13-’17
Number Of Risk by Occupation UY ‘13-’17
UY Agriculture ∆ Commercial ∆ Industrial ∆ Residensial ∆ Total ∆
2013 535 27.38% 100,991 6.76% 18,464 7.36% 70,337 14.13% 190,327 9.48% 2014 754 40.93% 124,571 23.35% 18,928 2.51% 91,635 30.28% 235,888 23.94% 2015 398 -47.21% 130,457 4.73% 17,840 -5.75% 86,581 -5.52% 235,276 -0.26% 2016 593 48.99% 114,023 -12.60% 21,194 18.80% 88,592 2.32% 224,402 -4.62% 2017 506 -14.67% 87,346 -23.40% 14,002 -33.93% 72,661 -17.98% 174,515 -22.23% 2013 to 2017 -5.42% -13.51% -24.17% 3.30% -8.31% Reasuransi MAIPARK | 20
Jumlah Risiko Asuransi Gempa Bumi 2017
Earthquake Insurance Number of Risk 2017
Tabel di atas memuat data jumlah risiko per okupasi di lima UY terakhir. Pada UY 2017, penurunan paling besar terjadi pada okupasi industrial dan komersial. Penurunan pada okupasi komersial telah menyebabkan jumlah risiko okupasi komersial yang sebelumnya selalu bernilai ratusan ribu bergerak turun menjadi 87,346 risiko mendekati jumlah risiko okupasi residensial. Namun demikian, peringkat jumlah risiko berdasarkan okupasi di setiap tahun UY selalu konsisten dan jumlah risiko untuk okupasi agrikultur selalu jauh lebih rendah dibanding okupasi lainnya.
The above table contains lists number of risk by occupation for the last five UY. The biggest decrease occurred in industrial and commercial occupation in UY 2017. The decrease in commercial occupation has caused to the number of risk which previously hundreds of thousands in amount moving down to 87,346 risks close to the number of risk residential occupation. However, the rank of number of risk by occupational in each year of UY is always consistent and the number of risks for agricultural occupation is always much lower than other occupations
Event Date of Loss Magnitude Depth (km)
Max Intensity
(MMI) Affected Exposure Claim CAE Ratio NoR
Pesisir Selatan 9-Jan-17 5.4 44 IV 22,616,784.43 129.30 ɛ 3
Sibolangit 16-Jan-17 5.6 6 VI 45,208,779.08 4,642.25 ɛ 14
Klungkung 12-Feb-17 4.6 60.5 V 95,736,276.83 50.00 ɛ 1
Tabanan 22-Mar-17 5.6 111.7 IV 16,097,898.62 16,049.54 0.1% 7
Tasikmalaya 24-Apr-17 5.2 72.2 V 49,347,982.48 134.47 ɛ 1
Poso 29-May-17 6.6 12 VII 27,945,358.94 300.83 ɛ 2
Bengkulu 13-Aug-17 6.4 31 V 31,362,309.42 40.00 ɛ 6
Tuapejat 16-Aug-17 5.3 21.4 III 27,049,857.83 24.46 ɛ 1
Kepulauan
Mentawai 1-Sep-17 6.3 43.1 IV 29,995,651.07 111.25 ɛ 10
Ambon 31-Oct-17 6.1 6 IV 1,545,454.03 2,688.03 0.17% 1
Tasikmalaya 15-Dec-17 6.5 90 V 566,054,413.65 125.02 ɛ 9
Catatan (Note):
CAE Ratio: Claim Affected Exposure Ratio
ɛ= lebih kecil dari (less than) 0.01%
Claim Events Asuransi Gempa Bumi 2017
Earthquake Insurance Claim Events 2017
dalam jutaan Rp | In million IDR
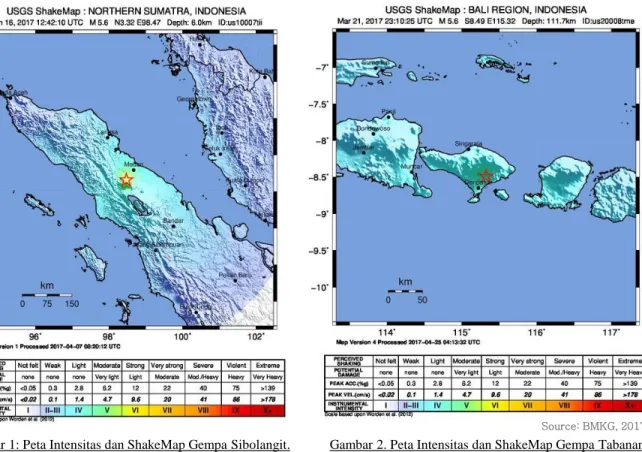
Tabel di atas menampilkan seluruh kejadian gempa bumi yang memiliki nilai klaim sepanjang tahun 2017. Data MMI, kedalaman dan magnitudo merujuk kepada data USGS. Dua gempa yang memiliki nilai klaim terbesar adalah gempa Tabanan dan gempa Sibolangit. Kerugian pada gempa Sibolangit meliputi kerugian pada okupasi komersial dan residensial, sedangkan kerugian pada gempa Tabanan hanya meliputi okupasi komersial. Pada tabel diatas, disajikan pula informasi eksposur terdampak yang diperoleh dari data eksposur on-risk dari seluruh risiko yang berada pada wilayah dengan intensitas lebih dari II MMI. Untuk mengukur lebih baik tingkat kerugian yang terjadi, data klaim dibandingkan dengan data eksposur terdampak dan disajikan dalam bentuk rasio CAE. Berdasarkan nilai CAE, tingkat kerugian gempa Ambon lebih tinggi melampaui gempa Tabanan dan gempa Sibolangit.
The table above shows all earthquake events that have claim throughout 2017. MMI data, depth and magnitude refer to USGS data. Two earthquakes with greatest claim value are the Tabanan and Sibolangit earthquake. Losses caused by Sibolangit earthquake spread among commercial and residential occupations, while losses caused by Tabanan earthquake only spread among commercial occupation. In the above table, we present information of affected exposure which is
Gambar 1: Peta Intensitas dan ShakeMap Gempa Sibolangit. Figures 1. Sibolangit Earthquake Intensity map and ShakeMap.
Gambar 2. Peta Intensitas dan ShakeMap Gempa Tabanan. Figures 2. Tabanan Eartquake Intensity map dan ShakeMap.
Shakemap untuk Gempa Sibolangit dan Tabanan
Shakemap for Sibolangit and Tabanan Event
Reasuransi MAIPARK | 22
Source: BMKG, 2017
Claim Events Asuransi Gempa Bumi 2017
Earthquake Insurance Claim Events 2017
Gambar 1 dan 2 adalah gambar peta guncangan dari dua kejadian gempa dengan nilai klaim tertinggi di tahun 2017 yang diperoleh dari situs BMKG. Merujuk pada data klaim kejadian gempa bumi di tahun 2017 (halaman 11) dan peta guncangan diatas, kerugian akibat gempa Sibolangit (16 Januari 2017) tersebar di wilayah yang memiliki intensitas IV hingga VII MMI, yaitu Kota Medan, Kab. Karo, Kab. Deli Serdang, Kota Banda Aceh dan Kota Subulussalam. Kerugian akibat gempa Tabanan (22 Maret 2017) menimbulkan kerusakan di wilayah Kab. Badung yang memiliki intensitas IV MMI.
Figures 1 and 2 are ShakeMap images of two earthquake events with the highest claim in 2017 obtained from BMKG site. Referring to earthquake events claim data and the above ShakeMap figure, losses caused by the Sibolangit earthquake (January 16, 2017) spread in areas having an intensity of IV to VII MMI, namely the city of Medan City, Karo Regency, Deli Serdang Regency, Banda Aceh City and Subulussalam City. Losses due to earthquake of Tabanan (March 22, 2017) caused some damage in the district of Badung Regency which has intensity IV MMI.
Gempa Bumi ≥ 6 Mw
Earthquake 2016 ≥ 6 MwKatalog Gempa Bumi 2016
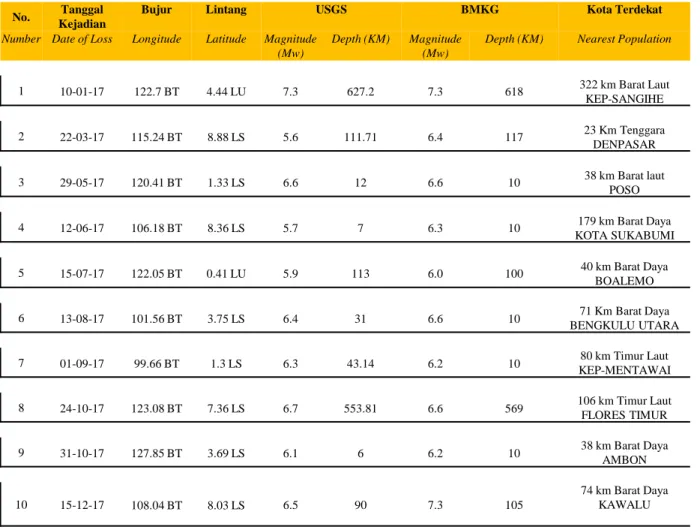
No. KejadianTanggal Bujur Lintang USGS BMKG Kota Terdekat
Number Date of Loss Longitude Latitude Magnitude (Mw)
Depth (KM) Magnitude (Mw)
Depth (KM) Nearest Population
1 10-01-17 122.7 BT 4.44 LU 7.3 627.2 7.3 618 322 km Barat Laut KEP-SANGIHE 2 22-03-17 115.24 BT 8.88 LS 5.6 111.71 6.4 117 23 Km Tenggara DENPASAR 3 29-05-17 120.41 BT 1.33 LS 6.6 12 6.6 10 38 km Barat laut POSO 4 12-06-17 106.18 BT 8.36 LS 5.7 7 6.3 10 179 km Barat Daya KOTA SUKABUMI 5 15-07-17 122.05 BT 0.41 LU 5.9 113 6.0 100 40 km Barat Daya BOALEMO 6 13-08-17 101.56 BT 3.75 LS 6.4 31 6.6 10 71 Km Barat Daya BENGKULU UTARA
7 01-09-17 99.66 BT 1.3 LS 6.3 43.14 6.2 10 KEP-MENTAWAI80 km Timur Laut
8 24-10-17 123.08 BT 7.36 LS 6.7 553.81 6.6 569 106 km Timur LautFLORES TIMUR
9 31-10-17 127.85 BT 3.69 LS 6.1 6 6.2 10 38 km Barat DayaAMBON
10 15-12-17 108.04 BT 8.03 LS 6.5 90 7.3 105
74 km Barat Daya KAWALU
Reasuransi MAIPARK | 24
Daftar Gempa Bumi 2017 Magnitudo ≥ 6.0 Mw
Earthquake Lists 2017 Magnitude ≥ 6.0 Mw
Tabel diatas memuat daftar seluruh kejadian gempa bumi di tahun 2017 yang memiliki magnitudo lebih dari atau sama dengan 6. Jumlah kejadian gempa ini menurun dibanding tahun sebelumnya yang berjumlah 18 kejadian. Diantara 10 kejadian pada tabel diatas, kejadian gempa pada 24 Oktober 2017 memiliki kemiripan baik dari segi parameter gempa maupun lokasi dengan gempa pada 12 Mei 2016.
The above table lists all earthquake events in 2017 that have magnitude more than or equal to 6. The number of earthquake events is decrease than the previous year i.e. 18 events. Among the 10 events listed above, the occurrence of earthquake on October 24th, 2017 have similarities in terms of seismic parameters and locations with earthquake occurred on May 12th,
Kesesuaian Metode Segitiga Terhadap Karakteristik Risiko Bencana Alam
Compatibility of triangle method to the catastrophe risk characteristicsUlasan Aktuaria
Kesesuaian Metode Segitiga Terhadap Karakteristik Risiko
Bencana Alam
Compatibility of triangle method to the catastrophe risk characteristics
Metode segitiga merupakan metode yang populer digunakan di industri asuransi umum dalam pembentukan cadangan klaim. Pembahasan mengenai formula perhitungan dalam metode segitiga telah diulas pada laporan statistik asuransi gempabumi sebelumnya, yaitu metode Chain Ladder pada laporan per 30 Juni 2014 dan Bornhuetter Ferguson pada laporan per 31 Desember 2014. Ulasan aktuaria periode ini mengangkat topik yang sama yaitu metode segitiga, namun membahas mengenai kesesuaiannya terhadap karakteristik risiko bencana alam.
Sebagaimana diketahui bahwa kejadian bencana alam merupakan kejadian yang jarang terjadi (low-frequency), namun dapat menimbulkan kerusakan yang besar (high-severity). Karakteristik tersebut berbeda dibandingkan dengan risiko pada umumnya, seperti kecelakaan kendaraan bermotor, sakit, kebakaran rumah tinggal dsb. Melalui studi literatur, kami menemukan fakta bahwa karakteristik risiko bencana alam kurang cocok dengan asumsi yang digunakan dalam metode segitiga. Berikut kutipan pendukung yang berasal dari buku Estimating Unpaid Claims Using Basic Techniques yang ditulis oleh Jacqueline Friedland, FCAS, FCIA, MAAA, FCA KPMG LLP:
Triangle method is the most popular method used to establish claim reserve in non-life insurance industry. Explanation about calculation formula in the triangle method had been written previously on earthquake insurance statistic report, i.e. Chain Ladder method in 30th June 2014 report and Bornhuetter Ferguson method in 31th December 2014 report. The actuarial review of this period has chosen the same topic, i.e. triangle method, but it specifically explain about the suitable in the case of natural catastrophe risk’s characteristic.
As we know that natural catastrophe event is rarely happened (low-frequency) but it caused huge damage (high-severity). The characteristic is different from other risk in general, such as collision of the vehicle, illness, house fire, etc. From the study of liturature, we found the fact that the characteristic of natural catastrophe risk is less suitable with assumption used in triangle method. Here is quotation from “Estimating Unpaid Claims Using Basic Techniques” book, written by Jacqueline Friedland, FCAS, FCIA, MAAA, FCA KPMG LLP:
Reasuransi MAIPARK | 26
Ulasan Aktuaria
Actuarial Review
“The development technique (i.e. Chain Ladder) is particularly suitable for high-frequency, low-severity lines
with stable and relatively timely reporting of claims, especially where the claims are evenly spread throughout the accident year (or policy year, report year, etc.) – that is,
the volume of claims experience is not changing significantly from one year to the next”.
“As noted in The Actuary and IBNR by R.L.Bornhuetter and R.E. Ferguson, a strictly fortuitous event such as an unusual
large claims should not distort an insurer’s estimate of IBNR. There are circumstances, however, such as a large winter storm or other catastrophe, in which the insurer’s