JEJAK
Journal of Economics and Policy
http://journal.unnes.ac.id/nju/index.php/jejak
Bank Stock Returns in Responding the Contribution of
Fundamental and Macroeconomic Effects
Ridwan Nurazi1 , Berto Usman2
1Department of Management, Faculty of Economics and Business University of Bengkulu
Permalink/DOI: http://dx.doi.org/10.15294/jejak.v9i1.7191
Received: Januari 2016; Accepted: Februari 2016; Published: March 2016
Abstract
This study attempts to examine the effect of financial fundamentals information using CAMELS ratios and macroeconomics variables surrogated by interest rate, exchange rate, and inflation rate toward stock return. By employing panel data analysis (Pooled Least Squared Model), the results reveal that several financial ratios perform a bit contrary to the theory, in which the ratio of CAR shows positive sign but insignificantly contributes to stock returns. Also, the ratio of NPL does not affect the return. In fact, ROE and LDR positively and significantly contribute toward banks’ stock return. Meanwhile, NIM and BOPO show negative signs. The other macroeconomic variables, interest rate (IR), exchange rate (ER) and inflation rate (INF) are consistent with the a priori expectation, in which those variables negatively and significantly contribute to stock return of 16 banks, for the observation period from 2002 to 2011 in the Indonesian banking sector.
Keywords: CAMELS, Interest rate, Exchange rate, Inflation, Bank stock return.
How to Cite: Nurazi, R., & Usman, B. (2016). Bank Stock Returns in Responding the Contribution of Fundamental
and Macroeconomic Effects. JEJAK: Jurnal Ekonomi Dan Kebijakan, 9(1), 131-146. doi:http://dx.doi.org/10.15294/jejak.v9i1.7191
© 2016 Semarang State University. All rights reserved
Corresponding author : ISSN 1979-715X
Address: Jl. W.R. Supratman, Kandang Limun, Kota Bengkulu
INTRODUCTION
Investigating how does stock returns responding the contribution of various num-bers of economics factor has been attracting the huge passion of many researchers. One of the most interesting subjects regarding to the performance of stock market is identify-ing the returns in bankidentify-ing sector. Recently, banking sector has shown a significant impact toward the development of Indone-sian economies. It can be seen from the high need of capital in order to broaden the opportunity of business in Indonesia (Kamaludin, Darmansyah, Usman, 2015). However, the increasing performance of Indonesia economies is not free from the indication of risk. Hereby, all of stakeholders need to pay more attention in regard to the probability of risk as faced by the stakeholder itself. In order to investigate the existence of risk and the performance in banking sector, information from the financial statement is necessarily important to be analyzed. The common method in determining whether bank performance good or not, CAMELS bank method is employed.
CAMELS analysis (Capital, Assets, Mana-gement, Earnings, Liquidity and Sensitivity to Market Risk) is a tool which is basically used to measure risk and bank performances in banking sector. Particularly, hereby CAMELS analysis employing microeconomic data or fundamental measures that can be performed by utilizing data obtained from financial statements. CAMELS may also determine whether a bank is in the health, fit enough, or un-health category (Bank Indone-sia Regulation (PBI) No. 15/2/PBI/2013).The measure indicators derived from these finan-cial ratios are also influenced by macroeco-nomic factors. In accordance to the Arbitrage Pricing Theory (APT), the variation of stock
returns is not only explained by a single
fac-tor beta (β), but also determined by many
external factors. Therefore, it is plausible that the macroeconomic variables partially influencing bank stock returns, such as inter-est rate, exchange rate, and inflation rate (Aurangzeb & Afif, 2012).
This study concentrates on the investi-gation of financial ratios effects represented by CAMEL analysis as well as the effect of several macroeconomic variables, namely interest rate (IR), exchange rate (ER), and inflation rate (INF). In line with the theory of investment, firm value tends to reflect the soundness, in which the healthy firms tend to be more valuable for the prospective investors and vice versa. Nevertheless, the aspect of sensitivity to market risk is not analyzed because it is related to broader market factors, and it is including various industries circumstances. Further, the objec-tive of our study concentrates on investigat-ing the contribution of independent varia-bles on the dependent variable that is surrogated by CAMEL ratios and macroeco-nomic variables toward bank stock returns in Indonesia stock exchange during the obser-vation period from 2002 to 2011.
method. Study conducted by Kouser & Saba (2012) notes that the assessment of firm's stock, particularly stock prices in banking sector tend to be equal to its intrinsic value. It provides an opportunity for investors to re-evaluate their investment decisions so as not to get caught for buying overvalued stocks. They also point out that the wrong purchase inclines to result in loss that will be borne by the investor itself. As more extreme results, losses due to low performance and less healthy banks can trigger the causes of fi-nancial crisis. Therefore, assessment is necessarily important to conduct in order to show the firm performance to shareholders, government, and other inter-related parties. The use of CAMEL ratios as a tool in eva-luating the performance and soundness of banks, is based on Bank Indonesia Circular Letter No.6/23/DPNP/dated 31 May 2004 on Bank Health Assessment Procedures and regulations No.6/10/PBI/2004 BI on Banking Rating System. A handful studies have been undertaken to review the assessment of CAMEL. Nurazi (2003), Nurazi & Evans (2005) examine the effects of CAMEL ratios comprising of Capital Asset Ratio (CAR), Non Performing Loan(NPL), Loan to Deposit ratio (LDR) and other variables toward bank stock returns. They reveal that CAR has per-formeda positive effect toward bank stock returns, while the NPL and LDR have shown negative contribution toward bank return in Indonesian banking sector. Further, Chen (2011) notes similar results, in which the use of variables in CAMEL ratio analysis is in line with the theory developed in corporate finance. He believes that a good performance measured by the fundamental information will be a positive signal for the potential in-vestors to put their money on the related firm.
Instead of microeconomic variables collected from the financial statements, this study also identifies the contribution of macroeconomic variables toward bank stock returns. As study conducted by Choi & Elyasiani (1997), they find that changes in interest rate (IR) and exchange rate (ER) influence the market value of bank. Choi & Elyasiani examine 59 existing commercial banks in the United States from the time period 1975 to 1992. The results reveal that during the period of observation, there was strong correlation between IR and ER on the market value of banks. Hereby, our study focuses on several sectors that have not yet been investigated by other researchers. The combination of macro and microeconomics factors is interesting to be conducted. Also, the confirmation with respect to the results from previous studies is important to be extended.
Deposit Ratio (LDR) have effects on stock return in banking sector. Secondly, we sup-pose that macroeconomic variables namely, Interest rate (IR,) Exchange Rate (ER), and Inflation Rate (INF) have effects on stock returns in Indonesian banking sector.
Fundamental Information, Macroecono-mics Factors and Banks’ Stock Returns
Arbitrage Pricing Theory (APT) explains that the fluctuation of risks and returns appears as result of the arbitrage existence in major capital markets. As initiated by Ross (1976), this theory was proposed in hope of covering the weak assumptions of Capital Asset Pricing Model (CAPM), which only utilizes one risk factor (beta) as a single determinant in predicting the volatility returns of individual stocks. Further, APT is also determined as a one-period model which explains the consistency of the sto-chastic properties of returns of capital assets with a variable structure (Ross, 1976; Shanken, 1992).The emerging concept of APT as an alternative for the assessment of CAPM leads to the emergence of multifactor models. It is developed by referring to the concept of APT. The assumption of this model conjectures that the economic factors contribute to the variance of stock returns. In this case, the factors that may influence stock returns not only the market index, but can also be generated by various macroeco-nomic and microeconomic factors (Tandelilin, 2010).
Fundamental information can be utilized by investors in assessing firm's prospects. In-vestors, who obtain the specific information about certain firm closely associated to the firm's performance. The higher information held by investors, indicating that the compa-ny is more open about their activities. Therefore, the closeness no longer exists
(Hays et al., 2011). Also, financial information is supposed to be an alternative method to reduce the high level of asymmetry informa-tion between informed and un-informed investors, in which Usman & Tadelilin, (2014) and Nurazi & Usman (2015) reports that the availability of fundamental financial infor-mation on the internet can be utilized as supporting information for the prospective investors in determining their portfolio of investments. Moreover, Nurazi, Kananlua & Usman (2015) document that the bigger company size tends to show the more prom-ising economic performance (returns)for its investors. In more specific case, Nurazi, Santi & Usman, (2015) point out that the availabil-ity of information as provided by the com-pany will be a positive signal. It denotes that the company inclines to implement Good Corporate Governance (GCG) and does not relating to the abuse of right of neither majority nor minority shareholders. The proposed theory is in line with the previous research, which shows that there is correla-tion and causality relacorrela-tionship between fi-nancial information and bank value (Gunsel, 2007).
CAMEL is commonly utilized as the
in-dicator of bank’s health. Hereby, virtually all
second CAMEL component is asset quality. It refers to the quantity of existing and poten-tial credit risk which is associated to the loan, portfolio of investment, and other asset as well as off-balance sheet transaction. Third, management quality is conjectured as one of determinants in explaining the bank performance. Hereby, the management assessment is necessarily important to inves-tigate and evaluate the managerial capability. Forth, the earning generated by the banks will show the amount of earnings resulted from bank activities during the accounting period. Fifth, banks need to identify their level of liquidity. It is important as an
indi-cator of bank’s ability to fulfilling its obliga
-tion prior to the maturity time.
Seminal studies have been disseminated in ascertaining the relationship between fun-damental information, macroeconomic variables, and stock returns. Arbitrage Pric-ing Theory (APT) states that the macro eco-nomic factors have contribution to the varia-tion of stock returns, and these are conjec-tured as the risk factors that can result in the volatility of stock performance. In addition to measuring the market performance, many
researchers utilize one factor beta (β). As
consequence, the growing number of emerging debate arises among academics and practitioners. This debate arises because most academics and practitioners think beta was no longer able to explain the variance of stock returns. To anticipate the pros and cons regarding the ability of beta in predicting stock returns, a proposed theory emerged as concept of APT. This concept appears to anticipate the weaknesses of beta
(β). The theory states that market not only predicted by one risk factor beta (β), but also by the other factors such as exchange rate, inflation, and interest rate. Therefore, the
validity of CAPM needs to be redefined (Aga, & Kocaman, 2008).
Moreover, Oktavilia (2008) notes that the stable financial system and banking in-dustry will create the supporting environ-ment for the customers and investors to put their money in money market. The efficient financial intermediation will also generate the opportunity in order to push the invest-ment and economic growth. Hereby, the specific financial indicators are necessarily important. Ervani (2010) documents that several financial indicators consisting of CAR, LDR and BOPO clearly useful in explaining the variation of ROA of public listed bank. Her study implies that the well-managed of profitability, solvability, and liquidity ratio have played essential role in supporting the performance of public listed bank in Indonesian stock exchange. In another case, Prishardoyo & Karsinah (2010) investigate the contribution of macroeco-nomic variables toward the volume of trans-action in money market. Their study reveals that inter-bank money market also deter-mines the surplus unit and deficit units of banks itself. Hereby, the existence of interest rate plays a significant role in explaining the performance between banks in inter-bank money market.
Studies have shown that capital market researchers were always passionate about stock returns volatility. Hereby, besides the fundamental information, macroeconomics factors have played a big role in explaining the volatility of stock returns. In particular,
the variation of bank’s stock returns is
returns. Aggarwal (1981) argues that the change in stock returns appears due to the
variation in exchange rate alters firm’s profit
which in turn affects the stock prices. Fur-ther, the factor of currency appreciation is also associated to the decrease of stock prices
by reducing bank’s profit. Another macro
-economics factor such as interest rate is conjectured to perform the same contri-bution with exchange rate. Hereby, it is
believed that interest rate and bank’s stock
returns are negatively correlated. Al Mukit (2012) points out that a reduction in the interest rate leads to lower the cost of bor-rowing. Moreover, inflation as the macroe-conomics factor also negatively contributes
to bank’s stock returns. The rise in prices of
goods and services reducing the purchasing power each unit of currency can buy. In a specific case, the increase of inflation has indicated insidious effects such as the input prices tend to be higher, the lower number of good that can be purchased by the consum-ers, the declining profit and demand of firms, and the slow of economy for a particular time will result in recession toward bank activities and its return.
RESEARCH METHODS
The population in this study consists of all incorporated companies in Indonesia Stock Exchange (IDX). Meanwhile, the sam-ple is classified only for the banking sector, and the data of firms specific relating to fun-damental effects are collected from the Indonesian Capital Market Directory (ICMD CD-ROM). The samples used in this study were determined as many as 16 companies and taken by employing purposive sampling method with the following criteria; first, the sample should be incorporated in banking sector, and its stock actively traded in Indo-nesia Stock Exchange during the time period
from 2002 to 2011.Second, the sample should have published their financial reports in the time period from 2002 to 2011. Third, sample should have not experienced temporary suspension or termination during the period of observation.
Based on the above criterion, in order to obtain fairly accurate results, it is expected that all samples in our study have complete data observations within the same period. In addition, the reason of using banking sector as the sample is due to its significant perfor-mance relating to trading activity for the last ten years. Moreover, to understand more about the concepts of this research, we set up the operational definitions. Hereby, operational definitions for each variable are composed in order to specify them (Hartono, 2007).
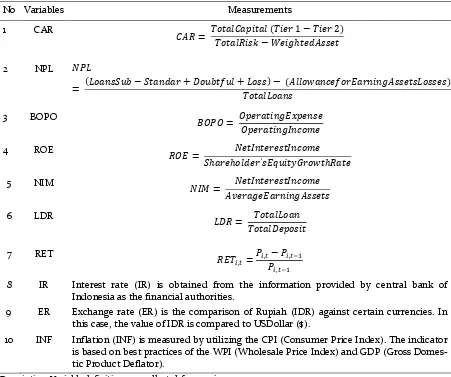
As can be seen in Table 1, microeco-nomic variables or fundamental information are employed to measure the ratio of CAMEL. These variables consist of CAR (Capital Adequacy Ratio), NPL (Non Per-forming loans), NIM (Net Interest Margin), BOPO (Operating Expenses to Operating Income), ROE (Return on Equity) and LDR (Loan to Deposit Ratio). Several indicators retrieved from the ratio of CAMEL are a handful measures for representing micro-economics indicators that might have impact toward bank stock returns. Notwithstanding, the data analysis in our study utilizes panel data analysis with pooled least square (PLS) model. The statistical model by employing PLS model is also known as the Gaussian method. The equation model applied in this research can be seen as follows.
RETi,t= α + β1CARi,t+β2NPLi,t+ β3BOPOi,t+
β4ROEi,t+ β5NIMi,t+ β6LDRi,t+
Table 1. Operational Definitions of Research Variables
No Variables Measurements
1 CAR
𝐶𝐴𝑅 = 𝑇𝑜𝑡𝑎𝑙𝐶𝑎𝑝𝑖𝑡𝑎𝑙 (𝑇𝑖𝑒𝑟 1 − 𝑇𝑖𝑒𝑟 2)𝑇𝑜𝑡𝑎𝑙𝑅𝑖𝑠𝑘 − 𝑊𝑒𝑖𝑔ℎ𝑡𝑒𝑑𝐴𝑠𝑠𝑒𝑡
2 NPL 𝑁𝑃𝐿
= (𝐿𝑜𝑎𝑛𝑠𝑆𝑢𝑏 − 𝑆𝑡𝑎𝑛𝑑𝑎𝑟 + 𝐷𝑜𝑢𝑏𝑡𝑓𝑢𝑙 + 𝐿𝑜𝑠𝑠) − (𝐴𝑙𝑙𝑜𝑤𝑎𝑛𝑐𝑒𝑓𝑜𝑟𝐸𝑎𝑟𝑛𝑖𝑛𝑔𝐴𝑠𝑠𝑒𝑡𝑠𝐿𝑜𝑠𝑠𝑒𝑠)𝑇𝑜𝑡𝑎𝑙𝐿𝑜𝑎𝑛𝑠
3 BOPO
𝐵𝑂𝑃𝑂 = 𝑂𝑝𝑒𝑟𝑎𝑡𝑖𝑛𝑔𝐸𝑥𝑝𝑒𝑛𝑠𝑒𝑂𝑝𝑒𝑟𝑎𝑡𝑖𝑛𝑔𝐼𝑛𝑐𝑜𝑚𝑒
4 ROE
𝑅𝑂𝐸 = 𝑆ℎ𝑎𝑟𝑒ℎ𝑜𝑙𝑑𝑒𝑟𝑁𝑒𝑡𝐼𝑛𝑡𝑒𝑟𝑒𝑠𝑡𝐼𝑛𝑐𝑜𝑚𝑒′𝑠𝐸𝑞𝑢𝑖𝑡𝑦𝐺𝑟𝑜𝑤𝑡ℎ𝑅𝑎𝑡𝑒
5 NIM
𝑁𝐼𝑀 = 𝐴𝑣𝑒𝑟𝑎𝑔𝑒𝐸𝑎𝑟𝑛𝑖𝑛𝑔𝐴𝑠𝑠𝑒𝑡𝑠𝑁𝑒𝑡𝐼𝑛𝑡𝑒𝑟𝑒𝑠𝑡𝐼𝑛𝑐𝑜𝑚𝑒
6 LDR
𝐿𝐷𝑅 = 𝑇𝑜𝑡𝑎𝑙𝐷𝑒𝑝𝑜𝑠𝑖𝑡𝑇𝑜𝑡𝑎𝑙𝐿𝑜𝑎𝑛
7 RET
𝑅𝐸𝑇𝑖,𝑡=𝑃𝑖,𝑡𝑃− 𝑃𝑖,𝑡−1
𝑖,𝑡−1
8 IR Interest rate (IR) is obtained from the information provided by central bank of Indonesia as the financial authorities.
9 ER Exchange rate (ER) is the comparison of Rupiah (IDR) against certain currencies. In this case, the value of IDR is compared to USDollar ($).
10 INF Inflation (INF) is measured by utilizing the CPI (Consumer Price Index). The indicator is based on best practices of the WPI (Wholesale Price Index) and GDP (Gross Domes-tic Product Deflator).
Description: Variable definitions are collected from various sources.
Statistical model 1 is utilized in explain-ing the variation caused by independent variables toward the dependent variable. Hereby, we employ nine main independent variables and a controlling variable. For further explanation, bank stock returns (RETi,t) is determined by calculating the
annual returns of 16 bank used as samples. CARi,t refers to the number of capital
adequacy ratio which is maintained by the banks. We denote NPLi,t as the percentage of
non-performing loan per each year of observation. BOPOi,t is calculated by dividing
the operating expenses of every sample to its operating income. ROEi,t is specific data
regarding to the ability of bank in generating the profitability based on its equity. NIMi,t
denotes as the net interest margin which is calculated by dividing net interest income of bank activity with its average earning assets. LDRi,t refers to the number of total loan
which is distributed to the third party compared to the number of total deposit. IRt
is the information relating to interest rate as recorded by the central bank of Indonesia. Further, we denote ERt as the comparison of
Rupiah (IDR) against certain currencies. In this case, the value of IDR is compared to US Dollar ($). Finally, INFt is utilized to
performed dominant contribution toward the dependent variable. We also use controlling variable “stock prices” (SP) to clarify the effects generated by the interaction of main variables. Moreover, Winarno (2009) notes that there are three approaches that can be used in estimating panel data modelling, namely Pooled Least Square (PLS) model, Fixed Effect Models (FEM), and Random Effects Models (REM). To determine which model will be used in conducting panel data estimation, we used Chow test. Hereby, Chow test is employed to compare the effectiveness of PLS model and FEM. Further, in comparing whether FEM or REM is utilized, we employ the Hausman test. Procedurally, if the first examination by utilizing Chow test confirms to use the PLS
model, the second test with Hausman test is not necessary anymore to be conducted. However, if the output of Chow test confirms to recommend FEM as the best model, the procedure needs to be continued to the Hausman test. This circumstance also confirmed by Baltagi (2005), in which the final model needs to follow the structural equation in order to gain the best estimation model in panel data analysis.
RESULTS AND DISCUSSION Summary Statistics
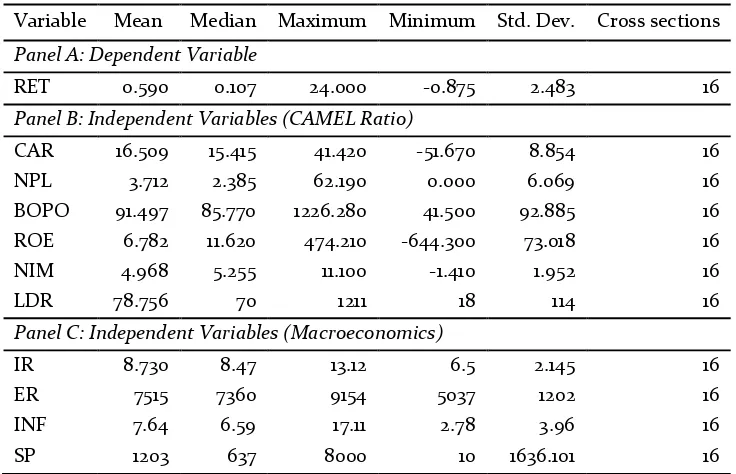
We begin the analysis by categorizing the data in the form of descriptive statistic. The number of sample is determined as 16 banks during the time period of observation ranging from 2002 to 2011.
Table 2. Summary Statistics
Variable Mean Median Maximum Minimum Std. Dev. Cross sections
Panel A: Dependent Variable
RET 0.590 0.107 24.000 -0.875 2.483 16
Panel B: Independent Variables (CAMEL Ratio)
CAR 16.509 15.415 41.420 -51.670 8.854 16
NPL 3.712 2.385 62.190 0.000 6.069 16
BOPO 91.497 85.770 1226.280 41.500 92.885 16 ROE 6.782 11.620 474.210 -644.300 73.018 16
NIM 4.968 5.255 11.100 -1.410 1.952 16
LDR 78.756 70 1211 18 114 16
Panel C: Independent Variables (Macroeconomics)
IR 8.730 8.47 13.12 6.5 2.145 16
ER 7515 7360 9154 5037 1202 16
INF 7.64 6.59 17.11 2.78 3.96 16
SP 1203 637 8000 10 1636.101 16
Further, the descriptive data in Table 2 presents the detail and fundamental information about mean, median, maximum, minimum, and standard deviation value of samples as follow. Table 2 provides infor-mation with respect to the descriptive statistics of every variable. It can be seen that the number of variables used in this study consists of eleven variables. These variables are divided into three panels. Independent variables composed from CAMEL ratios are enclosed in Panel B, macroeconomics varia-bles are available in Panel C, and the dependent variable is in Panel A.
Trouble Shooting in Regression Analysis
Predictive model basically must have contained BLUE criteria (Best, Linear, Unbiased and Estimator). The explanation of this characteristic is that the regression variant has a minimum value. Minimum variants consistently generate estimation output which is far from the value of popu-lation parameter. The value will be close to zero along with the addition of sample. If there is problem during the estimation process to obtain the output that has the BLUE criteria, then the problem can be resolved by Generalized Least Square(GLS) as suggested by Widarjono, (2009). Hereby, Generalized Least Square (GLS) is a type of treatment used in this study. The purpose of using this treatment is to minimize the risk
of infraction on the classical assumptions. In accordance to the opinion of Gujarati & Porter (2009), the resulting estimator by using GLS method is BLUE. Therefore, the encountered problems such as the existence of heteroscedasticity, autocorrelation, and multicollinearity can be solved. Moreover, Baltagi (2005) notes that by employing panel data analysis, the problem regarding BLUE criteria no longer exists. Panel data is formed by the combination of times series and cross sectional data. By selecting the most appro-priate model between PLS, FEM and REM model, it can be inferred that the statistical output resulted from the appropriate model has drawn the most efficient output for the predictive model itself.
Panel Data Analysis and Hypothesis Testing
Before performing the testing of predic-tive model, we firstly run proper model selection procedures in estimating and obtaining the most efficient output. In the first step, the examination is started by employing Fixed Effect Model (FEM). Then we run the Chow test for the subsequent comparison with Pooled Least Squared (PLS) model. Chow test output for the predictive equation model is shown as follow in table 3.
.
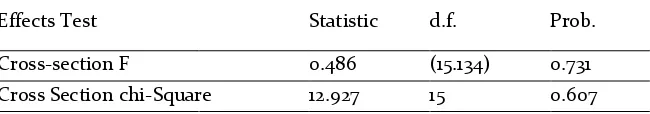
The output of Chow test for the equation
Table 3. Chow Test Outputs
Redundant Fixed Effects Tests Pool: BANKING
Test cross-section fixed effects
Effects Test Statistic d.f. Prob.
Cross-section F 0.486 (15.134) 0.731
Cross Section chi-Square 12.927 15 0.607
model displays that both F value and Chi square value are insignificant (p-value> 0.05 and the value of chi-square > 0.05). Conse-quently, H0 (Poled Least Square) is support-ed and H1 (Fixsupport-ed Effect Model) is unsupport-ed. Accordingly, the Chow test output indicates that the most recommended model used in this study is Pooled Least Squared (PLS) model. Further, according to Baltagi (2005), the regression procedure can be done directly without conducting Hausman test in order to compare between FEM and REM. It is due to the result of chow test has shown PLS model as the most efficient and the best estimation regression model in panel data modeling. Based on the information in Table 4, it is obviously known that the recom-mended model used in this study is PLS model. Then we performed the following test by using panel data regression analysis with PLS model.
Hypothesis Testing
In the next step, we analyze the hypotheses testing which is performed by employing the statistical model one. Results shown from the examination of fundamental effects comprising of Capital Adequacy ratio (CAR), Non Performing Loan (NPL), Operating Expenses to Operating Income (BOPO), Return on Earning (ROE), Net Interest Margin (NIM), Loan to Deposit Ratio (LDR), Interest rate (IR), Exchange rate (ER), and Inflation rate (INF) toward stock return (RET) of banking sector in Indonesia stock exchange are shown in Table 4 as follow. Further, the additional fundamental information regarding to the goodness of fit model namely coefficient determination (R2)
and adjusted R2, F statistic, Prob (F-statistic)
are also presented in Table 4.
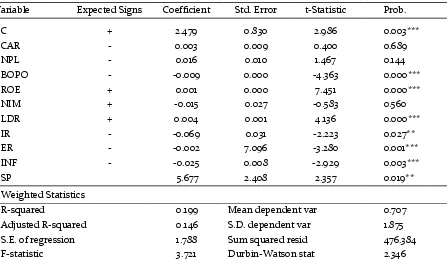
Table 4. Executive Summary of Hypothesis Testing By Using Pooled Least Square Model
Dependent Variable: RET
Method: Pooled EGLS (Cross-section weights)
White period standard errors & covariance (d.f. corrected)
Variable Expected Signs Coefficient Std. Error t-Statistic Prob.
C + 2.479 0.830 2.986 0.003***
CAR - 0.003 0.009 0.400 0.689
NPL - 0.016 0.010 1.467 0.144
BOPO - -0.009 0.000 -4.363 0.000***
ROE + 0.001 0.000 7.451 0.000***
NIM + -0.015 0.027 -0.583 0.560
LDR + 0.004 0.001 4.136 0.000***
IR - -0.069 0.031 -2.223 0.027**
ER - -0.002 7.096 -3.280 0.001***
INF - -0.025 0.008 -2.929 0.003***
SP 5.677 2.408 2.357 0.019**
Weighted Statistics
R-squared 0.199 Mean dependent var 0.707
Adjusted R-squared 0.146 S.D. dependent var 1.875
S.E. of regression 1.788 Sum squared resid 476.384
Prob(F-statistic) 0.000***
Description: According to the statistical output by using Pooled Least Square (PLS) model, the value of coefficient determination or R2is about 0.199 or 19.90%. It means that approximately 19.90% of the variation occurs in the dependent variable (RET) can be explained by the contribution of independent variables (CAR, NPL, BOPO, ROE, NIM, LDR, IR, ER, INF, and SP). Meanwhile the other 80.10% can be explained by inserting additional factors outside the research model.
*** (Statistically significant at the 0.01 level) ** (Statistically significant at the 0.05 level) * (Statistically significant at the 0.10 level)
We commence the investigation relating to the effects generated by every indepen-dent variable toward the depenindepen-dent variable. Independent variables consisting of CAMEL ratios and macroeconomic variables are also supported by a controlling variable namely stock price (SP). Stock price (SP) is inserted as controlling variable because the higher prices would indicate the higher returns obtained by investors. Therefore, the aim to use stock price as a controlling variable is to clarify and purify the influence of error term derived from other variables beyond the predictive model. Further, the value of coefficient determination (R2) and adjusted
R2 is relatively small, in which the value is
only around 19.9 percent. This means that the ability of every independent variable in explaining the variation of dependent variable (stock returns) is only 0.199 or equal as 19.90 percent. Meanwhile, the other factors outside the predictive model are supposed to influence the variance of stock returns in banking sector, which the standard error of estimation output is 80.10 percent. This result is in line with the value of adjusted R2, where the small value of R2 is
followed by the adjusted R2. In
under-standing this phenomenon, Insukindro (1998) points out that the coefficient of determination was not the only criteria in determining the goodness of fit model. However, this could be also investigated by analyzing the other factors, such as the usage
of appropriate variables as determined by the appropriate theory.
Independent variables tested by using panel data analysis show quite varied results. The aspect of capital represented by CAR displays positive coefficients value, but in significantly (p> 0.1) contributes to the stock returns (RET). The obtained result is less consistent with the a priori expectation. Further, the aspect of asset surrogated by NPL ratio also reflects likewise results with CAR. This result is contrary to the theory, in which banks in healthy category tend to have low value of NPL. However, the NPL ratio has performed in significant (p> 0.1) contribution toward stock returns (RET).
0.01) impact toward stock returns in banking sector, while NIM on the contrary has no effect (p> 0.1) toward stock returns. The un-ability of Net Interest Margin (NIM) in explaining the variation of stock return is triggered by the high volatility of interest rate in Indonesia as long as the observation period from 2002 to 2011. It is clearly observed that in the period of observation, Indonesia banking sector had experienced several economics shocks, such as the remaining effects of financial crisis in 1989, and the financial global crisis in 2008. These circumstances indicate that banking sector had experienced troubles in managing its net interest income and average earning assets. The last aspect of liquidity ratio is Loan to Deposit Ratio (LDR). The result indicates that LDR positively and significantly (p< 0.01) influencing stock returns. It denotes that bank will gain more advantages when it increases the loan to customer. Consequen-tly, bank will gain more profit based on the spread produced by its activities.
Moreover,the first macroeconomic variable surrogated by interest rate(IR) performs negative and significant (p< 0.05) contribution toward stock returns. This is consistent with the theory and previous research that has been highlighted before. The second macroeconomic variable is exchange rate (ER). According to statistical output shown in Table 4, ER has negatively and significantly (p< 0.01) contributed to stock returns. This means that the higher exchange rate indicates the weakening of Rupiah (IDR) against the US Dollar ($). This circumstance tends to result in a decrease of bank stock returns. Finally, the variable inflation (INF) has performed a negative and significant (p< 0.01) effect on stock returns in Indonesian banking sector.
According to the output of panel data analysis with Pooled Least Square (PLS) model, it is known that F statistic value is bigger than the F table. This is also reflected by the value of F statistic Prob that is equal to 0.000. This significant value is smaller than the specified alpha of 0.05. It can be concluded that simultaneously or at least there is one of the nine independent varia-bles employed in the predictive model contribute to the variation of bank stock returns in Indonesia stock exchange.
Discussion
Based on the previous studies in developing market, we consider to start the research regarding to micro and macroeco-nomics variables in the context of emerging market. It is important to understand though, that in the context of an emerging economy the range of variables that might be employed for the purpose of explaining the variation between CAMEL, macroeconomics factors and of bank stock returns is somewhat limited. In particular, the mathe-matical model regarding to the outputs of panel data regression is displayed as follows.
RETi,t= α + β1CARi,t+β2NPLi,t+ β3BOPOi,t+
β4ROEi,t+ β5NIMi,t+ β6LDRi,t+
β7IRt+ β8ERt+ β9INFt+ β10SPi,t+ ε (2)
RET = 2.479+ 0.003CAR + 0.016NPL – 0.009BOPO + 0.001ROE –
0.015NIM + 0.004LDR – 0.069IR – 0,002ER – 0.025INF + 5.677SP + ε (3)
increasing by 1 unit, there will be an increase in bank stock returns as 0.003. This is consistent with the previous research conducted by Nurazi (2004), and Kouser & Saba (2012) who have documented that the coefficient value of CAR will show positive sign toward bank stock returns. Moreover, bank stock returns inclines to increase as the NPL gets bigger. However, the second hypothesis is unsupported because it does not fit with our a priori expectation and previous research, in which the increase of NPL should be resulted in a negative contribution on bank stock returns. Further, the increase of Operating Expenses to Operating Income (BOPO) will result in the decrease of returns as 0.009. This is consistent with the proposed hypothesis because the higher BOPO ratio indicates the amount of income used to finance the firm's operations. This finding confirms the research conducted by Aurangzeb & Afif, (2012) who note that the efficiency ratio has significant and negative influence on stock returns in banking sector.
Moreover, if there is an increase of ROE by one unit, it will increase the stock returns as 0.001. ROE indicates that the higher performance of bank is getting better in utilizing its equity. Further, stock returns gets lower as NIM increases by one unit. This resultis not consistent with the proposed hypothesis, so that the hypothesis five is unsupported. The explanation relating to the inconsistency of NIM is triggered by transitory effects, such as the global financial crisis in 1998, and 2008 which had influenced
the banks’ ability in managing their profit.
Moreover, stock returns increases as 0.004 when LDR gets higher. This is consistent with theory and the previous research, which show that the higher LDR ratio indicates the
more third-party funds disbursed in form of loans. Therefore, stock returns will increase as the higher income is derived from the distribution of funds. The findings also confirm the previous research as practiced by Nurazi (2003), Nurazi & Evans (2005), Sangmi (2010), Laghari et al., (2011), Christopolous (2011), Kouser & Saba (2012).
CONCLUSION
This study examines the APT theory which reveals that there are other variables that can be utilized to explain the variation of stock returns. In accordance to the results, it can be inferred several conclusions in which not all of fundamental effects calculated by employing CAMEL ratio have performed the expected contribution toward bank stock returns. In particular, Loan Deposit Ratio (LDR) and Return on Earning (ROE) have shown positive and significant contribution toward stock returns. In line with financial theory, Operating Expenses to Operating Income (BOPO) will negatively and significantly contribute to bank stock returns. However, Capital Adequacy Ratio (CAR), Non Performing Loan (NPL) and Net Interest Margin (NIM) do not perform significant contribution toward stock returns. Further, the utilization of macro variables such as interest rate (IR), exchange rate (ER), and inflation rate (INF) display the negative and significant effects toward bank stock returns in Indonesia stock exchange (IDX).
Furthermore, our research is not free from limitation which is caused by several constraints and conditions. The limitations of study can be considered for further scientific research, particularly in developing like wise study not only in terms of empirical study, but also in terms of the longitudinal and methodological studies. Moreover, we find some limitations such as the limited sample to a single industry, and within a certain time period observation. This in turn will lead to the incompleteness of data. Therefore, it is considerably important to commence some adjustments on several specific data. Secondly, the research was only conducted in Indonesian stock exchange.
Even though many capital markets in Asia are interrelated, correlated, and integrated with the Indonesian stock exchange, it is plausible for the next researchers to discover a lot of issues and differences that still have not been yet investigated in the banking sector.
REFERENCES
Aga, M., & Kocaman, B. (2008). Efficient Market Hypothesis and Emerging Capital Market: Empi-rical Evidence From Istanbul Stock Exchange.
International Research Journal of Finance and Economics. Vol. 13 (10). Pp. 131-144.
Aggarwal, R. (1981). Exchange Rates and Stock Prices: A Study of the US Capital Markets under Floating Rates. Akron Business and Economic Review.
Vol.12. Pp. 7-12.
Al-Abadi, I. M., & Al-Sabbagh, W. U. (2006). Interest Rate Sensitivity, Market Risk Inflationand Bank Stock Returns. Journal of Accounting-Business and Management. Vol. 13(1).Pp. 25-38.
Al-Mukit, D., M. (2012). Effects of Interest Rate and Exchange Rate on Volatility of Market Index at Dhaka Stock Exchange. Journal of Business and Technology. Vol. 7 (2). Pp.1-18.
Aurangzeb.,& Afif, K. (2012). Effect of Time on Interest Rate, Exchange Rate and Stock Return”.Journal of Finance and Economics. Vol. 86 (4). Pp. 212-229. Bank Indonesia Regulation (PBI). (2013). No. 15/2/PBI/
2013. Bank Indonesia Circular Letter No.6/10/PBI/ 2004.
Bank Indonesia Circular Letter No.6/23/DPNP/dated 31 May (2004) on Bank Health Assessment Procedures and regulations No.6/10/PBI/2004 BI on Banking Rating System
Baltagi, B. H. (2005). Econometric Analysis of Data Panel 3rd Edition. England. John Wiley &Sons.
Chen, S. (2011). Capital Ratio and The Cross sectional of Bank Stock Return: Evidence from Japan”.Journal of Asian Economics. Vol. 22 (2). Pp. 99-114. Christopolous, G. A., Mylonakis, J., & Diktapanidis, P.
(2011). Could Lehman Brothers Collapse Be Anticipated? An Examination Using CAMELS Rating Systems”.International Business Research.
Choi, J. J.,& Elyasiani, E. (1997). Derivative Exposure and The Interest Rate and Exchange Rate Risk sof U.S. Banks. Journal of Financial Services Research.
Vol. 12 (2/3). Pp. 267- 286.
Czaja, G. M., Scholz, H., & Wilkens, M. (2010). Interest Rate Risk Reward In Stock Return of Financial Corporations: Evidence From Germany. European Journal Management. Vol.16 (1). Pp. 124-154. Ervani, E. (2010). Analisis Pengaruh Capital Adequacy
Ratio, Loan to Deposit Ratio, dan Biaya Operasional Bank Terhadap Profitabilitas Bank Go Public di Indonesia Periode 2000-2007. JEJAK Journal of Economic and Policy. Vol. 3 (2). Pp.165-171.
Faff, W. R., Hodgson, A., & Kremmer, L. M. (2005). An Investigation on the Impact of Interest Rate and Interest Rate Volatility on Australian Financial Sector Stock Return Distribution. Journal of Business and Accounting. Vol. 32 (5). Pp. 1001-1031. Gujarati, N. D. (1995). Basic Econometrics, Third
Edition. New York: Mac Graw Hill.
Gujarati, N. D., & Porter, C. D. (2009). Basic Econome-tric, Fifth Edition. New York: Mac Graw Hill. Irwin.
Gunsel, N. (2007). Financial Ratios and The Proba-bilistic Prediction of Bank Failure in North Cyprus
European Journal Scientific Research. Vol. 18 (2). Pp. 191-200.
Hartono, J. (2007). Metode Penelitian Bisnis, Salah
Kaprah dan Pengalaman Pengalaman. Yogyakarta.
BPFE. Indonesia.
Hays, H . F., De Lurgio, A. S., & Gilbert, H. A. (2011). Efficiency Ratios and Community Bank Performance. Journal of Finance and Accountancy.
Vol. 5 (1). Pp.1-15.
Insukindro. (1998). The Syndrome of R2 in Time Series Regression Linear Model. Jurnal Ekonomi dan Bisnis Indonesia. Vol. 13 (4). Pp. 1-11.
Jawaid, T. S., & Ui Haq, A. (2012). Effect on Interest Rate Exchange Rate and Their Volatilityon Stock Prices: Evidence From Banking Industry of Pakistan. Theoritical and Applied Economics. Vol. 21. (8). Pp. 153-166.
Kamaludin, Darmansyah, Usman, B. (2015). Deter-minan Non Performing Loan (NPL) Pada Industri Perbankan (Bukti Empiris Perusahaan Go Publik di Bursa Efek Indonesia). Jurnal Aplikasi
Manajemen. Vol. 13. No. 4. Pp. 547-556.
Kanas, A. (2008). A Multivariate Analysis Regime Switching Approach to the Relation Between The Stock Market, The Interest rate dan Output.
International Journal of Theoritical and Applied Science. Vol. 11 (7). Pp. 657-671.
Kouser, R., & Saba, I.,(2012). Gauging the Financial Performance of Banking Sector Using CAMEL Model: Comparison of Conventional, Mixed and Pure Islamic Banks in Pakistan. International Research Journal of Finance and Economy. Vol. 82 (2). Pp. 67-88.
Laghari, K. M., Jalbani, A. A., & Rani, I. (2011). Comparative Analysis of NBP & MCB Performance Under CAMELS Model. Interdiciplinary Journal of Contemporary Research in Business. Vol. 3(1). Southern Cross University, New South Wales, Australia.
Nurazi, R & Evans, M. (2005). An Indonesian Study of the Use of CAMEL(S) Ratios as Predictors of BankFailure. Journal of Economic and Social Policy. Vol. 10. (1). Pp. 1-23.
Nurazi, R., Kananlua, S., K., & Usman, B. The Effect of Google Trend as Determinant of Return and Liquidity in Indonesian Stock Exchange. Jurnal Pengurusan. Vol. 45. Pp. 1-17.
Nurazi, R., Santi, F., Usman, B. (2015). Tunneling: Evidence from Indonesia Stock Exchange. Asian Academy of Management Journal of Accounting and Finance. Vol. 11 (2). Pp. 127-150.
Nurazi, R & Usman, B. (2015). Public Attention and Financial Information as Determinants of Firms Performance in the Telecommunication Sector.
Jurnal Keuangan dan Perbankan. Vol. 19 (2).Pp. 235-251.
Oktavilia, S. (2008). Deteksi Dini Krisis Perbankan Indonesia: Identifikasi Variabel Makro dengan Model Logit. JEJAK Journal of Economic and Policy
Vol. 1 (1). Pp. 50-62.
Sangmi, D. M. (2010).Analyzing Financial Performance of Commercial Banks in India: Applicationof CAMEL Model. Pakistan Journal Commercial Social Science. Vol. 4 (1). Pp. 10-55.
Ross. S. (1976). The Arbitrage Theory of Capital Asset Pricing. Journal of Economic Theory. Vol. 13. Pp.341-360.
Shanken, J., 1992. The Current State of the Arbitrage Pricing Theory. The Journal of Finance. Vol. 47(4). Pp. 1569-1574.
Sujarwo, A, A. (2015). The impact of Indonesia’s Bank
Performance towards Bank’s Stock Price (Listed in
Indonesia Stock Exchange from 2011-2013) Using CAMEL Analysis. iBuzz Management.Vol.3 No 2. Pp. 9-18.
Tandelilin, E. (2010). Portfolio and Investment “Theory
and Its Application”. Yogyakarta, Kanisius.
Indo-nesia.
Usman, B., & Tandelilin, E. (2014). Internet Search Traffic and Its Influence on Liquidity and Returns of Indonesia Stocks: An Empirical Study. Journal of Indonesian Economy and Business. Vol. 29(3). Pp. 203-221.
Verma, P., & Jackson, O. D. (2008). Interest Rate and Bank Stock Return Asymetry Evidence From US Banks. Journal Economics Finance. Vol. 32 (4). Pp. 105-118.
Widarjono, A. (2009). Introduction of Econometric and Its Application. Yogyakarta. Ekononisia. Faculty of Economic Islamic University of Indonesia.
Winarno, W. W. (2009). The Econometric Analysis and Its Application in E-views 5th edition. UPP. STIM YKPN. Indonesia.