Jejak Vol 10 (1) (2017): 62-79. DOI:http://dx.doi.org/10.15294/jejak.v10i1.9127
JEJAK
Journal of Economics and Policy
http://journal.unnes.ac.id/nju/index.php/jejak
Development Strategy 0f Local Food Diversification
Imelda1, Novira Kusrini2, Rakhmad Hidayat3
1,2,3Universitas Tanjungpura Pontianak, Indonesia
Permalink/DOI: http://dx.doi.org/10.15294/jejak.v10i1.9127
Received: July 2016; Accepted: September 2016; Published: March 2017
Abstract
The purpose of this research is to develop strategies that can be applied in the development of local food diversification in West Kalimantan. The data used are primary data and secondary data. Variables examined included internal factors (strengths and weaknesses) and external factors (opportunities and threats) in the development of local food diversification in West Kalimantan. Data analysis were conducted in qualitative descriptive to describe the pattern of food consumption in West Kalimantan and continued with a SWOT analysis to carry out the development strategy of the local food diversification in West Kalimantan. The analysis result showed that the strategy for the development of local food diversification in West Kalimantan is SO strategy (Strengths - Opportunities) those are: 1) the increase in synergy between the government and the micro, small and medium enterprises for the development of local food products, 2) the utilization of communications and market information system in improving the marketing of local food products on micro, small and medium enterprises, and 3) the utilization of unutilized agricultural land to improve the quality and quantity of local food products.
Key words : strategy development, food diversification, local food, West Kalimantan, SWOT analysis.
How to Cite: Imelda, I., Kusrini, N., & Hidayat, R. (2017). Development Strategy 0f Local Food Diversification.
JEJAK: Jurnal Ekonomi Dan Kebijakan, 10(1), 62-79. doi:http://dx.doi.org/10.15294/jejak.v10i1.9127
© 2017 Semarang State University. All rights reserved
Corresponding author :
Address: Jl. Prof. Dr. H. Hadari Nawawi, Pontianak Tenggara, Bansir Laut, West Kalimantan 78124
E-mail: [email protected]
JEJAK Journal of Economics and Policy Vol 10 (1) (2017): 62-79 63
INTRODUCTION
The effort to develop food
diversification is still one problem that must be addressed in order to improve the food security. This is indicated by the level of rice consumption of Indonesian society that ranks number one in the world, reaching 139 kg per capita per year. This number is very far when compared with other Asian countries like Korea that is only 60 kg per capita per year, Japan 50 kg per capita per year, Thailand 70 kg per capita per year, and Malaysia 80 kg per capita per year. The high level of consumption is because Indonesia still makes rice as a staple food. Mauludyani, et al. (2008) suggested that rice is a staple food that is the largest expenditure share of Indonesian society that equals to 14.9%. Ariani (1993) suggested several reasons for the selection of rice as a staple food as follows: better taste, more quickly and easily processed, and synonymous with high social status.
The population of Indonesia continues to increase at an average growth rate of 1.43% per year so that it has implication for the increase in food demand. A strategic move to meet the food demand is increasing productivity and seeking food diversification. Food diversification is one of the main pillars in achieving food security. Food consumption diversification is not only as an effort to reduce the dependence on rice but also as an effort to improve the nutrition improvement to get qualified and capable competitive people in the globalization era (Himagizi, 2009).
The implementation of local
diversification development must be
sustainable between people's food
preferences with local food resources in each area. Food Security Agency of the Ministry of Agriculture of Indonesia stated that Indonesia
has the potential of local food resources including 77 types of food sources of carbohydrates, 26 types of beans, 389 varieties of fruits, 228 kinds of vegetables, 40 types of fruit drinks, and 110 kinds of spices.
instant noodles with various prices, flavors, and types have been able to influence the consumers to consume. These changes have to be watched out because wheat is an imported commodity and not produced in Indonesia, so that in the future it will have an impact on wheat import dependency.
Local food diversification allows people to organize the consumption patterns that are not dependent on one source of food and may increase the local food consumption to be substitute or complementary food of rice to be the main menu so as to improve the household food security that will lead to the improvement in national food security. Food consumption diversification will also encourage the farmers to utilize the land with farm crops and other tubers. Thus, if one day there is harvest failure or a problem of distribution to certain food types, it will not affect the people's consumption patterns.
Food diversification program should be directed to increase the availability of food commodities through the utilization of natural resources and development of various local processed food so that it can support the diversification of local food as a whole. The successful implementation of local food diversification requires a strong strategy and commitment from the government, farmers, employers, and society. The role of farmers, government agencies, private sector, academics, and stakeholders is required to support the agricultural development based on local food resources and community support as a determinant of successful implementation of local food diversification (Sumastuti, 2010). This paper aims to describe the situation of the availability and food consumption of the people in West Kalimantan and continues with a SWOT
analysis to develop a development strategy of local food diversification in West Kalimantan.
RESEARCH METHODS
The research focuses on the study of the development of local food diversification in the region of West Kalimantan. The data collected in this research is in the form of secondary data and primary data. Primary data is the direct interview result data with the key informants in performing the weighting and rating of variables of strengths, weaknesses, opportunities and threats as the effort to develop the local food diversification in West Kalimantan. The sampling technique uses purposive sampling based on the consideration of the respondent expertise or judgmental sampling (Sekaran and Roger, 2010). The respondents of research are 35 people representing the government (the Food Security and Extension Agency of West Kalimantan Province, Department of Agriculture and Horticulture in West Kalimantan), and the academics.
Secondary data is the compliance data sourced from various agencies such as the Central Bureau of Statistics of West Kalimantan, Food Security Agency of West Kalimantan, and some journals and literature. Secondary data contains the people’s food consumption of West Kalimantan in 2009-2014 and the food pattern score of people’s expectations of West Kalimantan in 2014. The food consumption data is differentiated based on the urban and rural areas so that it can describe the different characteristics of the food consumption of each region.
JEJAK Journal of Economics and Policy Vol 10 (1) (2017): 62-79 65
in West Kalimantan. SWOT Analysis is based on the logic that maximizes the strengths and opportunities, but simultaneously can minimize the weaknesses and threats. Data variables are collected through literature searches and interviews with the key informants to obtain the variables of strengths, weaknesses, opportunities and threats in the development of local food diversification.
Stages in the SWOT analysis are as follows: data collection, analysis, and decision-making. At the stage of data collection, the data obtained can be divided into two: the external data (opportunities and threats) and internal data (strengths and weaknesses). The model used in this stage consists of External Strategic Factor Matrix and Internal Strategic Factor Matrix as shown at table 1 and 2. The weighting to each factor in Table 1 and 2 at column 2 ranges from 1.0 (extremely important) to with a 0.0 (extremely unimportant). The amount/total score of all weights must be 1.00 (100%). The values implicitly show the percentage number of importance rate of these factors relative to other factors. Larger number means that the factor is relatively more important than any other factor.
Table 1. Analysis of Internal Factor Internal
Strategic Factors
Weights Rating Score
(Weight x
The rating at column 3 for each factor uses a scale ranging from 4 (very high) to 1 (very low) based on the influence of these factors on the development of local food diversification. The rating for the factors of strengths and opportunities are positive (great strength and opportunity have rating 4, whereas small strength and opportunity have rating 1). The rating for weaknesses and threats are just the opposite, that is, great weakness and threat have rating 1 and small weakness and threat have rating 4. The column of weighting score multiplied rating equals weighting score at column 4 which value varies from 4.0 to 1, 0. Add the weighting score (at column 4) to obtain the total weighting score. This value is to map the position in the diagram of SWOT analysis.
Table 2. Analysis of External Factor External
Strategic Factors
opportunities, 3) S-T Strategy aims to use the internal strengths to avoid or reduce the impact of external threats, and 4) W-T Strategy aims to reduce the internal weaknesses by avoiding the external threats.
RESULTS AND DISCUSSION
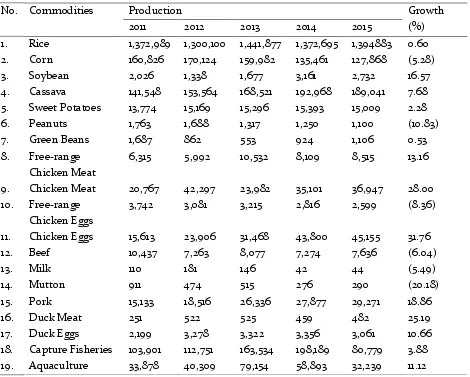
Developments in food availability in West Kalimantan through the local production approach can be seen in Table 6. It can be seen that most of the vegetable food commodities show the positive average growth of production per year at the
commodities of rice, soybean, cassava, sweet potatoes and green beans, while for the corn and groundnut the average growth of production per year is negative.
The development of commodity
production of animal food in West Kalimantan in 2011-2015 showed a less stable condition, which is seen from the quite high increase and decrease of production in some commodities, but the majority of animal food commodities have a positive average growth of production per year except for the free-range chicken eggs, beef, dairy milk, and mutton.
Table 3. Development of Local Food Production in West Kalimantan in 2011-2015
No. Commodities Production Growth
(%)
2011 2012 2013 2014 2015
1. Rice 1,372,989 1,300,100 1,441,877 1,372,695 1,394883 0.60
2. Corn 160,826 170,124 159,982 135,461 127,868 (5.28)
3. Soybean 2,026 1,338 1,677 3,161 2,732 16.57
4. Cassava 141,548 153,564 168,521 192,968 189,041 7.68
5. Sweet Potatoes 13,774 15,169 15,296 15,393 15,009 2.28
6. Peanuts 1,763 1,688 1,317 1,250 1,100 (10.83)
7. Green Beans 1,687 862 553 924 1,106 0.53
8. Free-range Chicken Meat
6,315 5,992 10,532 8,109 8,515 13.16
9. Chicken Meat 20,767 42,297 23,982 35,101 36,947 28.00
10. Free-range Chicken Eggs
3,742 3,081 3,215 2,816 2,599 (8.36)
11. Chicken Eggs 15,613 23,906 31,468 43,800 45,155 31.76
12. Beef 10,437 7,263 8,077 7,274 7,636 (6.04)
13. Milk 110 181 146 42 44 (5.49)
14. Mutton 911 474 515 276 290 (20.18)
15. Pork 15,133 18,516 26,336 27,877 29,271 18.86
16. Duck Meat 251 522 525 459 482 25.19
17. Duck Eggs 2,199 3,278 3,322 3,356 3,061 10.66
18. Capture Fisheries 103,901 112,751 163,534 198,189 80,779 3.88
19. Aquaculture 33,878 40,309 79,154 58,893 32,239 11.12
JEJAK Journal of Economics and Policy Vol 10 (1) (2017): 62-79 67
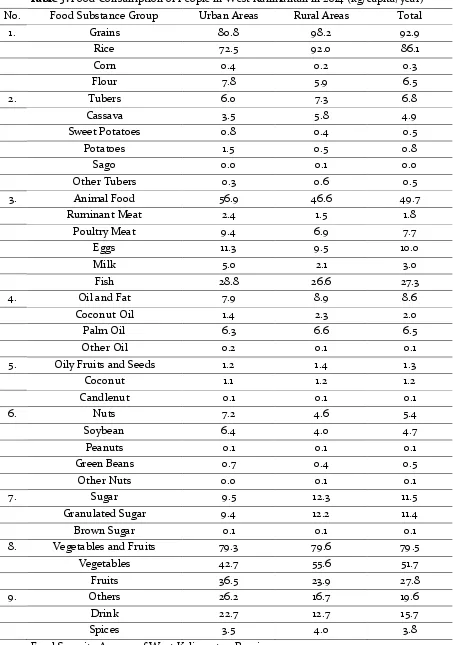
Table 4. Food Consumption of People in West Kalimantan in 2009-2014 (kg/capita/year)
No. Food Substance Group 2009 2010 2011 2012 2013 2014
1. Grains
Rice 110.7 95.3 92.4 89.0 87.7 86.1
Corn 0.4 0.3 0.6 0.2 0.4 0.3
Wheat 7.1 6.1 7.3 6.7 6.9 6.5
2. Tubers
Cassava 8.2 7.7 9.7 6.1 6.0 4.9
Sweet Potatoes 0.5 0.8 1.5 0.8 0.7 0.5
Potatoes 0.7 0.7 0.7 0.5 0.5 0.8
Sago 0.0 0.0 0.0 0.0 0.0 0.0
Other Tubers 0.7 0.7 1.1 0.5 0.5 0.5
3. Animal Food
Ruminant Meat 1.3 1.6 2.2 2.9 2.4 1.8
Poultry 4.5 6.0 6.8 5.9 6.3 7.7
Eggs 7.5 9.0 10.1 9.1 10.9 10.0
Milk 2.0 2.6 2.7 2.1 2.4 3.0
Fish 2.11 27.7 30.9 27.9 29.3 27.3
4. Oil and Fat
Coconut Oil 2.2 2.2 2.7 3.1 2.3 2.0
Palm Oil 5.0 5.3 5.3 5.5 5.6 6.5
Other Oil 0.1 0.2 0.1 0.1 0.1 0.1
5. Oily Fruits/Seeds
Coconut 1.5 2.4 1.8 1.6 1.0 1.2
Candlenut 0.1 0.1 0.2 0.1 0.1 0.1
6. Nuts
Soybean 3.2 4.4 5.3 4.2 4.3 4.7
Peanuts 0.3 0.3 0.3 0.2 0.2 0.1
Green Beans 0.5 0.6 0.6 0.2 0.3 0.5
Other Nuts 0.0 0.0 0.0 0.1 0.1 0.1
7. Sugar
Granulated Sugar 12.6 13.4 14.0 12.5 13.1 11.4
Brown Sugar 0.2 0.1 0.2 0.0 0.0 0.1
8. Vegetables and Fruits
Vegetables 46.0 59.1 55.1 52.7 53.3 51.7
Fruits 21.2 31.5 27.0 21.5 26.2 27.8
9. Others
Drink 15.0 15.1 17.8 16.5 18.7 15.7
Spice 4.3 3.5 3.8 3.7 4.8 3.8
The development of fishery commodity production in West Kalimantan in 2011-2015 showed a condition that tends to increase every year, either for the commodities of capture fisheries or aquaculture.
Data of food consumption development in West Kalimantan in 2009-2014 can be seen in Table 4 above. Table 4 shows that rice is the main staple food for the people in West Kalimantan and the local food consumption such as corn and other tubers (corn, cassava and sweet potatoes) continues to decline over the last six years. This is in line with the research of Hardono (2014), who stated that nationally there has been a shift in the pattern of staple food from corn and tubers to the national staple food (rice). Other food types such as animal food (except poultry), oil and fat (except palm oil), oily fruits and seeds, nuts, sugar, vegetables and fruits and others also experienced a decline in consumption. It is only the poultry meat and palm oil that have increased in the period 2009-2014.
If examined based on the urban and rural areas (Table 5), food consumption in West Kalimantan in 2014 in rural areas was higher than urban areas for the types of food of rice, cassava, oil and fat, oily fruits and seeds, sugar, and vegetables. The high level of consumption of vegetables in rural areas is because this type of food is easily available in rural locations either from the farm or purchase (Damora, et al., 2008).
The level of food consumption is strongly associated with household income (Yimer, 2011) and (Kostakis, 2012). Berg (1996) stated that families with higher income levels can afford to buy food with more variety and more number when compared to low-income families. Soekirman (2002) also stated that if the average income of households increased it leads to improved food quality.
Food consumption for flour, sweet potato, potato, animal food (ruminant meat, poultry, eggs, dairy and fish), soybeans, green beans, fruit and drinks in urban areas is higher than in rural areas. The high consumption of animal food in urban areas is supported by the opinion of Erwidodo, et al. (1998), which stated that the purchasing power of the animal food is limited because of limited income. Urban people with relative higher income levels in general can buy this type of food animal with more quantity. Nur et al. (2012) also stated that the beef commodity is more elastic to the price changes, which means that during this time the beef is still considered a luxury food items and only consumed by the upper middle-income people. Junaidi (2005) also stated that the participation rate of consuming various types of eggs is higher in urban areas than in rural areas and will continue to increase in line with the increased revenue.
Measurements of food consumption pattern from the food quality aspects also need to be considered through the approach of Expectancy Dietary Pattern score (PPH). The expectancy dietary pattern is a guideline for various food compositions that is able to provide the energy and nutrients needed by the average population with sufficient quantities and balance and provide good quality food.
JEJAK Journal of Economics and Policy Vol 10 (1) (2017): 62-79 69
Table 5. Food Consumption of People in West Kalimantan in 2014 (kg/capita/year)
No. Food Substance Group Urban Areas Rural Areas Total
1. Grains 80.8 98.2 92.9
Rice 72.5 92.0 86.1
Corn 0.4 0.2 0.3
Flour 7.8 5.9 6.5
2. Tubers 6.0 7.3 6.8
Cassava 3.5 5.8 4.9
Sweet Potatoes 0.8 0.4 0.5
Potatoes 1.5 0.5 0.8
Sago 0.0 0.1 0.0
Other Tubers 0.3 0.6 0.5
3. Animal Food 56.9 46.6 49.7
Ruminant Meat 2.4 1.5 1.8
Poultry Meat 9.4 6.9 7.7
Eggs 11.3 9.5 10.0
Milk 5.0 2.1 3.0
Fish 28.8 26.6 27.3
4. Oil and Fat 7.9 8.9 8.6
Coconut Oil 1.4 2.3 2.0
Palm Oil 6.3 6.6 6.5
Other Oil 0.2 0.1 0.1
5. Oily Fruits and Seeds 1.2 1.4 1.3
Coconut 1.1 1.2 1.2
Candlenut 0.1 0.1 0.1
6. Nuts 7.2 4.6 5.4
Soybean 6.4 4.0 4.7
Peanuts 0.1 0.1 0.1
Green Beans 0.7 0.4 0.5
Other Nuts 0.0 0.1 0.1
7. Sugar 9.5 12.3 11.5
Granulated Sugar 9.4 12.2 11.4
Brown Sugar 0.1 0.1 0.1
8. Vegetables and Fruits 79.3 79.6 79.5
Vegetables 42.7 55.6 51.7
Fruits 36.5 23.9 27.8
9. Others 26.2 16.7 19.6
Drink 22.7 12.7 15.7
Spices 3.5 4.0 3.8
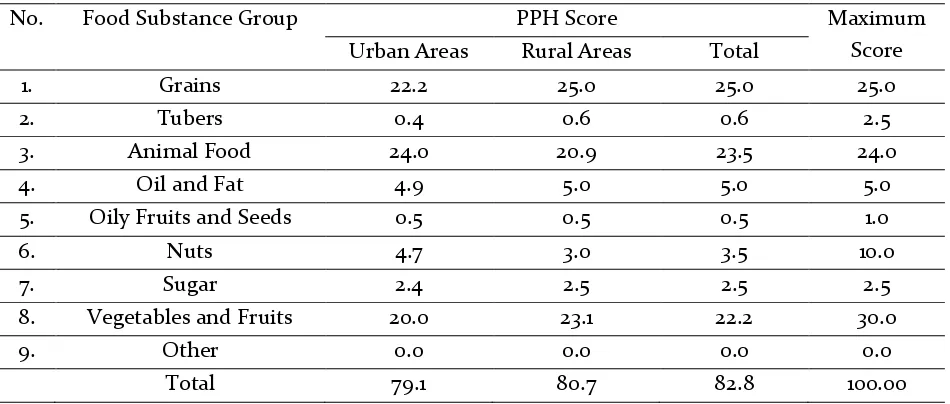
Table 6 shows that the total score of PPH of people in West Kalimantan in the urban and rural areas is still under the ideal PPH score. The PPH score in the urban areas is 79.1 in the rural areas is 80.7. The PPH score under the maximum score indicates that the food consumption in West Kalimantan tends to be not various and has still low quality of food consumed. This is because people in West Kalimantan only consume food from one group of food that is grains. Other food groups such as the tubers are consumed by the people only as a food supplement or a mixture of side dishes and vegetables.
A research of Zhang et al. (2008) in rural and urban areas of Guangxi, China also showed that the PPH score in 1992 to 1999 are above 70. The high and low value score of PPH depends on the achievement of the contribution of each food group.
Based on the PPH score of food groups in Table 6, it is noted that the highest total score of PPH should be in the grains (score 25) and has already reached the maximum score. This is consistent with a research on food consumption patterns in Indonesia, South Sulawesi and West Lampung, which has been done by Anwar and Hardinsyah (2014), Kandiana et al. (2009) and Nurindrawati et al. (2008).
Groups of animal food, vegetables and fruits also make a major contribution to the score of PPH. Although the total proportion of grains, animal food, also vegetables and fruits has contributed to the PPH score actually over 50%, but of the whole, no group has reached the ideal score of PPH so it needs improvement in quantity and quality of food consumption at the households by taking into account at the maximum limit which in turn can help increase the actual PPH score.
Table 6. Score of Expectancy Dietary Pattern of People in West Kalimantan Based on Areas in 2014
No. Food Substance Group PPH Score Maximum
Score
Urban Areas Rural Areas Total
1. Grains 22.2 25.0 25.0 25.0
2. Tubers 0.4 0.6 0.6 2.5
3. Animal Food 24.0 20.9 23.5 24.0
4. Oil and Fat 4.9 5.0 5.0 5.0
5. Oily Fruits and Seeds 0.5 0.5 0.5 1.0
6. Nuts 4.7 3.0 3.5 10.0
7. Sugar 2.4 2.5 2.5 2.5
8. Vegetables and Fruits 20.0 23.1 22.2 30.0
9. Other 0.0 0.0 0.0 0.0
Total 79.1 80.7 82.8 100.00
JEJAK Journal of Economics and Policy Vol 10 (1) (2017): 62-79 71
Table 7. Internal Strategic Factor of Development of Local Food Diversification in West Kalimantan
No. Internal Factor Weight Rating Weighted
Value (Weight x Rating) Strengths
1. Diversity of specific local food types in West Kalimantan
0.109 4 0.436
2. Increase in local food production in West Kalimantan
0.088 3 0.264
3. Increase in number of Micro, Small, and Medium Enterprises moving in local
food processing unit
0.106 3 0.318
4. Availability of unutilized potential agricultural land
0.088 3 0.264
5. High awareness of people of health 0.098 4 0.392
Total 0.490 1.674
Weaknesses 1. Many functional shift of agricultural
land
0.106 1 0.106
2. People’s food preference is still focused
on rice and un-optimal utilization of local food for daily food consumption
0.111 2 0.222
3. Percentage of poor population is high enough
0.096 2 0.192
4. Limitation of local food production promotion
0.101 2 0.202
5. Score of PPH in West Kalimantan is still under maximum
0.096 1 0.096
Total 0.510 0.818
Total of Weighted Value 1.000
Source: primary data, processed, 2016.
Development Strategy of Local Food Diversification
Analysis to determine the development strategy of diversification is done with SWOT Analysis (Strength, Weakness, Opportunity and Threat). SWOT analysis process involves determining the specific objectives in the development of local food diversification and identifying the internal and external factors that support and do not support the
Table 7 shows the internal strategic factor in the development of local food diversification in West Kalimantan. Results of
interviews and questionnaires with
respondents obtained the internal and external factors (strengths, weaknesses, opportunities and threats). Internal strengths in the development of local food diversification in West Kalimantan include: 1. The diversity of types of specific local food
in West Kalimantan. This variable is the main strength in the development of local food diversification with the highest weighted value of 0.436. Local food sources in West Kalimantan are rice, corn, soybean, cassava, livestock, plantations and fisheries. Ketapang Regency and Pontianak City are the largest suppliers of
beef in West Kalimantan. West
West Kalimantan. Data of development of local food production in West Kalimantan in 2011-2015 showed that most food commodities experienced a positive average growth of production per year (Table 6). If viewed based on the balance sheet for the availability of production and consumption of food in West Kalimantan in 2015, there was a surplus of some food commodities such as rice, corn, cassava, sweet potatoes, peanuts and green beans (the Food Security and Extension Agency, West Kalimantan Province, 2015). Category of surplus occurs when the value of the food availability is beyond the needs of food consumption of people in the region. 3. The increase in the number of MSMEs (Micro, Small and Medium Enterprises)
that is engaged in the processing of local food.
4. The availability of unutilized potential agricultural land especially prioritized for food crops. Regencies of Sambas, Kubu Raya, and Landak are the potential areas for expansion of food crops. According to the statistic data in 2014, West Kalimantan has the area of 14,680,700 ha consisting of 10,804,868 ha (73.60%) of cultivated areas and 3,875,832 ha of non-cultivated areas (26.40%). The availability of land for
agriculture in West Kalimantan
amounting to 1,116,459 ha (186,270 ha of paddy fields and 930 189 ha of non-paddy fields), the availability of 14,211,270 ha of dry land, the availability of 1,271,986 ha (8.66%) of critical land, and availability of peatlands of 1,677,550 ha (11.43%)
5. The high awareness of people about health. The needs of people today are more oriented to food that has a good nutritional composition, appearance and taste of interest, and also has a physiological function for health.
The internal weaknesses in the development of local food diversification in West Kalimantan include:
1. Many of agricultural land conversion. Irawan (2005) stated that the agricultural land conversion occurs because of the competition in land utilization between agriculture and non-agricultural sectors. Suprajaka and Fitria (2012) stated that the conversion of agricultural land generally occurs in the fertile agricultural land that has good irrigation channels. If allowed to continue, it will disrupt the development of local food diversification.
JEJAK Journal of Economics and Policy Vol 10 (1) (2017): 62-79 73
variable is the main weakness in the development of local food diversification with the highest weighted value of 0.222. 3. The percentage of poor people is still quite
high. The number of poor people in West Kalimantan in March 2015 is around 383,700 people (8.03%) or increased to be 0.47% (1,790 people) compared to maximum score, which amounted to 82.8 (2014).
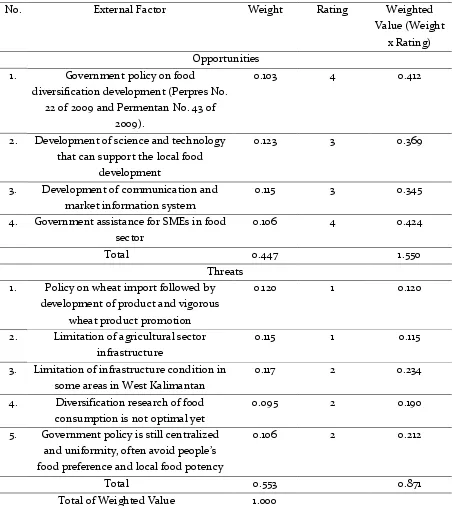
Table 8 shows the external strategic factors in the development of local food diversification in West Kalimantan, which are the external opportunities in developing the local food diversification in West Kalimantan. The strategy presents some operational steps in developing the local food diversification.
The government policy in increasing the food diversification (Presidential Decree No. 22 of 2009 on Policy on Food Consumption Diversification Acceleration Based on Local Resources and acted upon by the Minister of Agriculture (Permentan) No. 43 of 2009 on
Food Consumption Diversification
Acceleration Movement (P2KP) Based on Local Resources with a weighted value of 0.412. Some activities that have been undertaken by the government of West Kalimantan Province related to the development of food security including the Food Estate Area, the Development of Cultivation Method, Field School, Help Direct Superior Seed (BLBU), Optimization of
Artificial Insemination Service or
Introductions of Excellent Stud, Area Development of Integrated Ranch with Food Crops/ Plantation, Optimizing Utilization of Agricultural Infrastructures, Acceleration of
Increased Productivity, Seed Development,
Food Production Safety, Handling
Optimization of Harvest, Post-Harvest and Marketing, and also UPSUS PAJALE (Special Effort on Rice, Corn and Soybean).
Further is the effort of developing science and technology to support the development of local foo, followed by the efforts to improve communication and market information systems. And last is the effort of government assistance for SMEs food sector. The external threat in developing the local food diversification in West Kalimantan includes the following. First, the policy of wheat import with product development and promotion of wheat products aggressively. Indonesia is the second largest wheat importer in the world after Egypt, with the import value in 2016 was estimated at 8.10 million tons, up about 8% from the previous year. The increase in the import value is associated with the increased consumption of wheat in Indonesia. In 2012-2013, the Indonesian wheat consumption amounted to 6.95 million tons, in 2013 to 2014 increased to 7.16 million tons and in 2014 to 2015 increased to 7.36 tons (Listiyarini, 2016).
Second, the limitation of agricultural sector infrastructure, such as the limitation of water infrastructure (dams and irrigation channels), the limitation of animal feed raw material so that the animal feed in West Kalimantan are still imported from Makassar and Surabaya.
Fourth, the limitations of infrastructure conditions in some areas in West Kalimantan. This variable is a variable with the main external threats with the weighted value of 0.234. Data of condition of infrastructure (road length) in West Kalimantan in 2015
amounted to 15,111.32 km consisting of roads in good condition at 12,080.14 km and damaged roads at 6,258.03 km (CBS, 2015). Most roads in damaged condition is a connecting road between cities / regencies in West Kalimantan.
Table 8. External Strategic Factor of Development of Local Food Diversification in West Kalimantan
No. External Factor Weight Rating Weighted
Value (Weight x Rating) Opportunities
1. Government policy on food
diversification development (Perpres No. 22 of 2009 and Permentan No. 43 of
2009).
0.103 4 0.412
2. Development of science and technology that can support the local food
development
0.123 3 0.369
3. Development of communication and market information system
0.115 3 0.345
4. Government assistance for SMEs in food sector
0.106 4 0.424
Total 0.447 1.550
Threats 1. Policy on wheat import followed by
development of product and vigorous wheat product promotion
0.120 1 0.120
2. Limitation of agricultural sector infrastructure
0.115 1 0.115
3. Limitation of infrastructure condition in some areas in West Kalimantan
0.117 2 0.234
4. Diversification research of food consumption is not optimal yet
0.095 2 0.190
5. Government policy is still centralized and uniformity, often avoid people’s food preference and local food potency
0.106 2 0.212
Total 0.553 0.871
Total of Weighted Value 1.000
JEJAK Journal of Economics and Policy Vol 10 (1) (2017): 62-79 75
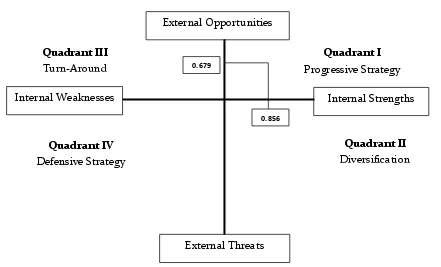
Internal Strengths Internal Weaknesses
External Threats External Opportunities The score value of each internal and
external factor on the development of local food diversification may specify the position in the SWOT matrix. This is conducted by reducing the total of weighted value between the internal factors (variables of strengths and weaknesses) and the external factors (variables of opportunities and threats), as
shown in Table 9.
Table 8 shows the value of X> 0 (strength is greater than weakness of 0.856) and the value of Y> 0 (opportunity is greater than threat of 0.679). The position of coordinates of the development of local food diversification in West Kalimantan can be seen in Cartesian coordinates as figure 1 below.
Table 9. Score Value of Internal and External Factors of Development of Local Food Diversification
Criteria Score Coordinate
Internal Factor
Strengths 1.674
Weaknesses 0.818 0.856
External Factor
Opportunities 1.550
Threats 0.871 0.679
Source: primary data, processed, 2016.
Source: primary data, processed, 2016. Figure 1. SWOT Position Matrix .
0.679
0.856
Quadrant I Progressive Strategy Quadrant III
Turn-Around
Quadrant IV Defensive Strategy
Based on the SWOT position matrix, the development of local food diversification in West Kalimantan is in quadrant I (progressive strategy), which means to be in a favorable situation and has the opportunity to be developed because the opportunity is greater than the threat that must be faced. In addition, the strength is also so great that there are opportunities that can be utilized to the maximum.
Progressive strategy focuses on S-O strategy (Strengths - Opportunities), which is to take advantage of strengths and opportunities for developing the local food diversification in West Kalimantan. This is in line with the research of Hardono (2014) who stated that the map of the potential success of the development of diversification in Indonesia is in quadrant I (S-O strategies).
S-O Strategy (Strengths-Opportunities) in the development of local food diversification in West Kalimantan includes the following. First, the increased synergy between the government and sector players
MSMEs (Micro, Small and Medium
Enterprises) for the development of local food products. This is in line with the opinion of Martianto, et al. (2009) who stated that the increase in the commitment and the role of inter-governmental and stakeholders are the key priority in achieving the local food diversification in an area. Rachman and Ariani (2008) also stated that the role of government is needed to facilitate the diversification and
the food consumption through the
development of technology and the local food industry.
Second, the utilization of
communication and market information systems in improving the marketing of local food products of MSMEs (Micro, Small and Medium Enterprises) sector. The conditions
of MSMEs West Kalimantan still have limitations in terms of implementation of management, limited access to information, limited application of technology, and narrowness of the market circle. Jauhari (2010) stated that one of the obstacles in the development of small and medium enterprises (SMEs) is the limited market access. One way to overcome that is by improving the market information systems, for example, utilizing the e-commerce service.
Third, the utilization of unutilized potential agricultural land to improve the quality and quantity of local food products. This can be done by utilizing the wastelands that have been released, the land reserves and the potential suboptimal land such as wetlands and tidal swamp (Mulyani, et al., 2011). Besides, it is also necessary to perform the coaching and intensive assistance in the land treatment, planting, maintenance, harvesting and post-harvest by applying the location specific technology innovation.
S-T Strategy (Strengths-Threats) in the development of local food diversification in West Kalimantan includes the following. First, the increased diversification of local food products at affordable prices and quality is to reduce the domestic consumption of wheat products. For example, by developing the flour processed products sourced from a variety of tubers, sago, bananas, breadfruit, pumpkin as the substitute alternative for rice and wheat.
JEJAK Journal of Economics and Policy Vol 10 (1) (2017): 62-79 77
dependent on the presence of the consumer, the availability of raw materials and the supporting infrastructure such as transport, electricity, water and others.
Third, the development of
infrastructure to build the integration between the food supply source and its distribution by developing the local food production centers.
W-O Strategies
(Weaknesses-Opportunities) in the development of local food diversification in West Kalimantan includes the following. First, the utilization of science and technology to enhance the promotion of local food products and optimize the utilization of local food for daily food consumption. The introduction and promotion can be done by through counseling, training and assistance so that it can increase public awareness of the potential local food available to meet the nutritional needs.
Second, the continuity of local food supply on the market at an affordable price and it is easy to obtain. These aspects are important and urgent considering that this instrument will contribute to establish the market price.
Third, the accelerating of
implementation of government policy to reduce the conversion of agricultural land. Mahbubi (2013) stated that in the food period, the national food security would be affected if the government does not stop the conversion of agricultural land. One way to avoid the conversion of agricultural lands is through the sub-optimal land utilization for non-food commodities (Las and Mulyani, 2009).
W-T Strategy (Weaknesses-Threats) in the development of local food diversification in West Kalimantan includes the following. First, the increase in the availability of facilities and infrastructure of the agricultural
sector to ensure the food security and the local food production.
Second, the increased transport facilities and infrastructure for the smooth distribution of the means of production and the production of local food. The availability of staple food is strongly influenced by the smooth distribution of food to the whole area in West Kalimantan, for example for the meat, eggs and cooking oil that are only produced by certain areas and also the sugar that is imported from outside the region of
West Kalimantan. The condition of
infrastructure, especially roads in several regencies in West Kalimantan mostly need treatment as soon as possible.
Third, the development of research related to the local food diversification in accordance with people's food preferences and the potential for local food. This is in line with the opinion of Martianto, et al. (2009) who stated that the role of researcher could be done in the form of research and writing publications related to the potential and nutritional value of local foods.
Fourth, increasing the effectiveness of coordination of government agencies at the central and regions related to the local food diversification so as to ensure the integration of policies, programs, and activities among the central and local sectors. This can be done through the development of networks of cooperation between the municipality/ regency or sub-district/ village which regions have a surplus or a deficit that could encourage the smooth distribution of food from the surplus to the deficit areas.
Fifth, facilitating and guaranting the smooth supply of production of facilities and infrastructure, especially seeds/ seedlings and fertilizers.
CONCLUSION
of production per year those are on the commodities of paddy, soybean, cassava, sweet potato, green beans, free-range chicken meat, chicken, eggs, pork, duck meat, duck eggs, fisheries and aquaculture.
West Kalimantan food consumption in rural areas is higher than in urban areas for the types of food of rice, cassava, oil and fat, oily fruits and seeds, sugar, and vegetables. Food consumption for wheat, sweet potato, potato, animal food (ruminant meat, poultry, eggs, milk, and fish), soybeans, green beans, fruit and drinks in urban areas is higher than in rural areas. Total score of PPH of communities in West Kalimantan in urban and rural areas is still under the ideal PPH
score, which means that the food
consumption of people in West Kalimantan tends to be non-differentiated and the quality of food consumed is still low.
Based on the position of the SWOT matrix, developing the local food diversification in West Kalimantan is in region I (Progressive strategy), which means to be in a favorable situation and have a chance to develop. Progressive Strategy focuses on S-O strategy (Strengths-Opportunities) that include: 1) the increased synergy between the government and sector players of MSMEs (Micro, Small and Medium Enterprises) for the development of local food products, 2) the utilization of communication and market information systems in improving the marketing of local food products of the
MSMEs (Micro, Small and Medium
Enterprises) sector, and 3) the utilization of unutilized agricultural land to improve the quality and quantity of the local food products.
REFERENCES
Anwar dan Hardinsyah. (2014). Konsumsi Pangan dan Gizi serta Skor Pola Pangan Harapan pada Dewasa Usia 19-49 Tahun di Indonesia. Jurnal Gizi dan Pangan, 9(1), 51-58.
Ariani M. (1993). Kajian Pola Konsumsi dan Permintaan Pangan Serta Proyeksi Kebutuhan Pangan pada Repelita VI di Tiga Provinsi di Indonesia.
Unpublished Thesis. Post-Graduate Programme.
Bogor : IPB.
Ariani, M., Hermanto, Hardono, Sugiarto dan Wahyudi. (2013). Kajian Strategi Pengembangan Diversifikasi Pangan Lokal. Laporan Kegiatan Kajian Isu-Isu Aktual Kebijakan Pembangunan Pertanian. Pusat Sosial Ekonomi dan Kebijakan Pertanian. Bogor. Badan Ketahanan Pangan dan Penyuluhan Provinsi
Kalimantan Barat. (2015). Situasi Ketersediaan
Pangan di Provinsi Kalimantan Barat tahun 2015.
Pontianak.
Badan Pusat Statistik Kalimantan Barat. (2015). Berita Resmi Statistik Provinsi Kalimantan Barat No. 54/09/61/Th.
XVIII, 15 September 2015. Pontianak.
Berg A. (1986). Peranan Gizi dalam Pembangunan Nasional
(Terjemahan). Jakarta: PT Rajawali.
Damora, Anwar dan Heryatno. (2008). Pola Konsumsi Pangan Rumah Tangga Petanu Hutan Kemasyarakatan di Kabupaten Lampung Barat.
Jurnal Gizi Pangan, 3(3), 227-232.
David, Freed R. (2007). Strategic Management, Concept and
Cases. New Jersey : Pearson Education, Inc.
Erwiddo, B. Santoso, M. Ariani, E. Ariningsih, dan V. Siagian. (1998). Perubahan Pola Konsumsi Sumber Protein Hewani di Indonesia: Analisis Data Susenas.
Laporan Hasil Penelitian. Pusat Penelitian Sosial
Ekonomi Pertanian, Bogor.
Hardiansyah dan Amalia. (2007). Perkembangan Konsumsi Terigu dan Pangan Olahannya di Indonesia 1993 – 2005. Jurnal Gizi dan Pangan, 2(1), 8-15.
Hardinsyah. (2007). Review Faktor Determinan Keragaman Konsumsi Pangan. Jurnal Gizi dan Pangan, 2(2), 55-74.
Hardono, Gatoet. (2014). Strategi Pengembangan Diversifikasi Pangan Lokal. Jurnal Analisis Kebijakan Pertanian, 12(1), 1-17.
Irawan. (2005). Konversi Lahan Sawah: Potensi Dampak, Pola Pemanfaatannya dan Faktor Determinan.
JEJAK Journal of Economics and Policy Vol 10 (1) (2017): 62-79 79
Jauhari, Jaidan (2010). Upaya Pengembangan Usaha Kecil dan Menengah (UKM) dengan Memanfaatkan E-Commerce, Jurnal Sistem Informasi, 2(1), 159-168.
Junaedi, (2005). Dinamika Pola Konsumsi Telur di Indonesia: Suatu Analisis Data Susenas.
Unpublished Thesis. Program Pasca Sarjana.
Bogor : IPB.
Kandiana, Nurdiani dan Tanziha. (2009). Analisis Situasi Pangan dan Gizi Provinsi Sulawesi Selatan Tahun 2005 dan 2007. Jurnal Ilmiah Agropolitan, 2(1). 128-135.
Kostakis, Ioannis. (2012). The Determinants of
Households’ Food Consumption In Greece. International Journal of Food and Agricultural
Economics. 2(2), 17-28.
Las dan Mulyani. (2009). Sumber Daya Lahan Potensial Tersedia untuk Mendukung Ketahanan Pangan dan Energi. Prosiding Semiloka Nasional Strategi Penanganan Krisis Sumber Daya Lahan untuk Mendukung Kedaulatan Pangan dan Energi. Fakultas Pertanian Bogor. 64-74.
Listiyarini, T. (2016). Naik ke Peringkat Dua Dunia, Impor Gandum Capai 8,1 Juta Ton. Available at: http://www.beritasatu.com/ekonomi/337466- naik-ke-peringkat-dua-dunia-impor-gandum-ri-capai-81-juta-ton.html. Diunduh pada 7 Agustus 2016.
Mahbubu, Akhmad. (2013). Model Dinamis Supply Chain Beras Berkelanjutan dalam Upaya Ketahanan Pangan Nasional. Jurnal Manajemen dan Agribisnis, 10(2), 81-89.
Martianto, Briawan, dan Yulianis. (2009). Percepatan Diversifikasi Konsumsi Pangan Berbasis Pangan Lokal: Perspektif Pejabat Daerah dan Strategi Pencapaiannya. Jurnal Gizi dan Pangan, 4(3), 123-131.
Mauludyani, Martianto dan Baliwati. (2008). Pola Konsumsi dan Permintaan Pangan Pokok Berdasarkan Analisis Data SUSENAS 2005. Jurnal Gizi dan Pangan, 3(2), 101-117.
Mulyani, Ritung dan Las. (2011). Potensi dan Ketersediaan Sumber Daya Lahan untuk Mendukung Ketahanan Pangan. Jurnal Litbang Pertanian, 30(2), 73-80.
Nurindrawati, Marliyati dan Heryatno. (2008). Analisis Pola dan Strategi Penyediaan Pangan Rumah Tangga Petani Hutan Kemasyarakatan Kabupaten Lampung Barat. Jurnal Gizi dan
Pangan, 3(3), 192-197.
Prasetyo, Hardinsyah, Sinaga. (2013). Konsumsi Pangan dan Gizi serta Skor Pola Pangan Harapan (PPH) Pada Anak Usia 2-6 Tahun di Indonesia. Jurnal Gizi dan
Pangan, 8(3), 159-166.
Rachman H. dan Ariani M. (2008). Penganekaragaman Konsumsi Pangan di Indonesia: Permasalahan dan Implikasi Untuk Kebijakan dan Program. Jurnal
Analisis Kebijakan Pertanian, 6(2), 140-154.
Rangkuti, F. (2006). Analisis SWOT : Teknik Membedah
Kasus Bisnis. Jakarta : Penerbit PT Gramedia Pustaka
Utama.
Sekaran dan Roger. (2010). Research Methods for Business: A Skill Building Approach. New Jersey: John Wiley & Sons.
Soekirman, (2002). Perlu Paradigma Baru Untuk Menanggulangi Masalah Gizi Makro di Indonesia
2002. Available at
http://www.gizi.net/profsoekirman.pdf. Diunduh pada 27 November 2015.
Steyn, Nel, Nantel, Kennedy dan Labadarios. (2006). Food Variety and Dietary Diversity Scores in Children: are they Good Indicators of Dietary Adequacy? Public
Health Nutrition, 9(5), 644-650.
Sumastuti, Efriyani. (2010). Jiwa Entrepreneurship untuk Mewujudkan Ketahanan Pangan. Jurnal Ekonomi
dan Kebijakan (JEJAK), 3(1), 83-89.
Yimer, Seid. (2011). Determinants of Food Consumption Expenditure In Ethiopia. International Journal of
Economics and Research, 2(5), 151-165.
Zhang, Chen, Pen dan Lin. (2008). Evaluation of Dietary Pattern by the Desirable Dietary Pattern (DDP) Score in Urban and Rural Population in Guangxi, China. The Official Journal of the Federation of
American Societies for Experimental Biology, 22(1),
1083.2.
Nur, Nuryati, Resnia, dan Santoso. (2012). Analisis Faktor dan Proyeksi Konsumsi Pangan Nasional: Kasus Pada Komoditas Beras, Kedelai dan Daging Sapi.
Buletin Ilmiah Litbang Perdagangan, 6(1), 37-52.