JEJAK
Journal of Economics and Policy
http://journal.unnes.ac.id/nju/index.php/jejak
The Strategy Development of SMEs Metal
Diah Setyorini Gunawan1, Neni Widayaningsih2, Barokatuminalloh3
1,2,3Jenderal Soedirman University, Indonesia
Permalink/DOI: http://dx.doi.org/10.15294/jejak.v10i1.9131
Received: October 2016; Accepted: December 2016; Published: March 2017
Abstract
This research aimed to identify the profile of SMEs metal and to analyze the predictors that differentiate the performance achievement of metalworkers in Pasir Wetan Village, Karanglewas Sub-District, Banyumas Regency using primary data obtained from direct interviews with metalworkers in Pasir Wetan Village, Karanglewas Sub-District, Banyumas Regency. Primary data included the data of net income rate, the amount of labor used, the amount of bank credit received, business duration, education level, and the amount of production. The data were analyzed using descriptive analysis and discriminant analysis. The analysis results indicated that the increase in the amount of production and the amount of labor used were the predictors that differentiate the revenue achievement between superior metalworkers group and non-superior metalworkers group. In addition, the amount of production was the best predictor to differentiate the revenue achievement between superior metalworkers group and non-superiors metalworker group.
Key words : SMEs, Performance, Banking Credit, SMEs Predictors, SMEs Development Strategy.
How to Cite: Gunawan, D., Widayaningsih, N., & Barokatuminalloh, B. (2017). The Strategy Development of SMEs Metal. JEJAK: Jurnal Ekonomi Dan Kebijakan, 10(1), 121-137. doi:http://dx.doi.org/10.15294/jejak.v10i1.9131
© 2017 Semarang State University. All rights reserved
Corresponding author :
Address: Jl. HR Boenyamin 708, Grendeng, Purwokerto Utara, Grendeng, Purwokerto Utara, Kabupaten Banyumas, Jawa Tengah 53122
E-mail: [email protected]
INTRODUCTION
Small and Medium Enterprises (SMEs) play an important role in economy of Indonesia. SMEs have contributed 97 percent of the employment in Indonesia. In addition, data in 2013 showed that SMEs accounted for 56 percent of the total Gross Domestic Product (GDP) in Indonesia (Ministry of Cooperatives and Small and Medium Enterprises, 2013).
SMEs have become an important component of economic development, representing a substantial proportion of national economies worldwide. SMEs can be characterized as a major of economic growth. Some studies indicate that the development of SMEs have a close relationship with economic growth. For example, a study conducted by Beck et al. (2005) found the fact that there is a positive relationship between SMEs and economic growth. Studies conducted by Ayyagari et al. (2007) found that SMEs in high-income countries contribute 50 percent to the GDP.
Post global financial crisis that occurred in 2008-2009, the attention to the role of SMEs was increased. SMEs have an important role for the economy. The role includes a role in job creation and role in increasing economic growth (Ardic et al., 2011).
Kristiyanti (2012) examines the strategic role of SMEs in national development. The findings of this study, SMEs have a strategic role in national development. SMEs play a role in economic growth and employment, as well as in the distribution of development outcomes. SMEs also proved more resilient to the economic crisis that occurred in Indonesia.
SMEs are the backbone of the Asian economy. They make up more than 98 percent of all Asian businesses that provide two out of three private sector jobs in the
region. Therefore, it is vitally important for Asia’s
economic success to have fully functioning support measures for SMEs. As for the importance of SMEs in Asia, according to a survey conducted by the Asian Development Bank (ADB) on 14 economies from the five ADB regions: 1) Kazakhstan (Central Asia); 2) the
People’s Republic of China and the Republic of
Korea (East Asia); 3) Bangladesh, India, and Sri Lanka (South Asia); 4) Cambodia, Indonesia, Malaysia, the Phillipines, Thailand, and Vietnam (Southeast Asia); and 5) Papua New Guinea and the Solomon Islands (the Pacific), SMEs account for more than 90 percent of total enterprises in each country (Yoshino and Taghizadeh-Hesary, 2016).
OECD estimates the total number of SMEs worldwide reached 90 percent of the total number of companies in the world. In addition, the number of people working in SMEs worldwide reached 63 percent of the total workforce in the world (Berisha and Pula, 2015).
International Labour Organization (2015) also stated that SMEs are a major source of job creation. Sectors within the SME are varies. In addition, SMEs include productive companies or unproductive companies. It is a challenge for the development of SMEs.
SMEs has various definitions. Organisation for Economic Co-operation and Development
(OECD) defines SMEs as independent
annual sales up to 40 million euros (Organisation for Economic Co-operation and Development, 2000).
The Central Bureau of Statistics (Badan Pusat Statistik) also provide a definition of SMEs by the quantity of labor. Small businesses are businesses that have a workforce of five to 19 people, while medium enterprises are businesses that have a workforce of 20 to 99 people (Bank Indonesia, 2011).
Winarni (2006) stated that in general, SMEs have the feature are as follows: 1) usually the form of individual business and has not been incorporated companies; 2) legality aspects are weak; 3) the organizational structure is simple; 4) no separation between his personal wealth with the wealth of the company; 5) quality management are low and rarely have a business plan; 6) the main sources of venture capital is private capital; 7) human resources are limited; and 8) the owners have a strong bond with the company so that all the company's obligation is also the duty of the owner.
SMEs is a business activity that is able to expand employment, provide economic services widely to the public, play a role in the process of equalization and improvement of
people’s income, stimulate economic growth,
and play a role in bringing about national stability (Hidayat and Fadillah, 2009). The government tries to develop SMEs to improve the performance of this sector. The development of SMEs is still facing many obstacles, especially in accessing cost of the banking sector (Bank Indonesia, 2011).
The obstacles of SMEs to bank credit is due SMEs have unique characteristics and SMEs generally do not have the transparent and well organized financial information causing lenders to have difficulty in obtaining
information about the financial condition and business of SMEs. This can cause difficulties in the bank to minimize the default risk on credit that can be distributed to SMEs. In addition, the characteristics of SMEs associated with the limited assets that can be pledged as collateral, business uncertainty in the future, and weak financial management are the constraints of SMEs to access bank credit (Bank Indonesia, 2011).
Sukidjo (2004) examines the strategy of empowerment of SMEs in Indonesia, period 1997-2001. The research reveals the problems faced by SMEs, both from within and from outside SMEs. The problems include: 1) a shortage of funds for working capital and investment; 2) difficulties in marketing; 3) difficulties in the procurement of raw materials; 4) the skills of human resources is still low; 5) The technology used is still low; and 6) difficulties in the administration of SMEs. In addition, this study also suggests a strategy for empowerment of SMEs covering system development strategy, growth policy strategies which support business climate, as well as the strategies to strengthen policy support for cooperatives and SMEs.
Sihono (2005) research on SMEs
contribution to overcome unemployment in Indonesia, period 1996-2001. The finding of this study is SMEs can overcome the problem of
employment, especially to overcome
unemployment. The role played by SMEs is quite
important. There are indications of
strengthening the spatial concentration of SMEs in Java since the economic crisis hit Indonesia.
government’s efforts to develop SMEs are still
facing obstacles, especially in accessing cost from the banking sector.
Other research on SMEs conducted by Taufiq (2006) examines the use of SMEs credit funds on the increasing business in SMEs slippers and shoes in Wedoro Waru Village, Sidoarjo. The result indicates that there is a difference between the respondents of credit users and respondents of non-credit users in the increase of their business. 95 percent of respondents of credit users have increased their own capital and 78 percent of respondent of non-credit users have increased their business.
Arregui (2012) conducted a research on entrepreneurship and SMEs in Mexico. Arregui identify strategies to accelerate the growth of SMEs in Mexico. These strategies include: 1) providing access to capital, 2) SMEs get equal treatment with the larger companies, 3) reducing frictions in the supply chain, and 4) facilitate SMEs to access performance bond.
Irmawati, Damelia, and Puspita (2013) conducted a research on SMEs batik in Klaten Regency. This research identified the application of financial inclusion in rural-based batik SMEs. The results revealed that the form of the model of financial inclusion for SMEs batik in Klaten Regency is financial institutions in terms of capital. This is in the form of low interest loans and KUR (Business Credit for Society). Then, there is a provision of assistance from financial institutions. In terms of marketing, it is necessary for SMEs in having intensive assistance, participating in batik exhibition and advertisement. Having applied this model, it is expected that SMEs batik in Klaten Regency will be well-improved.
Beck and Cull (2014) examines the SMEs in Africa by identifying SMEs' access to
services. The findings of this study is the large companies have greater access to financial services compared with SMEs. SMEs' access to financial services remains limited.
Belas et al. (2015) examines the SME business environment in the Czech Republic and Slovakia. This study focuses on motivating factors, status in society, the level of corruption, business risk at the present time, credit for funding, the ability to manage financial risk, and business optimism. The findings of this study, namely the right perception of entrepreneurs in society play an important role for the economic growth of a country. These perceptions affect motives to start a business that ultimately affect entrepreneurial behavior. The areas with the perceptions that both have a supportive business environment for the development of SMEs.
This research aimed to identify the profile of SMEs metal and to analyze the predictors that differentiate the performance achievement of
metalworkers in Pasir Wetan Village,
Karanglewas Sub-District, Banyumas Regency. Pasir Wetan Village is known as the SMEs metal center in Banyumas. SMEs metal in Pasir Wetan Village is a hereditary business where the skill level owned by the metalworkers is also acquired hereditary, not acquired from the training activities. This indicates that the performance of metalworkers in Pasir Wetan Village can be further optimized through the appropriate development strategy. In conducting this research, the researchers partnered with Satria Metal Industry Group in Pasir Wetan Village, Karanglewas Sub-District, Banyumas Regency.
The research results are expected to be the basis for the government to formulate development strategy of SMEs metal in Pasir
Wetan Village, Karanglewas Sub-District,
Banyumas Regency. Ideally, development
strategy of SMEs metal is not only based on a
central government’s policy or local
conditions of the SMEs metal in Pasir Wetan Village, Karanglewas Sub-District, Banyumas Regency.
RESEARCH METHODS
This research is the application of the discipline of economic development that addresses issues related to SMEs in Pasir Wetan Village, Karanglewas Sub-District, Banyumas Regency. The selection of location is based on the consideration that there is a metal industry center in the village.
The research method used in this research is census method. The census conducted by visiting metalworkers in Pasir Wetan Village, Karanglewas Sub-District, Banyumas Regency.
This research uses primary and secondary data. Primary data are obtained from direct interview with the metalworkers in Pasir Wetan Village, Karanglewas Sub-District, Banyumas Regency. Primary data include the data of net income rate, the amount of labor used, the amount of bank credit received, business duration, education level, and the amount of production. Secondary data include monographs of Pasir Wetan Village, Karanglewas Sub-District, Banyumas Regency.
Based on data obtained from the management of metalworkers community in Pasir Wetan Village, Karanglewas Sub-District, Banyumas Regency (Satria Metal Industry Group), the number of metalworkers are 28 workers. In this research, the respondents are 28 metalworkers.
The analytical method used in this research includes descriptive analysis and discriminant analysis. These analyses are used to answer research questions. The answers
generated in this research are the
development strategy of SMEs metal in Pasir
Wetan Village, Karanglewas Sub-District,
Banyumas Regency.
Descriptive analysis is used to group data so that the data can be managed easily. The setting and grouping of data can provide descriptive information related to SMEs metal in Pasir Wetan Village, Karanglewas Sub-District, Banyumas Regency. In this analysis, SMEs metal profiles in Pasir Wetan Village, Karanglewas Sub-District, Banyumas Regency are identified based on the amount of labor used, the amount of bank credit received, business duration, education level and the amount of production.
Discriminant analysis is used to help formulating the development strategy of SMEs metal in Pasir Wetan Village, Karanglewas Sub-District, Banyumas Regency. This analysis is a
statistical analysis for classifying
individuals/objects into separate groups based on the number of independent variables (Kuncoro, 2001). In the discriminant analysis, the
groups separation includes superior
metalworkers group and non-superior
metalworkers group.
The classification of the superior
metalworkers group and non-superior
metalworkers group is based on income level indicators of metalworkers in Pasir Wetan Village, Karanglewas Sub-District, Banyumas Regency. Furthermore, the average value of the indicators is used as a determinant of the classification between superior metalworkers group and non-superior metalworkers group. The classification with using the indicator of income level is as follows:
1. Superior metalworkers group
2. Non-superior metalworkers group
This group consists of metalworkers with a net income level below the average level of net income of metalworkers in Pasir Wetan Village, Karanglewas Sub-district, Banyumas Regency.
Then, it is performed the assessment of the role of a set of predictors so that it can be determined the important predictors that differentiate the achievement of income between superior metalworkers group and non-superior metalworkers group. The predictors include the amount of labor used, the amount of bank credit received, business duration, education level and the amount of production.
The discriminant function is based on the following equation:
Di = di1 TK + di2 CRE + di3 LS + di4 TP +
di5 OMZET ... (1)
Where:
TK = the amount of labor used
CRE = the amount of bank credit received
LS = business duration
TP = education level
OMZET = the amount of production
Discriminant function (Di) is applied
with a point of view to estimate the role of a set of predictors. The predictors used in this analysis include the amount of labor used (TK), the amount of bank credit received (CRE), business duration (LS), education level (TP), and the amount of production (OMZET).
The hypotheses related to the predictors used in the discriminant analysis are presented in Table 1.
Table 1. Predictors and Hypotheses Used in Discriminant Analysis
Increasing the amount of labor used is expected to increase
the probability of
metalworkers to be classified as superior metalworkers.
The
Increasing the amount of bank credit received is expected to increase the probability of metalworkers to be classified as superior metalworkers.
Business duration (LS)
Increasing business duration is expected to increase the probability of metalworkers to be classified as superior metalworkers.
Education level (TP)
Increasing education level is expected to increase the probability of metalworkers to be classified as superior increase the probability of metalworkers to be classified as superior metalworkers.
RESULTS AND DISCUSSION
Metal SMEs in Pasir Wetan Village, Karanglewas Sub-District, Banyumas Regency
various kinds of equipment such as household appliances, machinery and other tools.
Metal processing industry employers still use traditional technologies and manual include iron manual cutting machines, welding carbide, iron scissors, metal printing tool using stone molds and other tools. To overcome the limitations of the technology, Satria Metal Industry Group got local government aid in 2002 in the form of automatic cutting machine and machine for bending iron.
Metal SMEs in Pasir Wetan Village, Karanglewas Sub-District, Banyumas Regency is a potential industry. Economic activity that occupied the community is expected to increase the level of prosperity and strengthen the empowerment of local autonomy. The production of metal SMEs in Pasir Wetan Village marketed around Banyumas Regency, West Java, Jakarta and outside Java Island.
Identification of Metal SMEs Profile in Pasir Wetan Village, Karanglewas Sub-District, Banyumas Regency
Respondents in this research are business owners in the metal processing of
Metalworker Group (Kelompok Perajin
Logam) “Satria” in Pasir Wetan Village,
Karanglewas Sub-District, Banyumas
Regency. The number of respondents is 28 people. The interview with respondents is conducted for two weeks in March 2016. Based on the research conducted, it can be explained that the characteristics of the respondent are as follows:
The first characteristic of the
respondent is based on age; it is because age
is related to a person’s productivity, especially
when the work performed requires a lot of energy and thought. Seeing from the age, all respondents are in the productive age, it can be seen in Table 2.
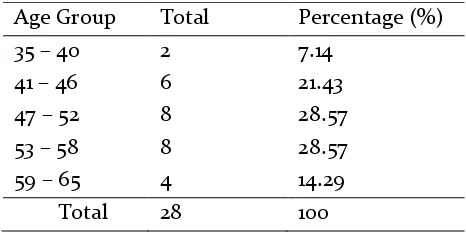
Table 2. Characteristics of Respondents by Age
Age Group Total Percentage (%)
35 – 40 2 7.14
41 – 46 6 21.43
47 – 52 8 28.57
53 – 58 8 28.57
59 – 65 4 14.29
Total 28 100
Source:Primary Data (Processed)
Table 2 indicates that the minimum age of respondents is 35 years old and the maximum age is 65 years old with the average of 50.93 years old. The age of respondents included in the productive age makes it possible for the respondents to work optimally, even though a 14.29 percent of respondents are in the older age
group of 59 – 65 years old. This is because the
respondents are business owners. The majority
of the respondents are in the age group of 47 – 58
years old.
The next characteristic is education level. Education level means the formal education that
ever been taken by the respondents. A person’s
education level in general may affect the abilities in running business, such as managerial ability and the ability to get information and new knowledge from outside that are useful for developing the businesses owned. The education level of respondents in general remains low. It can be seen in Table 3.
education, such as courses and training so as to run the business.
Table 3. Characteristics of Respondent
Source: Primary Data (Processed)
Based on the interview, most of the businesses are hereditary and there are entrepreneurs, who were labor, but they can open their own business and even absorbs labor because they have a good ability.
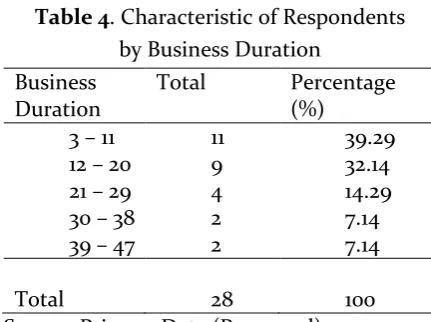
The next characteristic to be discussed is business duration that has been run by the respondents. The average business duration is 17.43 years with minimum business duration of 3 years and maximum of 46 years. More details can be seen in Table 4.
Source: Primary Data (Processed)
Table 4 indicates that the respondents who have the longest business duration are in the group of 3-11 years with a percentage of 39.29 percent, while the least business duration is in the group of 30-47 years with a percentage of 7.14 years, respectively. This business requires skill and the ability to process the metal into goods to meet the demand of consumer, so it is not easy for people to open business of metal processing. This provides the advantages for employers, including the ability to survive in running a business, some of the respondents are even able to survive for 46 years. This condition is an achievement that is not easy to be achieved. The next challenge is competition particularly with larger companies with stronger capital and the use of more modern technology.
Metal processing business that requires skill and ability to manage the metal is not always the primary work of the respondents; some of them work as police and welding worker as their primary work. Even though metal processing business is a sideline, but it does not lessen the seriousness of the respondents in managing their business. In addition, there are respondents who have a sideline in addition to the metal processing as the main livelihood, including making school uniforms, servicing hand phone, land selling and purchasing and marketing the results. The sideline is performed in their spare time, especially when the respondents do not have many orders. The amount of labor used by the respondent in the metal processing business varies with an average of 5 workers, the minimum labor is one and the maximum labor is 25 workers. Detailed information related to the amount of labor can be seen in Table 5.
labor is largely derived from non-family by 71.15 percent, especially for business with the ownership of large number of workers, while 28.85 percent are from families.
Table 5. Characteristics of Respondents by Amount of Labor
Amount of Labor
Total Percentage (%)
1 – 5 19 67.86
6 – 10 6 21.43
11 – 15 1 3.57
16 – 20 0 -
21 – 25 2 7.14
Total 28 100.00
Source: Primary Data (Processed)
Data collection in this research is conducted in March. Based on respondent information, it is not a peak period so that the metal processing business turnover has not been optimal; the turnover is still possible to increase, especially in one or two months before the new school year. A lot of respondents received many orders in one or two months before the new school year. The turnover ranged between Rp4,400,000.00 up to Rp500,000,000.00. Detailed information on the amount of turnover can be seen in Table 6.
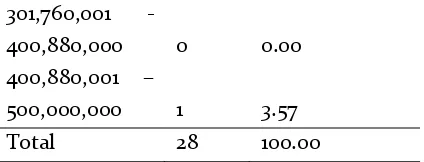
Table 6. Characteristic of Respondent by Business Turnover in March 2016
(28 Respondents)
Total Turnover Total Percentage (%)
4,400,000 -
103,520,000 23 82.14
103,520,001 -
202,640,000 3 10.71
202,640,001 -
301,760,000 1 3.57
301,760,001 -
400,880,000 0 0.00
400,880,001 –
500,000,000 1 3.57
Total 28 100.00
Source: Primary Data (Processed)
Table 6 indicates that the highest turnover of respondents is in the group of Rp4,400,000.00
– Rp103,520,000.00 by 82.14 percent, there are no
respondents in the turnover group of
Rp301,760,000.00 – Rp400,880,000.00, the other
turnover group is only 3.57 percent except for the
turnover group of Rp103,520,001.00 –
Rp202,640,000.00 by 10.71 percent. Because the turnover range is fairly wide among the groups that is Rp99,120,000.00 and most of the respondents are in the first turnover group, then in adding the information, Table 7 shows data on turnover in 23 respondents.
Table 7. Characteristic of Respondent by Business Turnover in March 2016 (23
Respondents)
Total Turnover Total Percentag
e (%)
4,400,000 - 24,224,000 17 73.91
24,224,001 - 44,048,000 4 17.39
44,048,001 - 63,872,000 1 4.35
63,872,001 - 83,696,000 0 0.00
83,696,001 - 103,520,000 1 4.35
23 100.00
Source: Primary Data (Processed)
Table 7 indicates that most of the respondents have a turnover in the range
between Rp4,400,000.00 – Rp24,224,000.00 by
17.39 percent, the other group is only 4.35
percent, only the group of Rp24,224,001.00 –
Seeing from the amount of turnover owned by metal business, most of the turnover are still not optimal, only a few respondents who have a turnover of more than one hundred million. There are some things that cause these conditions, such as the limitations of the technology and the ability of the entrepreneur. To help metal processing
business, the government provides
assistances, such as training and tools. The training includes entrepreneurship and SMEs training as well as production training such as training of cutting iron, metal casting and the manufacture of agricultural tools. Some of the respondents still do not receive the aid, there are only 16 out of 28 respondents who already had it.
The limitation of turnover is also caused by the lack of capital. Thus, the entrepreneurs apply for credit from bank to increase the capital. The purpose of the credit application is to increase turnover and revenue, the average income received by the respondents before receiving credit is Rp13,614,600.00. Detailed information can be seen in Table 8.
Table 8. Net Income before Receiving Credit
Net Income Total Percentage
(%)
3,101,000 - 9,455,800 6 40.00
9,455,801 - 15,810,600 4 26.67
15,810,601 - 22,165,400 2 13.33
22,165,401 - 28,520,200 2 13.33
28,520,201 - 34,875,000 1 6.67
Total 15 100.00
Source: Primary Data (Processed)
Net income before receiving credit is minimally Rp3,101,000.00 and maximally Rp34,875,000.00. Most of the respondents have net income in the group of
Rp3,101,000.00 – Rp9,455,800.00 by 40
percent and the least respondents are in the
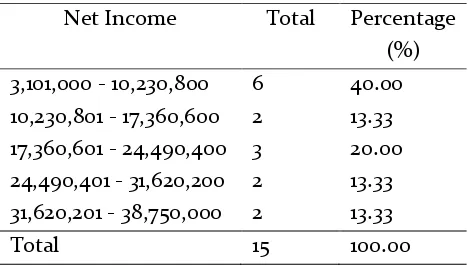
group of Rp28,520,201.00 - Rp34,875,000.00 by 6.67 percent. After receiving credit, the average net income increases to Rp16,431,260.00; further information can be seen in Table 9.
Table 9. Net Income after Receiving Credit
Net Income Total Percentage
(%)
3,101,000 - 10,230,800 6 40.00
10,230,801 - 17,360,600 2 13.33
17,360,601 - 24,490,400 3 20.00
24,490,401 - 31,620,200 2 13.33
31,620,201 - 38,750,000 2 13.33
Total 15 100.00
Source: Primary Data (Processed)
Table 9 indicates that there is an increase in net income after receiving credit even though there is no change in minimum income, but there is an increase in maximum income to Rp38,750,000.00. The average net income also increased by Rp2,816,660.00. The data indicates that there are respondents who have benefit of the credit requested to the bank.
Predictors That Differentiate Revenue Achievement between Superior Metalworkers Group and Non-Superior Metalworkers Group
Discriminant analysis is used to help formulating the development strategy of SMEs metal in Pasir Wetan Village, Karanglewas Sub-District, Banyumas Regency in classifying individuals/objects into separate groups based on the number of predictors. In discriminant analysis, it is performed a separation of group consisting of superior metalworkers group and non-superior metalworkers group.
Karanglewas Sub-District, Banyumas Regency are classified as superior metalworkers group. The remaining 64 percent of metalworkers in Pasir Wetan Village, Karanglewas Sub-District, Banyumas Regency are classified as non-superior metalworkers group.
The stage after classifying between superior metalworkers group and non-superior metalworkers group is performing
discriminant analysis. The results of
discriminant analysis are shown in Table 10, Table 11 and Table 12. Table 10 shows the result of test of equality of group means, Table 11 shows a summary of discriminant model classification and Table 12 shows the results of discriminant function analysis using five explanatory variables (discriminant function coefficients).
Table 10. Test of Equality of Group Means
Wilks’
Lambda The amount of labor used
(TK)
The amount of bank credit received (CRE)
Business duration (LS)
Education level (TP)
The amount of production (OMZET)
0.720* (0.004)
0.956 (0.286)
0.989 (0.594)
0.999 (0.849)
0.604* (0.000)
Source : Primary Data (Processed)
Description :
* Significant at α = 1%
Test of equality of group means provides
Wilks’ Lambda value for each predictor. By
seeing at the significant level, it can be concluded that the amount of labor used (TK) and the amount of production (OMZET) are significant, meaning that the predictors are able to differentiate the revenue achievement between superior metalworkers group and non-superior metalworkers group.
Table 11. Summary of Discriminant Model Classification
Dt
Predicted Group
Membership
Total
0 1
Original Count 0 18 0 18
1 4 6 10
% 0 100,0 0 100,0
1 40,0 60,0 100,0
Source : Primary Data (Processed) Description :
* 85,7% of original grouped cases correctly classified
** 0 = non-superior metalworkers group 1 = superior metalworkers group
Based on Table 11, in general this discriminant model is able to correctly classify more than 85.7% cases. The group membership is correctly predicted at 100% for non-superior metalworkers group and 60% for superior metalworkers group.
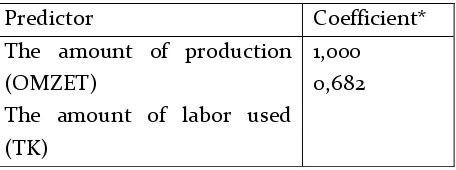
Table 12. Coefficient of Discriminant Function
Predictor Coefficient*
The amount of production (OMZET)
The amount of labor used (TK)
1,000 0,682
Description :
* Chi-square = 12.850; significant at α =
1%
Significant Chi-square value at α=1%
shows statistically significant discriminant function which means that the means (average) value of discriminant scores for the two groups of metalworkers are different significantly.
**The predictors, such as the amount of bank credit received (CRE), business duration (LS) and education level (TP), are not significant and are unable to differentiate the revenue achievement between superior
metalworkers group and non-superior
metalworkers group.
Based on Table 12, it can be determined that the amount of production (OMZET) is the best predictor to differentiate between the revenue achievement between superior
metalworkers group and non-superior
metalworkers group. Table 12 also indicates that the increasing amount of production and the amount of labor used may increase the probability of metalworkers to be classified as superior metalworkers group.
Related to the development strategy of SMEs metal in Pasir Wetan Village,
Karanglewas Sub-District, Banyumas
Regency, the framers of the strategy should ideally focus on increasing the amount of production. The increasing amount of production can further increase the amount of labor used. The amount of production and the amount of labor used are the predictors that differentiate revenue achievement between superior metalworkers group and non-superior metalworkers group.
The strategies to increase the amount of production of SMEs metal are training and tools aid. The training provided includes training in entrepreneurship and SMEs as well as production trainings, such as training of
cutting iron, metal casting and manufacture of agricultural tools.
Related to human resource development, the government should intensify its support for firms sending their workers to short-term vocational training course. The government
should also raise entrepreneur’s awareness of the
importance of human resource development and support SMEs owners efforts to develop their own human resources.
In order to increase SME owners about knowledge of domestic and export markets, the government should: 1) enlighten entrepreneurs about the importance of demand orientation, market knowledge, and product quality; 2) provide free information on markets and recent market development; 3) assist SME owners with their own market research; and 4) foster co-operation with international firms within global value chains and other co-operative forms (Loewe et al, 2013).
In addition, the banking credit is also needed in order to increase the amount of production because one of the causes of the limited amount of production is the lack of capital. This condition as proposed by the International Finance Corporation (IFC)-World Bank in Micro, Small, and Medium Enterprise Country Indicators that the biggest problems of SMEs in 132 countries including Indonesia are difficult to access capital (IFC-World Bank, 2010).
relevant institutions; 2) coaching and training activities; 3) help in promoting the products; 4) assistance in the expansion of product marketing network; and 5) the provision of facilities and infrastructures as supporting the advancement of SMEs.
Another strategy that can be done to increase the number of SMEs production of metal, namely strengthening the linkages between SMEs. This strategy is done by setting up a framework for partnerships with government or private companies and partnerships between SMEs. The government is a facilitator to initiate partnerships with big companies.
Organisation for Economic
Co-operation and Development (2000) stated that small firms need to upgrade their management skills, their capacity to gather information and their technology base. Governments need to improve SMEs access to financing, information infrastructures and international markets. Providing regulatory, legal and financial frameworks conducive to entrepreneurship and small firm start-up and growth is a priority.
Fostering public-private partnerships and small-firm networks and clusters may be the most expeditious path to a dynamic SMEs sector. Grouped in local systems of production, SMEs can often be more flexible and responsive to customer needs than large integrated firms. They can pool resources and share the cost of training, research, and marketing. Clustering facilitates exchange of personnel and diffusion of technology and creates new possibilities for efficiency gains. Importantly, these local networks and support systems can help SMEs meet the challenges of globalization. Whether alone or in clusters, SMEs are seeking international opportunities through strategic alliances,
franchising, and joint ventures. Government policy initiatives should take account of regional and local factors which affect entrepreneurship and build on these particularities to foster small-firm partnerships. Policies should use local institutions, groups of industries and inter-firm linkages to create and strengthen the micro-level
bonds which can underpin global
competitiveness. Building on local strengths, SMEs policies need to address the new dynamics of entrepreneurship and small-firm clusters to meet the challenges posed by globalizing economies (Organisation for Economic Co-operation and Development, 2000).
Farsi and Toghraee (2014) examines the SMEs in Iran by identifying the key challenges faced by SMEs. Findings from the study showed that managerial and human resources, research and development, technology, national policies, environmental bureaucracy and limitation of market information are the main challenges faced by SMEs in Iran.
World Bank (2005) stated that efforts to develop SMEs includes reduction of local legislation and regulation of business, the establishment of a new funding for SMEs, tax reform and tax refund appropriately, actively support business education, increase access to micro-finance services, and search other opportunities to develop better communication infrastructure.
The framers of the strategy should give an attention to the competitive performance. The competitiveness refers to the ability of firms to compete for markets, resources, and revenues as measured by indicators such as relative market share, growth, profitability or innovation (Roberts, 2004). The competitiveness of an economy is seen as ultimately reflecting its productivity. This depends on the value of
nation’s products and services, supplied by its
command on international markets, and the efficiency with which these products and services are produced (Porter et al, 2008). An economy becomes more competitive through the ability of its enterprises to increase
productivity by using assets (human
resources, capital, physical assets, among others) more efficiently.
United Nations-Economic and Social Commission for Asia and the Pacific (2009) stated that competitiveness is fundamentally and enterprise level concept, referring to the relative performance of firms in particular
product markets. The competitive
performance of enterprises is shaped by a
country’s: endowment, macroeconomic
conditions (including a country’s policy and
institutional environment), and
microeconomic factors (including the quality
of a country’s business environment, the relative sophistication of a firm’s operations,
and the state of enterprise cluster
development in a particular economy).
Attention must be focused on the
requirements of enterprise linkages and network efficiencies, and on upgrading options (for example: product and process innovation) as key dimensions of the competitiveness.
SMEs facing the challenges related to the competition, the ability to adapt to rapidly changing market demand, technological change, and the limitations associated with science, innovation, and creativity. Factors associated with the Small and Medium Enterprise includes: 1) resources limitations (financial, technology, skilled labor, and access to markets); 2) the high transaction costs compared to large companies; 3) networks limitations that lead to lack of information and limitations related to domestic markets as well as internationally; 4) inability to compete with companies larger
associated with innovation (product, process, and organization); and 5) weak entrepreneurial spirit and capacity (Yoshino and Taghizadeh-Hesary, 2016).
It is possible to identify a range of activities that can contribute to strengthening the prospects for the competitiveness of SMEs. The framers of the strategy have to pick the appropriate mix of policies, programmes, and institution-building initiatives to be undertaken by the government and private sector, and
supported by international development
partners. Specific policies, programmes, and institutional frameworks are seen as needed to increase the competitiveness of SMEs. A public policy or publicly financed programme to support SMEs must be anchored in a sound economic rationale.
A generally supportive macroeconomic
environment for enterprise development
includes low budget deficits, appropriate
inflation management, competitive real
exchange rates, and an outward-oriented trade regime. The macroeconomic environment needs to be particularly stable and predictable from the perspective of small firms, as fundamental unexpected policy changes may threaten the viability of SMEs more readily than that of larger firms (United Nations-Economic and Social Commission for Asia and the Pacific, 2009).
simplify bureaucracy; 4) provision of financing in accordance with the provisions of the legislation; and 5) facilitating technology and information.
CONCLUSION
From the results of research and discussion about the strategy development of SMEs metal in Pasir Wetan Village Karanglewas Sub District Banyumas Regency, it can be concluded as follows:
Identification of SMEs metal profile in Pasir Wetan Village, Karanglewas Sub-District, Banyumas Regency indicates that the minimum age of respondent is 35 years old and the maximum age is 65 years old, and the average age is 50.93 years old. The age of respondents included in the productive age make it possible for them to work optimally.
The education level of respondents is still low, 50 percent of the respondents have only finished primary school, there are even two respondents who did not finish primary school, and only one respondent who have higher education. The type of work owned by the respondent did not give priority to formal education.
There are 39.29 percent of the respondents who run the business with the business duration of 3-11 years, while the least respondents are in the group of 30-47 years with the percentage of 7.14 years, respectively. This business requires skill and ability to process the metal into goods according to consumer demand, so that it is not easy for people to open the metal processing business.
The highest ownership of labor is in the group of 1-5 labors by 67.86 percent, while the lowest ownership of labor is in the group of 11-15 labors by 3.57 percent, and there is a group of 16-20 labor that have no respondent. The
source of labor is largely derived from non-family by 71.15 percent, especially for the business with the ownership of quite a lot of labor, while 28.25 percent are from families.
Seeing from the amount of turnover owned by metal business, most of the turnover are still not optimal, only a few respondents who have a turnover of more than one hundred million. There are some things that cause these conditions, including the limitation of the technology and the ability of the entrepreneur.
The limitation of turnover is also caused by the lack of capital. Thus, the entrepreneurs apply for credit from bank to increase the capital. The purpose of the credit application is to increase turnover and revenue, the average income received by the respondents before receiving credit is Rp13,614,600.00. After receiving credit,
the average net income increases to
Rp16,431,260.00
The result of discriminant analysis indicates that the amount of production is the best predictor to differentiate the revenue achievement between superior metalworkers group and non-superior metalworkers group. The amount of labor used is also a predictor of revenue achievement that differentiates between superior metalworkers group and non-superior metalworkers group. While the other predictors, such as the amount of bank credit aid received, business duration and education level, are not the predictor of revenue achievement between superior metalworkers group and non-superior metalworkers group.
that differentiate revenue achievement between superior metalworkers group and non-superior metalworkers group.
The strategies to increase the amount of production of SMEs metal are training and tools aid. The training provided includes training in entrepreneurship and SMEs as well as production trainings, such as training of cutting iron, metal casting and manufacture of agricultural tools. In addition, the banking credit is also needed in order to increase the amount of production because one of the causes of the limited amount of production is the lack of capital.
Another strategy that can be done to increase the number of SMEs production of metal, namely strengthening the linkages between SMEs. This strategy is done by setting up a framework for partnerships with government or private companies and partnerships between SMEs. The government is a facilitator to initiate partnerships with big companies.
The framers of the strategy should give an attention to the competitive performance. The competitiveness of an economy is seen as ultimately reflecting its productivity.
REFERENCES
Anggraeni, F.D., I. Hardjanto, A. Hayat. (2012). Pengembangan Usaha Mikro, Kecil, dan Menengah (UMKM) Melalui Fasilitasi Pihak Eksternal dan Potensi Internal (Studi Kasus pada Kelompok Usaha “Emping Jagung” di Kelurahan Pandanwangi Kecamatan Blimbing, Kota Malang). Jurnal Administrasi Publik, 1(6). Ardic, O.P., N. Mylenko, V. Saltane. (2011). Small and
Medium Enterprises: A Cross-Country Analysis with A New Data Set. World Bank Policy
Research Working Paper 5538.
Arregui, R.A. (2012). Mexico’s Growth Will Come From Entrepreneurship and Small and Medium-Sized Enterprises. Innovations,7(1).
Ayyagari, M., T. Beck, A. Demirguck-Kunt. (2007). Small and Medium Enterprises Across the Globe. Small
Business Economics 2007.
Bank Indonesia. (2011). Kajian Akademik Pemeringkat Kredit Bagi Usaha Mikro, Kecil dan Menengah di Indonesia.
Jakarta: Bank Indonesia.
Beck, T., A. Demirguc-Kunt, V. Maksimovic. (2005). SMEs, Growth, and Poverty: Cross-Country Evidence.
Journal of Economic Growth,10.
Beck, T. and R. Cull. (2014). Small and Medium-Sized Enterprise Finance in Africa. Africa Growth Initiative
Working Paper 16.
Belas, J., V. Demjan, J. Habanik, M. Hudakova, J. Sipko. (2015). The Business Environment of Small and Medium-Sized Enterprises in Selected Regions of The Czech Republic and Slovakia. Ekonomika a
Management,18(1).
Berisha, G. and J.S. Pula. (2015). Defining Small and Medium Enterprises: A Critical Review. Academic Journal of Business, Administration, Law and Social Sciences,
1(1).
Farsi, J.Y. and M.T. Toghraee. (2014). Identification the Main Challenges of Small and Medium Sized Enterprises in Exploiting of Innovative Opportunities (Case Study: Iran SMEs). Journal of
Global Entrepreneurship Research,4(4).
Hidayat, I.P. and A.R. Fadillah. (2009). Pengaruh Penyaluran Kredit Usaha Mikro Kecil Menengah (UMKM) dan Pendapatan Operasional Terhadap Laba Operasional (Kasus Pada PT. Bank Jabar Banten Tbk). Jurnal Dipublikasikan Pada Digital Library Fakultas Ekonomi Jurusan Akuntansi Universitas Siliwangi.
International Finance Corporation-World Bank. (2010). Micro, Small, and Medium Enterprises Around the World: How Many Are There and What Affects the Count? MSME Country Indicators 2010.
International Labour Organization. (2015). Small and Medium-Sized Enterprises and Decent and Productive Employment Creation. International
Labour Conference,104/1V.
Irmawati, S., D. Damelia, D.W. Puspita. (2013). Model Inklusi Keuangan Pada UMKM Berbasis Pedesaan. JEJAK, 6(2).
Kementerian Koperasi dan Usaha Kecil dan Menengah. (2013). UMKM Serap 97 Persen Tenaga Kerja di Indonesia. Available at : http://www.depkop.go.id/index.php?option=com_c ontent&view=article&id=1281:umkm-serap-97- persen-tenaga-kerja-di-indonesia&catid=50:bind-berita&Itemid=97. Accessed on 1st of November 2015. Kristiyanti, M. 2012. Peran Strategis Usaha Kecil Menengah (UKM) Dalam Pembangunan Nasional. Majalah
Kuncoro, M. (2001). Metode Kuantitatif: Teori dan
Aplikasi untuk Bisnis dan Ekonomi. Yogyakarta:
UPP AMP YKPN.
Loewe, M., I. Al-Ayouty, A. Altpeter, L. Borbein, M. Chantelauze, M. Kern, E. Niendorf, M. Reda. (2013). Which Factors Determine the Upgrading of Small and Medium-Sized Enterprises (SMEs)? The Case of Egypt. Studies Deutsches Institut fur
Entwicklungspolitik,76.
Mulyati, H. (2010). Analisis Karakteristik UKM Jaket Kulit di Kabupaten Garut dengan Menggunakan Model Diamond Porter. Jurnal Manajemen dan Organisasi, 1(1).
Organisation for Economic Co-operation and Development. (2000). Small and Medium-Sized Enterprises: Local Strength, Global Reach. Policy Brief, June 2000.
Porter, M., M. Delgado, C. Ketels, S. Stern. (2008). Moving to a New Global Competitiveness Index.
Global Competitiveness Report 2008-2009.
Roberts, J. (2004). The Modern Firm: Organizational
Design for Performance and Growth. Oxford:
Oxford University Press.
Sihono, T. (2005). Usaha Kecil dan Menengah (UKM)
dan Upaya Mengatasi Pengangguran. Jurnal
Economia, 1(1).
Sukidjo. (2004). Strategi Pemberdayaan Usaha Kecil dan Menengah. Jurnal Ekonomi & Pendidikan, 2(1). Taufiq. (2006). Penggunaan Dana Kredit UKM Terhadap
Peningkatan Usaha (Studi Pada UKM Sandal dan Sepatu Desa Wedoro Waru Sidoarjo). Jurnal
Ilmu-Ilmu Ekonomi, 6(2).
United Nations-Economic and Social Commission for Asia and the Pacific. (2009). Globalization of Production and the Competitiveness of Small and Medium-Sized Enterprises in Asia and the Pacific: Trends and Prospects. Studies in Trade and Investment 65. Winarni, E.S. (2006).Strategi Pengembangan Usaha Kecil
Melalui Peningkatan Aksesibilitas Kredit Perbankan.Jurnal Infokop, 29.
World Bank. (2005). Mendukung Usaha Kecil dan
Menengah. Indonesia: Gagasan untuk Masa Depan, Januari 2005.
Yoshino, N. and F. Taghizadeh-Hesary, (2016). Major
Challenges Facing Small and Medium-sized