THE USE OF SIMULATION FOR TEACHING SPEAKING AT ELEVENTH GRADE STUDENTS OF SMK LKIA
Veronika Heni, Clarry Sada,Iwan Supardi
English Language Education Study Program of Teacher Training and Education Faculty of Tanjungpura University, Pontianak
Email: [email protected]
Abstract: This research is to find out whether the use of simulation significantly influenced the speaking ability on the eleventh grade students of SMK LKIA Pontianak. This is a pre-experimental. The sample of this research was class XI TN that consists of 32 students. The tool of data collecting of this research was a speaking test. Based on the findings, it showed that there was significant difference score before and after taught by
simulation. The students’ mean score of pre-test was 50. Then, the students’ mean score of the post-test was 61. Thus it was categorized as moderate influence. From the result of paired t-test, the students’ achievement after taught by simulation showed tratio = 12.016 is higher than tcritical = 2.042, so it can be concluded that null hypothesis (Ho) is rejected, but alternative hypothesis (Ha) is accepted. Therefore, the writer concluded that teaching speaking by using simulation was succed.
Keywords: speaking, simulation, eleventh grade students, pre-experimental
Abstrak: Penelitian ini bertujuan untuk mengetahui apakah penggunaan simulasi secara signifikan mempengaruhi kemampuan berbicara pada siswa SMK LKIA Pontianak. Penelitian ini merupakan penelitian pre-eksperimen. Sampel penelitian ini menggunakan kelas XI TN yang terdiri dari 32 siswa. Alat pengumpulan data dari penelitian ini adalah tes berbicara. Berdasarkan temuan, menunjukkan bahwa ada perbedaan hasil nilai berbicara siswa yang signifikan pada sebelum dan setelah diajarkan dengan menggunakan metode simulasi. Hasil nilai rata-rata pada pre-test siswa adalah 50. Selanjutnya, hasil nilai rata-rata pada post-test siswa adalah 61. Dengan demikian, hasil tersebut dapat dikategorikan sebagai cukup berpengaruh. Dari hasil uji-t berpasangan, prestasi siswa setelah diajarkan dengan imenggunakan simulasi menunjukkan t-ratio = 12,016 lebih tinggi dari t-critical = 2,042, sehingga dapat disimpulkan bahwa nol hipotesis (Ho) ditolak, tetapi alternatif hipotesis (Ha) diterima. Oleh karena itu, penulis menyimpulkan bahwa pengajaran berbicara dengan menggunakan metode simulasi telah sukses.
Kata kunci : berbicara, siswa kelas sebelas, pre-eksperimen
he area of English has always become a special interest. It is because of the importance of English in any scope of our life. English is very important that need to be learned by everyone in everywhere. One of the English skill that most
important in communication is speaking. Speaking as one of the language skills that should be developed, besides the other three language skills is considered important because it plays an essential role in facilitating the students to master on components of speaking proficiency such us fluency, vocabulary, structure and pronounciation. By mastering the components of speaking, the students will be able to communicate in English with other people that have different backgrounds and countries easily. Especially if they intend to go abroad, it can be an obligation for them to be able to communicate in English to apply at the first international language in countries all over the world.
In learning speaking skill, the students find some problems. The problems frequently found are because of lack of practice the foreign language in daily conversation. They are also too shy and afraid to take part in the conversation and so if make mistakes in speaking. The confidence must be built by the learner in learning speaking English. Barrass (2006:2) said that “When you speak, you know
what you are thinking and how you feel about it”. It means, if the learners want to have a good speaking, they need to speak confidently. The students also must involve directly in practicing their speaking.
On the pre-research, the writer found that most of students perform their speaking by memorizing the utterances that they will speak. They memorize it based on their worksheets (LKS). They only used the conversation that available on the book when they speak in their groups. It is better for the students to develop the materials by their own group based on the topic given by the teacher. Besides that, they can not speak with expression when they perfom the conversation with their friends in the classroom and they have to imagine the setting of their conversation. They also seldom to speak in learning English subject. The lack of vocabulary also makes them unconfidence in speaking English.
Therefore, the writer choosed a technique that can make the students active and create the same opportunities to all students who join the speaking class in explore their ideas. The technique was a Simulation technique. This technique applied on the eleventh grade students of SMK LKIA Pontianak. According to
Brown (2001:135) “Simulation technique is an activity involving complex
interaction between groups and individuals based on simulation of real life action and experinces. It means that when the students discuss one topic, they need to explore based on their experience with some setting that has been defined. The students also can bring items to the class to create a relistic environment.
persuade their mind to inform something and to ask questions based on their own point of view.
There are some components that should be paid attention in learning speaking. As stated by Brown (2001: 254) there are two components of speaking ability; accuracy and fluency. It is now very clear that both fluency and accuracy are important goals to pursue in communicative language teaching. Whereas the other aspects of speaking needed to be measured but the bigger point in measuring the students speaking ability is still in accuracy. Accuracy is achieved to some extent by allowing students to focus on elements of fluency, vocabulary, structure, pronounciation, in their spoken output. In order to make clear explanation about the elements as the components of speaking that will be measured in students’ performance in this research, here are the explanations below:
When talking about fluency it is related with speaking and understanding a language quickly and automatically. Sometimes fluency is defined in contrast to accuracy. Lennon (1990:388-389) says that the term of fluency is used in two different ways in the literature, what he calls its broad and narrow meanings. The broad definition operates "as a cover terms for oral proficiency," which represents the highest point on a scale that measures spoken command of a foreign language" The narrow definition of fluency is that it is "one, presumably isolatable, component of oral proficiency. This sense is found particularly in procedures for grading oral examinations".
Vocabulary is the total number of words that has meanings, also used in a English textbook and foreign language. Teaching vocabulary means teaching how to understand the meaning. Sometime vocabulary not only as a single word,
it can be a phrase. It supported by Webster (2007:28) said “vocabulary can mean
not only a single word, but also two or three words that go together to form meaning, a phrase, or a whole sentence that communicates something”.
Structure is the way in which the parts of a system or object are arranged or organized by Hornby (1995:1186). In general, structure related to the way of students in mastering word order and omission, pronouns and relative clauses, tenses, prepositions, produces correct sentences and other grammar rules that commonly occurred when they are speaking among them, so their speaking can be understood by other.
In speaking, the students need to produce good structure utterance. Wolfgang Klein and Clive Perdue (1992:2) argued that:
“The utterance structure of learner varieties is governed by other organisational principles, which are also present in fully-fledged languages, but with less weight - for instance principles based on what is maintained from a previous utterance and what is freshly introduced ('referential shift'), on what is topic information and what is focus
information”.
With good stucture of uttercne, the utterance produced by the student will be easy to understand by the listener or partner of speaking.
Harmer (2007:248) said that in pronounciation we “concentrating on sound, showing where they are made in mouth,making students aware of where
Since the phonetic transcription represents speech sound consistently, it can be used as a reliable guide to have a control of the spoken language. From the explanation above, it can be concluded that pronounciation is the way to pronounce words or sounds in a certain way in order to make the speech can be easy to understand by the listener because the way to pronounce a word or words will bring significances.
METHOD
This research used a pre-experimental design with one group pretest-posttest design. In one group pretest-posttest study, a benefit of this design over the previously discussed design is the inclusion of a pretest to determine baseline scores. According to Ary, Jacobs and Razavieh (2002) mention that:
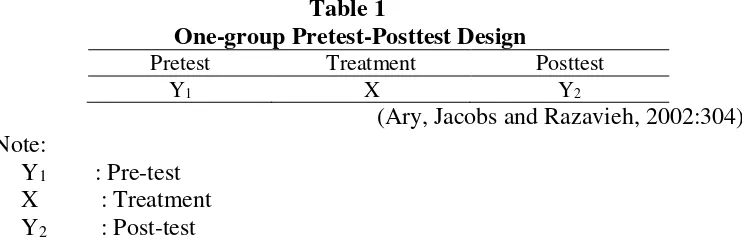
the design of pre-experimental with one-group pretest-posttest usually involves three steps: (1) administering a pretest measuring the dependent variable, (2) applying the experimental treatment X to the subject, and (3) administering a posttest, again measuring the dependent variable. Differences attributed to application of the experimental treatment are then evaluated by comparing the pretest and posttest score (p.303-304).
Through the pre-test and post-test, the writer knew the differences in result after the treatment. The design in this study can be visualized as follows:
Table 1
One-group Pretest-Posttest Design
Pretest Treatment Posttest
Y1 X Y2
(Ary, Jacobs and Razavieh, 2002:304) Note:
Y1 : Pre-test X : Treatment Y2 : Post-test
According to Ary, Jacobs and Razavieh (2011:193) mention that populations are all members of a group of people, events, or objects that have been formulated clearly. The population in this study is the eleventh grade students of SMK LKIA Pontianak. The characteristics and properties of members of the sample reflected the characteristics and nature of the population. In this research, the sample was selected by random sampling. Singh (2006:84) mentions
“Randomization is a method of sampling in which each individual of the population has the equal chance or probability of selection of the individuals for
FINDINGS AND DISCUSSION Findings
The result of measuring the dependent variable was analyzed by using descriptive and inferential statistical test. The statistical analysis process was supported with Statistic Product and Service Solution (SPSS), for testing descriptive data, and paired-sample T-test with significance degree 0,05 or 95% (meaningful). The analysis of descriptive and inferential statistics is to determine means from dependent variable of the students’ achievement after being taught by the writer. After administering the pretest and posttest, so the writer gained the score for each sample. The comparison of the test result can be seen in the table below:
Table 2
Descriptive Paired Samples Statistics
N Mean Std. Deviation Minimum Maximum
PRETEST 32 50,0000 8,89001 35,00 65,00
POSTTEST 32 60,9375 10,88336 40,00 80,00
Explanation :
The Mean in the third coloumn shows in the pre-test, the score was 50 (fifty) and after the treatment in the post-test, the mean score rised into 60,9375 (sixty point nine three seven five) it can be rounded to 61 (sixty one). The standard Deviation in the fourth column provides some idea about the distribution of scores around the mean (average). The smaller the standar deviation, the more narrow the range between the lowest and highest score or, more generally that the score cluster closely to the average score. The function of Standard Deviation is to correct the statisticians that have generated an equation based on estimate of a popularizing. As can be seen in the table above, the standar deviation on the pre test was 8,89001 and post test was 10,88336. Minimum and maximum in the five and six columns are the lowest and highest score of the students on the test. There are 35,00 (thirty five) for the minimum score and 65,00 (sixty five) for the maximum score of the students in the pre test and 40,00 (forty) for the minimum score and 80,00 (eighty) for the maximum score of the students in the post test. The general description between the pre test and the post test who taught by simulation technique could be seen in the following diagram.
Table 3
Descriptive Paired Samples Correlations
Paired Samples Correlations
N Correlation Sig.
Pair 1 PRETEST & POSTTEST 32 ,884 ,000
Explanation:
Based on the table above, it showed that there was a significance correlation between dependent and independent variable. The correlation shows
acievement is strong. It can be proved by the Pearson product-moment correlation coefficient as follows:
Table 4 Interpretation
The
significance was 0.000 < 0.05. It means that there is a significance correlation between
simulation with students’ speaking achievement because the result of significance
is lower than the signifivance of alpha level.
Hypothesis Testing
In order to measure whether or not the difference the means of the pre test and post tes was statistically significant, the writer analyzed the data that has been collected with Statistic Product and Service Solution (SPSS) and it measured by seeing the t test, then it will compared to the t critical. The calculation of the result can be explained as follows: There are five steps that the writer used in making the hypothesis testing: (1) identify a null and alternatif hypothesis; (2) set the level of significance, or alpha level; (3) collect the data; (4) compute the sample statistic; (5) make a decision about rejecting or failing to reject the null hypothesis (Creswell, 2012:188).
1. Hypothesis:
a.
Ho:xpre xpostat0,05,tratiotcritical
The students’ average achievement score before and after the treatment are the same (there is no effect) b.
Ha :xpre xpostat0,05,tratiotcritical
The students’ average achievementscores before and after treatment are different (there is effect).
2. The significance level that the reseacher used 5% or 0,05 ( the most commonly used alpha level of significance in the field of education as stated by Ary, Jacobs, and Razavieh (2002:179)), and Degrees of freedom for statistical test is to examine the print out for the value. (Df = N –1= 32-1= 31) so it got score tcritical(0,05; 31) was 2.042.
3. The data of the students mean score in the pre test and post test can be seen in the table 4.1 and 4.2 .
4. Computating the sample statistic can be seen on the table below:
R Interpretation
0 0,01-0,20 0,21-0,40 0,41-0,60 0,61-0,80 0,81-0,99
1
No correlation
Very weak correlation Weak
Table 5
Calculation of Hypothesis Experiment Paired Samples Test Paired Samples Test
Paired Differences T df Sig. (2-tailed) Mean Std.
Deviation
Std. Error Mean
95% Confidence Interval of the
Difference Lower Upper
Pair 1 PRETEST – POSTTEST
-10,93750 5,14899 ,91022 -12,79391 -9,08109 -12,016 31 ,000
Explanation:
a. In the second column is the Mean of both score in the pre test and post test (-10,93750).
b. In the third column is Std Deviation, it is some idea about the distribution of scores around the mean (average) of the pre test and post test (5,14899). c. In fourth column is Std Mean error, which determines how precisely the
mean of the mean of the sample estimates the population mean. Lower values of the standard error of the mean indicate more precise estimate of population mean (0,91022).
d. In the fift and sixt columns are the 95% Confidence Interval of the Difference of lower and upper are the lower limit and the upper limit of data lying outside ( lower : 12,79391) (upper :-9,08109)
e. In the seventh column is the most important score in making the hypothesis testing, also called as tratio / ttest was (-12,016 )
f. In the eight column is the degree of freedom. g. In the last column is the significance result. 5. Interpretation of hypotheses testing
a. If tratio > tcritical and score sig. 0,05 (95%), so Ho was rejected b. If tratio < tcritical and score sig. 0,05 (95%), so Ho was accepted
Based on the table above, it can be seen that the (tratioscore = -12,016 Meanwhile tcritical score with df 31 = 2.042). So that, tratio (-12,016) > tcritical 0,05;31 (2.042), it means that the test of students’ speaking after taught by using sumulation was higher than tcritical, so it can be concluded that null hypothesis (Ho) was rejected, but alternative hypothesis (Ha) was accepted. The conclussion is
“The use of Simulation as a technique significantly improves the students’
English speaking ability on the eleventh grade students of SMK LKIA
PONTIANAK in the academic year of 2015/2016”.
Based on the Hypothesis testing result above it found that there was any
significance improvement on the Students’ English speaking ability at eleventh
grade students of SMK LKIA PONTIANAK in the academic year of 2015/2016, thus the writer continue to find out the effect size the use of simulation for teaching speaking. Measuring Effect Size is a technique used to assess the magnitude of difference between two groups.
measures, the participants, and the data collection. The result of the effect zise as formulated by Ary, Jacobs, and Razavieh (2012:151) can be calculated as follows:
Δ = d
S = Standard deviation pf the pre test and post test
Δ = 1,10/ 1,10
Based on the result above, there was 1,10. It concluded that the effect size of simulation on the Students’ English speaking ability at eleventh grade students of SMK LKIA PONTIANAK in the academic year of 2015/2016 was moderate. It
can be seen with Cohen’s d interval. That score shows that the treatment gave
moderate effect to the students speaking ability. It can be seen from below : 0- 0.20 means weak effect speaking by using simulation was implemented on the eleventh grade students of SMK LKIA Pontianak. The speaking that taugh in this research was focus on fluency, vocabulary, pronounciation, and structure. Most activity in teaching and
learning activity concerned to the practicing of students’ speaking with simulation
technique.
British Broadcasting Cooperation (2003:1) was written that:“The more often you speak, the easier it becomes. Try to think of people you can talk to in English, or places in your town where English is spoken a lot. You need to put
yourself in a position where you need to speak”. In short, the teaching speaking by using simulation could make the students active and speak based on the real life and activity. The treatment was given in three meetings. The topics for each meeting were available in the lesson plan. Mean score on the pretest was 50 meanwhile, on the posttest was 60,9378, it can be rounded into 61. In another side, the data which already obtained base was normally distributed. Based on the computation by seeing the correlation and the t test, tratio= 12,016 which was bigger than tcritical 0,05;31 = 2.042.
succed. It is proved from the Hypotical testing that the null hypothesis is rejected and the effect size of simulation to the eleventh grade students of SMK LKIA Pontianak in the academic year 2015/2016 has moderate effect.
CONCLUSION AND SUGGESTION Conclusion
Based on the result of the research and discussion that had been presented on the previous chapters, the writer determined that the use of simulation was
effective in teaching students’ speaking to the eleventh grade students of SMK
LKIA Pontianak in the academic year of 2015/2016. The result can be seen by the
students’ scores on the pretest and posttest. Thus, refering to the data which had
been calculated, the students had lower scores on the pretest, whereas on the posttest the students had better scores. Otherwise, the writer also stated that the use of simulation was significant in teaching research implied that the speaking. The result of simulation can affect the students’ speaking to the eleventh grade students of SMK LKIA Pontianak in the academic year of 2015/2016. Hence, simulation was eligible to be applied in teaching English especially speaking. For this reason, it can be concluded that null hypothesis is rejected, meanwhile
alternative hypothesis written ”The use of simulation as a technique improves
students’ English speaking ability on the eleventh grade students of SMK LKIA
PONTIANAK in the academic year of 2015/2016 ” is accepted.
Suggestion
The eleventh grade students of SMK LKIA Pontianak who are taught by using simulation have high achievement in speaking. Thus, the writer gives some suggestion: (1) The English teacher. Teaching by using simulation could improve
the students’ speaking, because it has been proved that simulation gives positive
effect in learning speaking for the eleventh grade students of SMK LKIA Pontianak. The teachers should give authentic models to students because it becomes useful input in understanding English in context; not just giving reading
text. They also should pay more attention to the students’ learning style such as an
REFERENCES
Ary, D., Jacobs L.C., and Razavieh, A. (2002) Introduction to Research in Education. USA: Wadsworth Group.
Barrass, R. (2006). Speaking for Yourself. New York: Routledge.
British Broadcasting Cooperation (2003). Better Speaking. England: BBC World.
Brown, H. D. (2001). Teaching by Principles: An Interactive Approach to Language Pedagogy (2nd Ed.) New York: Addison Wesley Longman,
Inc.
Cohen, L., Manion, L. and Morrison, K. (2007). Research Method in Education (6th Ed.).London: Routledge Taylor and Francis Group.
Creswell, J.W. (2012) Educational Research (4th Ed.) Boston: Pearson
Education, Inc.
Harmer, J. (2007). The Practice of English Language Teaching (4th Ed.). UK:
Pearson Education Limited.
Hornby, A. S. (1995). Oxford Advanced Learner’s Dictionary. London: Oxford University Press.
Klein, W. and Perdue, C. (1992). Studies in Second Language Acquisition, Volume 16, Issue 2 . June 1994, pp. 247-248.
Lennon, P. (1990). Investigating fluency in EFL: A qualitative approach. Language Learning, 40 (3), 387-417.
Singh, Y.K. (2006). Fundamental of Research Methodology and Statistics.
New Delhi: New Age International (P) Ltd., Publishers.