Lentera Vol. 15. No. 13. Juni 2015
70
70
ASSESING THE WATER QUALITY TRADING RATIO IN THE
NORTH BOSQUE WATERSHED AS AN ALTERNATIVE
OF MAINTAINING WATER QUALITY
FADHLIANI
Jurusan Teknik Sipil, Universitas M alikussaleh
ABSTRACT
Water quality standard is defined by the level of environment absorptive capacity of pollutants . Total Maximum Daily Load (TMDL) is a program to maintain the water quality in the impaired river segments. Using the Soil Water Assessment Tool (SWAT). The study objective is to assess the possibilities of water quality trading, within the North Bosque Watershed, in term of trading ratios. The model simulation result was not very satisfying, where the calibration of the PO4 has a very high
error. For the soluble phosphorus trading, the model cannot be used as the only tool in defining the trading ratio.
Keywords: Water Quality, Total Maximum Daily Load (Tmdl), Trading Ratio INTRODUCTION
The North Bosque Watershed (NBW) consists of segment 1226, the North Bosque River, and segment 1255, the Upper North Bosque River. The segments are enlisted in the Texas Clean Water Act (CWA) Sect ion 303(d ) List as being impaired, which identifies the insuffic ient achievement of water quality standard. It imp lies that water quality standard is defined by the level of environment absorptive capacity of pollutants. One of the concerning pollutant parameters is nutrient as it is being contributed enormously by a Waste Water Treat ment Plant (WWTP) discharges as Point Source (PS) and dairies/croplands areas run off as Non Point Source (NPS).
The nutrients, phosphorous and nitrogen, of PS can be managed on-site at each plant by controlling the pollutant’s level a llo wed to be discharged also known as Permit Co mp liance System (PCS). Meanwhile managing the impact of NPS where the pollutant distributed within the watershed is somehow difficult. The a mount of nutrient in the streams, wh ich affects the water quality, however is both from PS and NPS. The state of Texas , under the Texas Co mmission on Environmental Qua lity (TCEQ) and the Texas State Soil and Water Conservation Board (TSSWCB), ma intains the water quality in the impaired river
segments by imp le menting the Total Maximu m Daily Load (TM DL) Progra m.
The TMDL not only defines the limit level of pollutant received by the streams or water bodies but also allocates the allowable pollutant discharged by PS and NPS within the watershed. Imple ment ing the pollutant allocation between PS and NPS based on the TMDL progra m in order to ma intain the water quality is plagued by the pollutant level uncertainty fro m the NPS that the pollutant is spatially distributed. The well-known method in assessing the NPS/PS pollutant distribution is a watershed modeling. By modeling, the condition of watershed can be easily analyzed and predicted. However, since a model does not fully represent the detail characteristic of what being modeled, in this case watershed, the best way to solve uncertainties in modeling is calibrat ion. The model be ing used in this study is Soil Water Assessment Tool (SWAT), which developed by the United States Department of Agriculture– Agricultural Research Service (USDA– ARS).
Lentera Vol. 15. No. 13. Juni 2015
71
71
several years the water community has been analyzing the issue from the market based point of view, which is Water Quality (WQ) trading that believed to be the most cost effective. The market is defined similarly to a regular ma rket where the exchange for buying and selling commodit ies occurs. The credit of pollutant is treated as the commodity while the stakeholders or the PS/NPS p roducers within the watershed act as the buyer and the seller. The key factors of the market are : the type of pollutant, demand/ supply-the willingness of the stakeholders to enter the market, and the regulations.Ignoring the regulation and the
stakeholders’ willingness factors, this study objective is to assess the possibilities of water quality trading, within the NBW, in term of trad ing ratios . The watershed model, SWAT built in BASINS 3.1, is used to measure the pollutant distribution within the watershed, which the type of pollutant to be assessed is soluble phosphorous and TMDL to be used as the cap value.
MET HODOLOGY
The watershed is delineated based on the DEM with resolution 30 meter, NHD and USGS/TIAER Station the outlet. Two conditions of delineating the watershed are conducted. First condition is Watershed1 where the outlet selected at TIAER Sta. Watershed1 condition and the simu lation is conducted from January 1990 to Dece mber 2003. The stream flo w is calibrated fro m year 1991 to 2003, as year 1990 is assumed as the warming up stage of model simu lation. The measured data of the stream flow is acquired from USGS Sta. 08095000. The PO4 is calibrated from May 1997 to June 2002. The monitoring data of PO4 is acquired fro m TIA ER Sta. 11956. The calibrat ion result is assumed to be reasonably justified the ne xt simulat ion study of the Watershed2.
The TMDL value to be used for the cap is defined as a 50% reduced of the condition
of mid-1990s, which is also estimated fro m the simulat ion result not from the monitoring data. The reason for that is because the simulat ion result highly bias to the monitoring data. Therefore, the analysis is conducted within the same condition. In this study the TMDL values is based on the simu lation result by averaging the PO4 values from 1995 to 1998.
For analyzing the trading scenario three year conditions are to be analyzed wh ich are 1999, 2001 and 2003 since the simulat ion were conducted only up to 2003. Moreover, since the TMDL condition is based on simu lation year 1995 to 1998, it would be useless to assess the condition of the previous year to that. The three year results are assumed to represent the other two years, 2000 and 2002, that being canceled out from the analysis. The simu lation is conducted in monthly period.
However the pollutant trading analysis is conducted based on the annual value since the monthly simulat ion results are quite erratic. This condition also reported by TNRCC, 2001, where the SWAT was also used for the model simu lation.
“If plotted directly, the raw model
output produces a time series of SRP (Soluble Reactive Phosphorus - PO4) that reflect tempora l variability, which appears erratic and very difficult to interpret. So, review of model output focused on predicted annual average-SRP
concentration.” (TNRCC, 2001)
Lentera Vol. 15. No. 13. Juni 2015
72
72
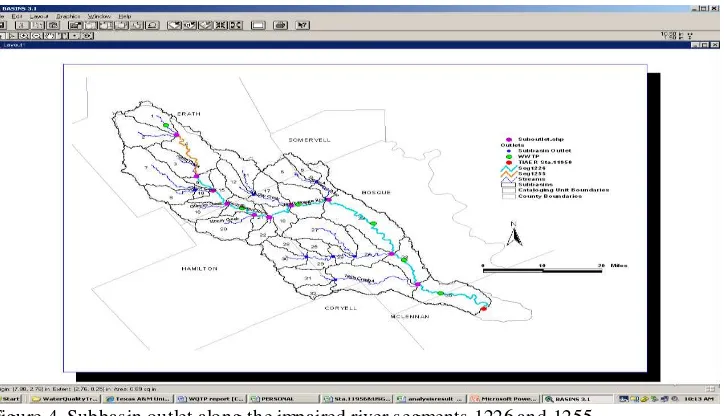
Figure 4. Subbasin outlet along the impaired river segments 1226 and 1255
MODEL
The SWAT in BASINS version 3.1 will be used in this study in developing the watershed model. SWAT is developed by the United States Department of Agriculture–Agricultural Research Service (USDA–ARS) as a tool to model watershed. The BASINS, which stand for Better Assessment Science Integrating Point and Non-point Sources, is a multi-purpose environmental ana lysis system that integrates a geographical informat ion system (GIS), national watershed data, and state-of-the-art environ mental assessment and modeling tools into one convenient package (EPA, 2007).
BASINS a llows the user to prepare input data for SWAT by acquiring GIS data and databases using the data extraction tool in BASINS. The BASINS provides statewide data. Hence, for studying a small watershed, it is recommended to obtain data fro m reliable sources for a smaller scale.
Input Dataset
All the input datasets were downloaded directly fro m the BASINS Interface but land use and weather data. The National Elevation Dataset (NED) which was the Dig ital Elevation Model (DEM) with 30 m resolution was used. Derived fro m BASINS, the NED ca me in elevation’s scale of centimeter. National Hydrography Dataset (NHD) was downloaded and
prepared properly by BASINS direct ly fro m USGS website.
Geographic Informat ion Retrieval and Analysis System (GIRA S land use) acquired fro m EPA website, http://www.epa.gov/waterscience/ftp/basins/ gis_data/huc/12060204/ 12060204_giras.e xe . Soil data was fro m BASINS databases, State Soil Geographic (STATSGO) dominant soil phase. Co llected in 1- by 2-degree topographic quadrangle units and me rged and distributed as statewide coverage. The STATSGO data set was developed by the National Cooperative Soil Survey (NCSS). The Hydrologic Response Unit (HRU), the land use-soil dominant combination, was defined as 10% do minant soil and 5% do minant land use.
Lentera Vol. 15. No. 13. Juni 2015
73
73
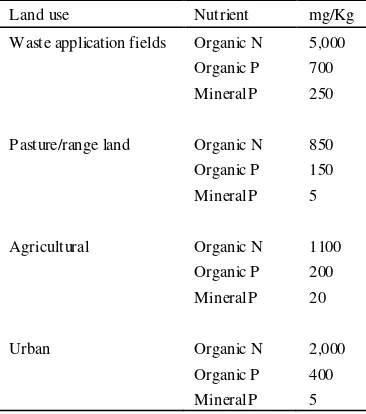
Table 1. Initia l soil nutrient concentrations fro m Steward, 2006 fro m Santhi, 2001Landuse Nutrient mg/Kg
Waste application fields Organic N 5,000 Organic P 700 Mineral P 250
Pasture/range land Organic N 850 Organic P 150 Mineral P 5
Agricultural Organic N 1100 Organic P 200 Mineral P 20
Urban Organic N 2,000
Organic P 400 Mineral P 5
In this study, the waste application fie ld was neglected since the application of dairy fresh manure was assumed applied for the entire watershed of A GRL land use.
The weather data, precipitation and temperature, we re obtained from 11 rain
gauge stations within and around the watershed. Data should be available fro m the National Climatic Data Center (NCDC).
Monthly stream flo w data at Sta. 08095000 was acquired fro m USGS website while water quality data, PO4 at TIAER Sta. 11956 was downloaded from http://wqweb.brazos.org/. The measured data from monitoring stations were used for the model ca libration.
Of point sources in the watershed only four of WWTP, Stephenville, Hico, Iredell and Meridian, were included in the calibrated Watershed1 simu lation. In addition to the four WWTP, Clifton and Valley Mills also included in the study simu lation of Watershed2. The annual data of flow and nutrient loading of the WWTP based on data from November 1995 to March 1998 of TIA ER PR 9911 report by McFarland and Hauck, 1999 (Table 2). Converted to constant daily value as point discharges input for SWAT the data is shown in Table 3.
Table 2. Calcu lated WWTP nutrient loadings for November 1 1995 through March 30, 1998 prorated to an annual basis
Site WWTP Flow (ft3/yr) PO4-P (lbs/yr) TP (lbs/yr) TN (lbs/yr) Stephenville 86,356,413 11,523 14,381 37,542
Hico 3,929,640 658 751 2,872
Iredell 1,224,213 209 1,318 365
Meridian 9,252,524 1,468 1,763 10,214
Clifton 14,936,658 1,621 2,191 7,735
Valley Mills 4,569,215 710 793 4,820
Table 3. Constant daily WWTP nutrient loadings
Site WWTP Flow (m3) PO4-P (kg) TP (kg) TN (kg)
Stephenville 6,699.565 14.320 17.872 46.654
Hico 304.863 0.818 0.933 3.569
Iredell 94.975 0.260 1.638 0.454
Meridian 717.815 1.824 2.191 12.693
Clifton 1,158.792 2.014 2.723 9.612
Valley Mills 354.482 0.882 0.985 5.990
Cali br ati on Watershe d1
The model was calibrated in order to get a reliable result from the simu lation. For this purpose the watershed was delineated by defining USGS Sta. 08095000 or TIA ER Sta. 11956 as the outlet. The author
Lentera Vol. 15. No. 13. Juni 2015
74
74
station for calibration was the availability of measured and monitoring data. the Sutcliffe Method. The Nash-Sutcliffe formu la is, identifies the best fit of the simu lation value to the measured value.In this case, the R2 for stream flow calibrat ion was 0.75. So me para meters were adjusted during the calibration in order to have the model as fit as possible to the real condition of the watershed. The adjusted parameters were genera lized by applying them to all sub basins. To reduce the surface flow, three para meters were adjusted; the Curve Nu mber (CN) was reduced by 8 points, soil available water (SOL_AWC in.sol) was increased by 0.05 points, soil
evaporation compensation factor (ESCO in *.bsn) was decreased by 50%.
To increase the evaporation and to reduce the base flow, three para meters were adjusted as well. Threshold depth of water in shallow aquifer (GW QMN in .gw) was increased by 90%, groundwater re-evaporation coefficient (GW_ REVA P in.gw) was a lso increased by 90%, wh ile the threshold depth of water in shallow aquifer for re-evaporation to occur (REVAPM N in.gw) was decreased by 90%. Aside fro m the adjusted parameters, the channel routing used was Muskingum and the evapotranspiration method used was Penman-Montieth.
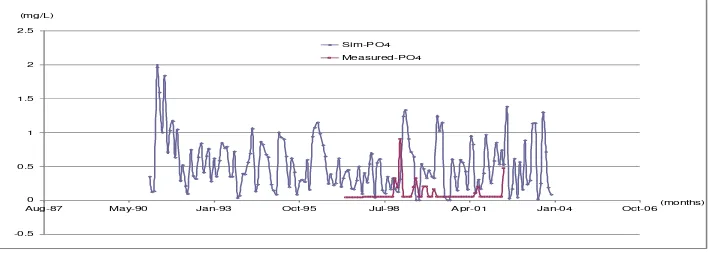
Using the same method, the R2 coeffic ient for the PO4 was -14.761. Most like ly it happened because not much of the real watershed conditions were captured in the simu lation model, for instance the WWTP discharges, which were converted to constant daily condition based on the average annual data of year 1995 to 1998. Some e xtre me adjustments were taken for this calibration. The init ia l nutrients in soil were reduced by 100%. The WWTP discharges nutrients load were reduced by 10% for all the six plants.
Aug-87 May-90 Jan-93 Oct-95 Jul-98 Apr-01 Jan-04 Oct-06 (months) concentration of PO4.
Simulati on Watershe d2
Lentera Vol. 15. No. 13. Juni 2015
75
75
The simulated PO4 for each outlet was produced by the upstream subbasins of the outlet.The model was also simulated for monthly condition from year 1990 to 2003. The simulation results of year 1995 to year 1998 were defined as the TMDL scenario. The result for each outlet was a total PO4 produce by the upstream subbasins, for instance the PO4 at Outlet 1 is a total value of PO4 of subbasin1 and subbasin2. The results at each outlet was then reduced by 50% and averaged out to annual value in Kg/year. Simu lated PO4 results of year 1999, 2001 and 2003 were to co mpare with the TMDL condition.
SUMMERY AND RES ULT
The simulated PO4 of Year 1999 is below the TMDL limit. The annual prec ipitation of
year 1999, 2001 and 2003 fro m some stations does convince that less precipitation occurred in year 1999. It is most likely affect the simu lated PO4 of year 1999 since less precipitation means less run off, which also means less phosphorus being transported or distributed.
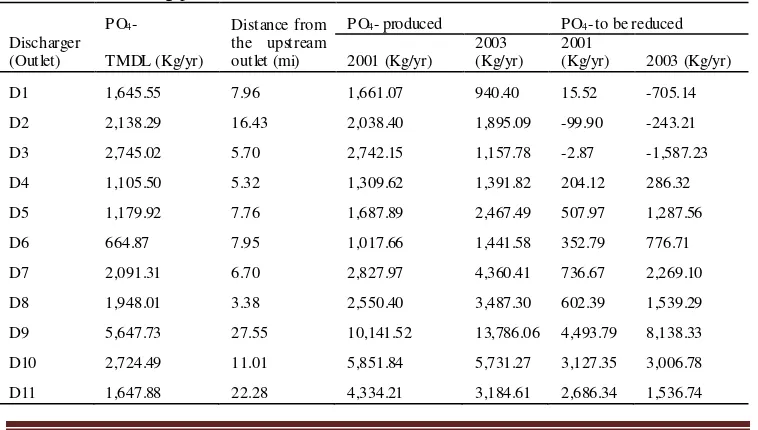
The trading network is developed for year 2001 and 2003, shown in Figure 6. The outlets are now defined as the discharger (D). D1, D2, and D3 are colored green as the PO4 level discharged into the s tream is not alarming; the level is less than the TMDL require ment. D4 to D11 a re colored red as the condition is very alarming where the PO4 discharged into stream is over the TMDL limit. The loading profile of discharger is presented in Table 4.
Figure 6. Subbasins trading network Table 4. PO4 loading profiles
Discharger (Outlet)
PO4- Distance from
the upstream outlet (mi)
PO4- produced PO4- to be reduced
TMDL (Kg/yr) 2001 (Kg/yr)
2003 (Kg/yr)
2001
(Kg/yr) 2003 (Kg/yr)
D1 1,645.55 7.96 1,661.07 940.40 15.52 -705.14
D2 2,138.29 16.43 2,038.40 1,895.09 -99.90 -243.21 D3 2,745.02 5.70 2,742.15 1,157.78 -2.87 -1,587.23
D4 1,105.50 5.32 1,309.62 1,391.82 204.12 286.32 D5 1,179.92 7.76 1,687.89 2,467.49 507.97 1,287.56
D6 664.87 7.95 1,017.66 1,441.58 352.79 776.71
D7 2,091.31 6.70 2,827.97 4,360.41 736.67 2,269.10
D8 1,948.01 3.38 2,550.40 3,487.30 602.39 1,539.29 D9 5,647.73 27.55 10,141.52 13,786.06 4,493.79 8,138.33
D10 2,724.49 11.01 5,851.84 5,731.27 3,127.35 3,006.78 D11 1,647.88 22.28 4,334.21 3,184.61 2,686.34 1,536.74
D1
D2
D3
D4 D5 D6
D7
D8
D9
D10
Lentera Vol. 15. No. 13. Juni 2015
76
76
In this case study, neglecting the comple xit ies condition of PO4 between seller and buyer and assuming the distance factor only, the ratio result is shown in Table 5.The ratio was analyzed in downstream trading condition in order to avoid the occurrence of hot spot, where a very high level of PO4 occurred at one point of the
stream. For this condition, the seller can only be the one in the upstream. Assuming by 5 miles distance the buyer and seller can ma ke up trad ing ratio 1:1, which indicates that for every 1 unit PO4 reduced by the upstream discharger 1 unit PO4 reduced will be achieved by the point downstream within 5 miles distance.
Table 5. Downstream trading ratio, assuming 1 unit PO4 reduced by 5 miles
Outlet 1 2 3 4 5 6 7 8 9 10 11
1 1.00 0.30 0.23 0.18 0.14 0.12 0.10 0.09 0.06 0.05 0.04
2 0.30 1.00 0.88 0.45 0.27 0.19 0.15 0.14 0.08 0.07 0.05
3 0.23 0.88 1.00 0.94 0.38 0.24 0.18 0.16 0.09 0.07 0.05 4 0.18 0.45 0.94 1.00 0.64 0.32 0.22 0.19 0.09 0.08 0.06
5 0.14 0.27 0.38 0.64 1.00 0.63 0.34 0.28 0.11 0.09 0.06 6 0.12 0.19 0.24 0.32 0.63 1.00 0.75 0.50 0.13 0.10 0.07
7 0.10 0.15 0.18 0.22 0.34 0.75 1.00 1.00 0.16 0.12 0.08 8 0.09 0.14 0.16 0.19 0.28 0.50 1.00 1.00 0.18 0.13 0.08
9 0.06 0.08 0.09 0.09 0.11 0.13 0.16 0.18 1.00 0.45 0.15 10 0.05 0.07 0.07 0.08 0.09 0.10 0.12 0.13 0.45 1.00 0.22
11 0.04 0.05 0.05 0.06 0.06 0.07 0.08 0.08 0.15 0.22 1.00
D7 and D8 are just 3.38 miles apart, therefore the reductions of 1 unit PO4 at D7 means reduction 1 unit PO4 at D8. The trading ratio between D7 and D8 is 1:1. D8 and D9 however are 27.55 miles apart, therefore the reductions of 1 unit PO4 at D8 means reduction only 0.18 units PO4 at D9. The trading ratio between D8 and D9 is 1:0.18 or 50:9. In this second condition most like ly the trading option will be even more e xpensive than upgrading the manage ment system by D9. The trad ing ratios of all d ischargers are shown in Table 5. Overa ll, the trading ratios less than 3:1 are likely to benefit the traders.
CONCLUS ION
In this study the author concludes that the model simu lation result was not very satisfying, where the calibration of the PO4 has a very high error. For the soluble phosphorus trading, the model can not be used as the only tool in defining the trading ratio. The monitoring and water quality data have to be included as well. The model
however is very useful in simulat ing changes in the system. The model calibrat ion is also a very important part in any modeling studies. Uncalibrated model should not be used for simulat ing and interpreting any modeling studies.
REFERENCES
Bra zos River Authority (BRA ),
http://www.brazos.org/projectsN orthBosque.asp, Online Citation November 23, 2007.
Fang, F., Kieser, M .S., Hall, D. L., Ott, N.C. and Hippensteel, S.C., 2005. A Preliminary Analysis of
Water Quality Trading
Opportunities in the Great Miami
River Watershed, Ohio.
Lentera Vol. 15. No. 13. Juni 2015
77
77
Lee, M C., and Mankin m K.R., 2007. ASite-Specific Water Quality Trading Ratio: Using GIS and Watershed Modeling to Account for Spatial and Temporal
Variability. Watershed
Management to Meet Water Quality and TMDLS Proceeding of the Fourth Conference 10-14 March 2007, San Antonio Te xas. ASABE Publicat ion Nu mber Phosphorus Export Through Turfgrass Sod Production in Erath County, Texas. Journal of Environmental Management, Vo l. 73: 111-16.
National Climatic Data Center (NCDC), http://www7.ncdc.noaa.gov/IPS/ Allatoona Watershed. Watershed Management to Meet Water Quality Standards and TMDLS Proceedings of the Fourth Conference 10-14 March 2007 (San Antonio, Texas USA) Publication Date 10 March 2007. ASABE Publicat ion Nu mber Regulations: Proceedings of the March 11-13, 2002 Conference, (Fort Worth, Te xas, USA)
Publication Date March 11, 2002. ASAE Publication Nu mber 701P0102.
Stewart, G.R., Munster, C.L., Vietor, D.M ., Arnold, J.G., McFarland, A.M.S., White, R., and Provin, T., 2006.
Simulating Water Quality Improvements in The Upper North Bosque River Watershed Due to Phosphorus Export Through Turfgrass Sod. Journal of Ame rican Soc iety of Agricultural and Biolog ical Engineers. ISSN 0001-2351: 357-366.
TNRCC, 2001. Two Total Maximum Daily Loads for Phosphorus in The North Bosque River, For Segments 1226 and 1255. The Strategic Assessment Div ision TNRCC, Dece mber 2001.
November 2004 EPA 841-B-04-001.
http://www.epa.gov/owow/waters hed/trading/handbook/.
US EPA,
http://www.epa.gov/waterscience /basins/. Online Citation, November 26, 2007