AN EXPERIMENTAL STUDY OF THE AERODYNAMICS
FORCES ACTING ON A TRUCK
Mustofa**
Abstract
The aim of this project is to show the aerodynamics experiment results of a truck in terms of drag coefficient (Cd) within aerodynamics forces. The test was conducted in the Wind Tunnel laboratory at the University of South Australia in the school of Mechanical and Manufacturing Engineering. In addition to the test, fairing and without fairing effects were investigated. Results, Cd truck with fairing was lower than that of with fairing by 0.108 or from 1.518 to 1.41. By adding the fairing on the truck’s cap, fuel consumption could be saved.
Keyword: drag coefficient and fairing
*
Staf Pengajar Jurusan Teknik Mesin Fakultas Teknik Universitas Tadulako, Palu
1. Introduction
As one of the activities over the development in vehicle technology is to conduct a practical study to obtain aerodynamic drag. This is one of the most important factors for vehicles which have great influence on fuel consumption. The effect of cross-wind on the aerodynamic forces is very significant [1]. Traveling through still air the drag force acts on the relatively small frontal area of the truck and is directed nearly parallel to its longitudinal axis. However in the presence of a cross-wind the magnitude of the relative velocity between the truck and the air is increased and its direction is skewed to the direction of motion so that the large side area of the trailer is exposed. The resulting drag force is much larger and it has components both parallel and normal to the direction of the truck’s motion. Substantial lift can also be generated in cases of separated flow over the top of the trailer. The component of drag normal to the longitudinal axis of the truck, referred [2]. Therefore, the more aerodynamic drag is reduced, the more fuel can be saved. Wind tunnel experiment is traditionally method to obtain aerodynamics characteristics. Currently, Computational Fluid Dynamics (CFD) method has been developed. Due to software obstacle, this method can not be uploading through such article.
2. Coefficient of drag (Cd)
Aerodynamic efficiency of a car is determined by its Coefficient of Drag (Cd).
Coefficient of drag is independent of area; it simply reflects the influence to aerodynamic drag by the shape of object. Theoretically, a circular flat plate has Cd 1.0, but after adding the turbulence effect
around its edge, it becomes approximately 1.2. The most aerodynamic efficient shape is water drop, whose Cd is 0.05. However, we cannot make a car
like this. A typical modern car is around 0.30.
3. Calculating the frontal area (m2) and Cd of a
truck
According to the weight and height of the truck measured during the experiment, the frontal area can be calculated as follows:
AF = h . w (m2) ………(1)
Where:
AF = frontal area
h = height of frontal area (mm) w = width of frontal area (mm)
An Experimental Study of the Aerodynamics Forces Acting on A Truck
Table 1. Frontal Area
Model Height (mm) Width (mm) Frontal Area (AF) m2
Truck 158 98.7 0.01559
Table 2. Force balance calibration:
Known mass (pounds) Horizontal force (N) Strain gauge reading
1 4.5 211 2 9 427 3 13.5 633 4 18 855 5 22.5 1088
Prior to conducting the test, the experiment set was
calibrated to get balancing as follow (Table 2).
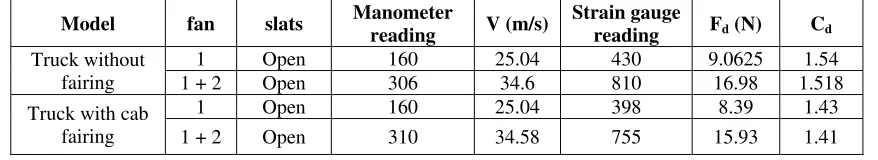
There is only one coefficient of drag for an article which is exposed to a given wind in a certain angel. This means that Cd is not dependent to the
wind speed (fan 1 or fan 1+2). If there is no error during the experiment, the results acquired from experiment 1, truck without fairing for both conditions (fan 1 was ON and fan 1 + 2 were ON) must be the same. However, as it can be observed from the last right column in the table 3, the amount of Cd obtained from the experiment one (fan 1 is
ON) is slightly different from the second experiment (fan 1 and 2 are ON) and this happened for both fairing and without faring truck. The reason is some errors which normally happen over the experiments. The more accurate and calibrate are the measurement instruments, the more reliable outcomes would be achieved,
a. Truck without fairing
To calculate the coefficient of drag, the formula is:
Having the data for strain gauge and horizontal force, we can draw a line. The slope of the line is calculated (m) and is used for calculating force for other amounts of strain gauge; Calculation of slop (m):
With the same calculation for (fan 1+2 is ON), the coefficient of drag (Cd) is 1.518.
Means that the higher the wind speed/aerodynamics forces (fan is ON) is acting on the frontal area of the truck, the bigger is the drag coefficient (Cd) on the
truck with no fairing.
b. Truck with cab fairing
Track with cab fairing where fan 1 was ON; with the same above steps then Cd is 1.43
For both fan 1 and fan 2 are ON, the Cd is 1.41.
According to the calculations under the below table, the coefficient of drag (Cd) calculated for
198
Truck with cab fairing
1 Open 160 25.04 398 8.39 1.43
1 + 2 Open 310 34.58 755 15.93 1.41
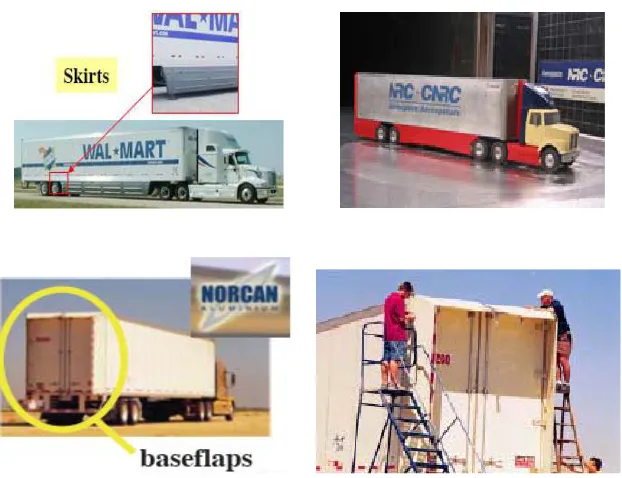
Figure 1. Different type of trucks with fairings
Figure 2. Splitter plate of a truck
Due to the error occurred over the experiment, the average is applied and the percentage of reduction is calculated as follows:
Cd (Without fairing) = (1.54 + 1.518)/2 = 1.529
Cd (With fairing) = (1.43 + 1.41)/2 = 1.42
The percentage of reduction = 100 – (1.42/1.52)
×100 = 7.128 % decrease. However, this is expected to obtain more reduction, provided the errors over the experiment are minimised.
The following pictures are two of the fairings which have been using for decreasing aerodynamic drag for many years (Figure 1):
There are a variety of fairings for trucks, many of which can considerably reduce the aerodynamic drag force. According to the pictures Figure 2, the percentage of reduction for each of them are given:
The Splitter plate decreases the effect of turbulence occurring at this stage. The wind tunnel experiment has shown that this type of fairing can reduce aerodynamic drag up to 4 % [5].
An Experimental Study of the Aerodynamics Forces Acting on A Truck
Figure 3. Skirts, base flaps and side extenders of a trailer
Figure 4. Optimum shape for trucks fairings
The percentage reduction of aerodynamic drag is given below for each of the above fairings:
4 % trailer base –flaps 6 % trailer skirt
2 % gap splitter plate/side extenders --- Total: 12 %
In addition to the fairings shown above, many researches are being conducted to find out the
optimum shape and design for truck fairings. For instance, the figures below are ideas for aerodynamic drag reduction. NASA is one of the institutions which have been making trucks more aerodynamics [6].
Other improvements/modifications can be made to a truck to provide additional improvements in drag reduction. Firstly, the truck frontal area has a significant role to determine its Cd. Therefore, one
200
vortex happening. Thirdly, using a under body fairing and/or modified spoiler at the back of the vehicle to improve the separation and minimise drag. Fourthly, according to the answer of previous question, adding flaps, trailer skirt and gap splitter plate can be feasible approaches to improve in drag reduction. Lastly, using advance simulation software enables engineers to simulate and predict the effect of using different types of fairings on aerodynamic drag reduction.
4. Conclusion
Over the experiment conducted about aerodynamic drag, this is observed that the influence of fairing for reducing aerodynamic drag for track is considerable. Due to the errors over the experiment associated with measurement instruments the result for Cd were slightly different
for each obstacle exposed to wind in wind tunnel. However, wind tunnel is a reliable and good experiment for acquiring Cd.
J. Bettle, A.G.L. Holloway, J.E.S. Venart, 2003, A computational study of the aerodynamic forces acting on a tractor-trailer vehicle on a bridge in cross-wind, Journal of Wind Engineering and Industrial Aerodynamics 91, page 573–592.
http://www1.eere.energy.gov, accessed 10 September 2006.
http://gcep.stanford.edu/pdfs, accessed 2 October 2006
http://www.nhtsa.dot.gov/cars/testing/ncap, accessed 15 November 2006