AN EXPERIMENTAL STUDY OF THE AERODYNAMICS
FORCES ACTING ON A TRUCK
Mustofa**
Abstract
The aim of this project is to show the aerodynamics experiment results in the f ront area of a truck in terms of drag coefficient (Cd) within aerodynamics forces. The test was conducted in the Wind Tunnel laboratory
at the University of South Australia in the school of Mechanical and Manufacturing Engineering. To perform the test, wood scaled dimensions was used. In addition to the test, fairing and without fairing effects were investigated. Results, Cd truck with fairing was lower than that of with fairing by 0.108 or from 0.518
to 0.41. By adding the fairing on the truck’s cap, fuel consumption could be saved.
Keyword: drag coefficient and fairing
*
Staf Pengajar Jurusan Teknik Mesin Fakultas Teknik Universitas Tadulako, Palu
1. Introduction
As one of the activities over the development in vehicle technology is to conduct a practical study to obtain aerodynamic drag. This is one of the most important factors for vehicles which have great influence on fuel consumption. The effect of cross-wind on the aerodynamic forces is very significant as stated by Taylor (2006) in his excellent lecture notes. Traveling through still air the drag force acts on the relatively small frontal area of the truck and is directed nearly parallel to its longitudinal axis. However in the presence of a cross-wind the magnitude of the relative velocity between the truck and the air is increased and its direction is skewed to the direction of motion so that the large side area of the trailer is exposed. The resulting drag force is much larger and it has components both parallel and normal to the
direction of the truck’s motion. Substantial lift can
also be generated in cases of separated flow over the top of the trailer.
The component of drag normal to the longitudinal axis of the truck is referred to Bettle et al., 2003. Therefore, the more aerodynamic drag is reduced, the more fuel can be saved. Wind tunnel experiment is traditionally method to obtain aerodynamics characteristics.
2. Coefficient of drag (Cd)
Aerodynamic efficiency of a car is
determined by its coefficient of drag (Cd).
Coefficient of drag is independent of area; it simply reflects the influence to aerodynamic drag by the shape of object. Theoretically, a circular flat plate
has Cd 1.0, but after adding the turbulence effect
around its edge, it becomes approximately 1.2. The most aerodynamic efficient shape is water drop,
whose Cd is 0.05. However, we cannot make a car
like this. A typical modern car is around 0.30.
In general, to study vehicle’s drag, Ahmed
An Experimental Study of the Aerodynamics Forces Acting on A Truck
3. Methodology
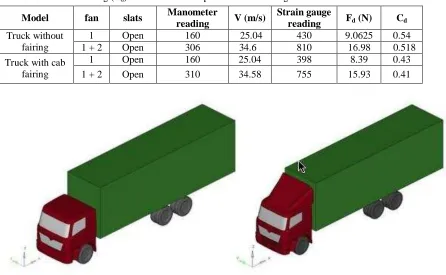
To perform the Wind tunnel test, a scaled
dimension model is produced as in Figure 1. Before
testing, calculating the frontal area (m2) is done.
Based on the weight and height of the truck that was measured, the frontal area can be calculated as follows: The measurement result is depicted in Table 1 while Table 2 shows the force balance calibration of Wind tunnel apparatus.
Table 1. Frontal Area
Model Height (mm) Width (mm) Frontal Area (AF) m2
Truck 158 98.7 1.559
Table 2. Force balance calibration:
Known mass (pounds) Horizontal force (N) Strain gauge reading
1 4.5 211
2 9 427
3 13.5 633
4 18 855
5 22.5 1088
There is only one coefficient of drag for an article which is exposed to a given wind in a certain
angel. This means that Cd is not dependent to the observed from the last right column in the Table 3,
the amount of Cd obtained from the experiment one
(fan 1 is active) is slightly different from the second experiment (fan 1 and 2 are active) and this happened for both fairing and without faring truck. The reason is some errors which normally happen over the experiments. The more accurate and calibrate are the measurement instruments, the more reliable outcomes would be achieved.
a. Truck without fairing
To calculate the coefficient of drag, the formula is: calibrate the apparatus, height and pressure gauge reading are calculated as follows:
198
Track with cab fairing where fan 1 was active;
with the same above steps then Cd is 0.43 .
4. Results and Analysis
The below table figures out the result of model test.
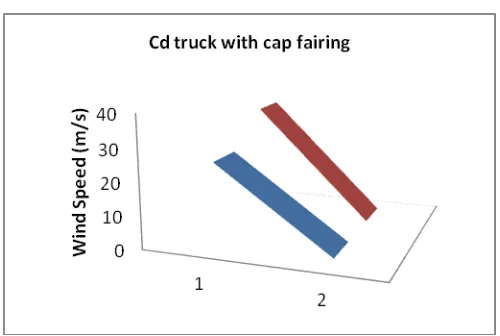
Table 3. Coefficient of drag (Cd) for a truck with cap and without fairing
Model fan slats Manometer
reading V (m/s)
Strain gauge
reading Fd (N) Cd
Truck without fairing
1 Open 160 25.04 430 9.0625 0.54
1 + 2 Open 306 34.6 810 16.98 0.518
Truck with cab fairing
1 Open 160 25.04 398 8.39 0.43
1 + 2 Open 310 34.58 755 15.93 0.41
An Experimental Study of the Aerodynamics Forces Acting on A Truck
Figure 2. Coeficient drag of truck without fairing
Figure 3. Coeficient drag of truck with fairing
Both Figure 2 and 3 have shown the wind speed effect to the drag coeficient on the truck with
and without fairing. Different with 10 m/s, Cd
decrease slowly. It is clearly seen that truck with fairing, drag coefficient is lower than of the without
fairing. That’s why, currently trucks use the cap
fairing, particularly for trailer truct. Due to the tiny error occurred over the experiment, the average is applied and the percentage of reduction is
formulated as Cd (without fairing) is (0.54 +
0.518)/2 equal 0.529; with fairing, Cd is 0.42 with
the same means. In addition to the fairings shown above, many researches are being conducted to find
moreaerodynamics,
(www.nasaexplores.nas.gov/show).
Other improvements/modifications can be made to a truck to provide additional improvements in drag reduction. Firstly, the truck frontal area has
a significant role to determine its Cd. Therefore, one
200
5. Conclusion
Over the experiment conducted about aerodynamic drag, this is observed that the influence of fairing for reducing aerodynamic drag for track is considerable. Due to the errors over the
experiment associated with measurement
instruments the result for Cd were slightly different
for each obstacle exposed to wind in wind tunnel. However, wind tunnel is a reliable and good
experiment for acquiring Cd. It is recommended to
use computer simulation with the same test data.
Acknowledgments
The author would like to thank Dr. Elizabeth Smith for her time and commitment in ensuring the smooth running of Wind tunnel test during the course of the work
6. References
C.J. Baker and N.D. Humphreys, 1996, Assessment
of the adequacy of various wind tunnel techniques to obtain aerodynamic data for ground vehicles in cross winds, Journal of
Wind Engineering and Industrial
Aerodynamics 6, page 49-68.
E. Guilmineau, 2008, Computational study of flow
around a simplified car body, Journal of
Wind Engineering and Industrial
Aerodynamics 96, page 1207-1217.
J. Bettle, A.G.L. Holloway & J.E.S. Venart, 2003,
A computational study of the aerodynamic forces acting on a tractor-trailer vehicle on a bridge in cross-wind, Journal of Wind Engineering and Industrial Aerodynamics
91, page 573–592.
L. Taylor, 2006, Lecture Notes in Development in
Vehicle Technology course, the School of Advanced Mechanical and Manufacturing Engineering, UniSA, South Australia.