Siti Hasmah Digital Library
AUTOMATED CLASSIFICATION AND
ANNOTATION OF COMPUTED TOMOGRAPHY
BRAIN IMAGES
TONG HAU LEE
DOCTOR OF PHILOSOPHY
MULTIMEDIA UNIVERSITY
SEPTEMBER 2015
The quality of this reproduction is dependent upon the quality of the copy submitted.
In the unlikely event that the author did not send a complete manuscript
and there are missing pages, these will be noted. Also, if material had to be removed, a note will indicate the deletion.
This work is protected against unauthorized copying under Title 17, United States Code Microform Edition © ProQuest LLC.
ProQuest LLC.
Siti Hasmah Digital Library
AUTOMATED CLASSIFICATION
AND ANNOTATION OF COMPUTED
TOMOGRAPHY BRAIN IMAGES
BY
TONG HAU LEE
B.Sc. Physics (Hons), University of Science Malaysia, Malaysia
M.Sc. IT, University of Science Malaysia, Malaysia
THESIS SUBMITTED IN FULFILMENT OF THE
REQUIREMENT FOR THE DEGREE OF
DOCTOR OF PHILOSOPHY
(by Research)
in the
Faculty of Computing and Informatics
MULTIMEDIA UNIVERSITY
MALAYSIA
September 2015
Siti Hasmah Digital Library
ii
© 2015 Universiti Telekom Sdn. Bhd. ALL RIGHTS RESERVED.
Copyright of this thesis belongs to Universiti Telekom Sdn. Bhd. as
qualified by Regulation 7.2 (c) of the Multimedia University Intellectual
Property and Commercialisation Policy. No part of this publication may
be reproduced, stored in or introduced into a retrieval system, or
transmitted in any form or by any means (electronic, mechanical,
photocopying, recording, or otherwise), or for any purpose, without the
express written permission of Universiti Telekom Sdn. Bhd. Due
acknowledgement shall always be made of the use of any material
contained in, or derived from, this thesis.
Siti Hasmah Digital Library
iii
DECLARATION
I hereby declare that the work has been done by myself and no portion of the work contained in this thesis has been submitted in support of any application for any other degree or qualification on this or any other university or institution of learning.
_______________
Tong Hau Lee
Siti Hasmah Digital Library
iv
ACKNOWLEDGEMENT
I would like to express my utmost gratitude to the following people who have contributed and supported me throughout the completion of my studies. To my supervisor, Associate Prof. Dr. Mohammad Faizal Ahmad Fauzi and co-supervisor, Associate Prof. Dr. Haw Su Cheng, thank you for your patience in bearing with me as well as for the countless technical and life advice that you have given me. To my loving wife Tan Chai Hoon, thank you for encouraging and challenging me to stay the course and not give up in my studies. To my colleagues and friends, Dr. Ng Hu, Mr. Timothy Yap, Dr. Joshua Yap, and Mr. Looi Eng Seng; thank you for showing me that it can be done, and for lifting my spirits when things weren’t going so well. I would like to thank Dr. Fatimah Othman from Putrajaya Hospital, Dr. Ezamin Abdul Rahim and Dr. Noraini Abdul Rahim from Serdang Hospital for the image acquisition, annotation and consultation. Last but not least, thanks be to God who provides for all things and makes all things work for the good of those whom He called.
Siti Hasmah Digital Library
v
DEDICATION
This thesis is dedicated to my family members.
Siti Hasmah Digital Library
vi
ABSTRACT
Brain hemorrhage detection is clinically crucial for the patients having head trauma and neurological disturbances. Early finding and accurate diagnosis of the brain abnormalities is one of the key contributions for the execution of the successful therapy and proper treatment. Multi-slice Computed Tomograph (CT) scans are widely employed in today’s examination of head traumas due to its effectiveness to disclose some abnormalities such as brain hemorrhages and so on. However, radiologists have to manually analyse the CT slices for the presence of brain hemorrhages. Due to the large volume of CT scan examinations, it is important to develop a computerised system that can assist the radiologists to automatically detect the presence of the brain abnormalities as well as automatically retrieve the images.
This thesis presents an automated annotation and classification of the CT brain images. The main objective is to propose a new methodology to annotate and classify the different types of brain hemorrhages which are intra-axial, subdural and extradural hemorrhages. Besides, this thesis also aims to evaluate and investigate the effectiveness and suitability of different segmentation and classification techniques as well as introduce the new features for the classification.
Three separate annotation processes are proposed which are the annotation of intracranial hemorrhagic slices, annotation of intra-axial hemorrhages, and annotation of subdural and extradural hemorrhages. The annotation of hemorrhagic slices is a two-class classification problem to differentiate the non-hemorrhagic slices from the hemorrhagic slices. The annotation of the intra-axial slices is also a two-class two-classification problem to distinguish the intra-axial and non-intra-axial slices. Lastly, the annotation of subdural and extradural hemorrhages is a three-class classification problem to classify the subdural, extradural and non-extra-axial.
The contributions of this research are many folds. The main contribution of this work is a methodology of adopting the three annotation processes rather than the
Siti Hasmah Digital Library
vii
employment of a single annotation process for conventional methods. Besides, in intra-axial slices annotation, a novel midline approach is proposed to better partition the left and right hemispheres. On top of these, a two-level auto-enhancement is proposed to enhance the contrast of the images prior to the annotation process. For annotation of subdural and extradural, new features are also proposed. For the segmentation part, from the experimental results, K-means clustering produced the best segmentation results with the least over-segmentation problem. Lastly for contribution in classification part, the experimental results showed that Support Vector Machine (SVM) with Radial Basis Function (RBF) scored the highest precision and recall for all three annotation processes.
Two datasets obtained from two collaborating hospitals are used to evaluate the proposed system. In total, there are 519 CT brain images used. The performance of the three separated annotation is evaluated by using different classifiers which are support vector machine, linear discriminant analysis and fuzzy k-nearest neighborhood. From the experimental results, the highest correct classification rate for the annotation of hemorrhagic slices, annotation of intra-axial and annotation of subdural and extradural are 90.8%, 88.8% and 90.6% respectively.
Siti Hasmah Digital Library
viii
TABLE OF CONTENTS
COPYRIGHT PAGE ii
DECLARATION iii
ACKNOWLEDGEMENT iv
DEDICATION v
ABSTRACT vi
TABLE OF CONTENTS viii
LIST OF TABLES xii
LIST OF FIGURES xiv
LIST OF ABBREVIATIONS xvii
CHAPTER 1: INTRODUCTION 1
1.1 Research Overview 1
1.2 Motivation of Research 6
1.3 Research Problems 7
1.4 Research Objectives 9
1.5 Scope of Research 9
1.6 Contributions to Knowledge 12
1.7 Research Approach Overview 13
1.8 Organization of the Thesis 14
CHAPTER 2: LITERATURE REVIEW 16
2.1 Overview of Medical Imaging 16
2.2 Overview of Adopted Medical Imaging: Computed Tomography 17
2.3 Overview of Brain Abnormalities 18
2.4 Type of Intracranial Hemorrhages 21
2.5 Intracranial Hemorrhage Detection Approach 22
2.6 Summary 39
CHAPTER 3: PREPROCESSING, CLUSTERING AND DETECTION 41
Siti Hasmah Digital Library
3.3.3 Hemorrhagic Regions Contrast Enhancement 47
3.4 Potential Hemorrhagic Region Clustering 49
3.4.1 Otsu Method 50
3.4.2 K-means Segmentation 51
3.4.3 FCM Segmentation 52
3.4.4 Expectation-maximization Segmentation 53
3.5 Midline Detection 55
3.6 Image Enhancement Techniques Discussion and Comparison Results 57 3.6.1 Original Image Contrast Enhancement Results and Discussion 58 3.6.2.Hemorrhagic Region Contrast Enhancement Results and Discussion 62
3.7 Clustering Results and Discussion 62
3.8 Results of the Midline Approach and Discussion 64
CHAPTER 4: ANNOTATION AND CLASSIFICATION
66
4.1 Overview 66
4.2 Annotation Process of Hemorrhagic Slice 67
4.3 Annotation Process of Intra-Axial 73
4.4 Annotation Process of Subdural and Extradural 73
4.5 Feature Selection Techniques 83
4.5.1 Particle Swarm Optimization Search 83
4.5.2 Tabu Search 84
4.5.3 Ranker 84
4.6 Classification Techniques 84
4.6.1 LDA 86
4.6.2 SVM 87
Siti Hasmah Digital Library
x
4.6.3 Fuzzy k-NN 88
4.7 Performance Evaluation Measurements 90
CHAPTER 5: EXPERIMENTAL RESULTS AND DISCUSSION 92
5.1Experimental Setup 92
5.1.1 Architecture of Experiments 92
5.1.2 Datasets for Performance Evaluation 93
5.1.3 Classification Techniques 95
5.1.4 Feature Selection Techniques 96
5.1.5 Performance Evaluation 96
5.2 Hemorrhagic Slice Classification 97
5.2.1 Parameter Fine-Tuning 98
5.2.2 Overall Results and Discussion for Hemorrhagic Slice Classification 98 5.2.3 Breakdown Results and Discussion for Hemorrhagic Slice
Classification
101
5.3 Intra-axial Classification 104
5.3.1 Parameter Fine-Tuning 104
5.3.2 Overall Results and Discussion for Intra-axial Slice Classification 104 5.3.3 Breakdown Results and Discussion for Intra-axial Slice Classification 106
5.4 Subdural and Extradural Classification 108
5.4.1 Parameter Fine-Tuning 109
5.4.2 Overall Results and Discussion for Subdural Region and Extradural Region Classification
109
5.4.3 Breakdown Results and Discussion for Subdural Region and Extradural Region Classification
111
5.5 Summary of Overall Three-Stage Classification Results 116
5.6 Summary of Breakdown Classification Results 118
5.7 Extended Experimental Results of Retrieval 119
CHAPTER 6: CONCLUSION AND FUTURE WORKS 126
6.1 Summary of Overall Research Work 126
Siti Hasmah Digital Library
xi
6.2 Contributions 128
6.3 Limitations 129
6.4 Future Works 129
APPENDIX A 130
REFERENCES 142
PUBLICATION LIST 157
Siti Hasmah Digital Library
Table 2.1 Summary of the Existing Symmetric Approaches 36
Table 2.2 Summary of the Existing Global-Based Feature Extraction
Approaches
36
Table 2.3 Summary of the Existing Thresholding Techniques 37
Table 2.4 Summary of the Existing Clustering or Segmentation
Techniques
38
Table 3.1 Numerical Results of Original Image Contrast Enhancement 60
Table 3.2 Numerical Results of Hemorrhagic Regions Contrast
Enhancement
61
Table 5.1 Type of Slices and Their Quantities 94
Table 5.2 The Parameter Values Set for Ranker, PSO and Tabu 98
Table 5.3 Overall Results of the Hemorrhagic Classification by Using Ranker
100
Table 5.4 Overall Results of the Hemorrhagic Classification by Using PSO 100
Table 5.5 Overall Results of the Hemorrhagic Classification by Using Tabu
100
Table 5.6 Confusion Matrix 101
Table 5.7 Breakdown Results of the Normal Slice and Hemorrhagic Slice
by Using Ranker
102
Table 5.8 Breakdown Results of the Normal Slice and Hemorrhagic Slice
by Using PSO
103
Table 5.9 Breakdown Results of the Normal Slice and Hemorrhagic Slice
by Using Tabu
103
Table 5.10 The Parameter Values Set for Ranker, PSO and Tabu 104
Siti Hasmah Digital Library
xiii
Table 5.11 Overall Results of Intra-Axial Classification for Ranker 105
Table 5.12 Overall Results of Intra-Axial Classification for PSO 106
Table 5.13 Overall Results of Intra-Axial Classification for Tabu 106
Table 5.14 Breakdown Results of the Non Intra Axial Slice and Intra Axial Slice by Using Ranker
107
Table 5.15 Breakdown Results of the Non Intra Axial Slice and Intra Axial Slice by Using PSO
108
Table 5.16 Breakdown Results of the Non Intra Axial Slice and Intra Axial Slice by Using Tabu
108
Table 5.17 The Parameter Values Set For Ranker, PSO and Tabu 109
Table 5.18 Overall Results of Region Classification for Ranker 110
Table 5.19 Overall Results of Region Classification for PSO 110
Table 5.20 Overall Results of Region Classification for Tabu 111
Table 5.21 Breakdown Results of Region Classification by Using Ranker 112
Table 5.22 Breakdown Results of Region Classification by Using PSO 113
Table 5.23 Breakdown Results of Region Classification by Using Tabu 114
Table 5.24 Comparison Results of Twelve and Five Features 115
Table 5.25 Ranked Contribution of Each Features by Ranker 115
Table 5.26 Eight Features Selected by PSO and Tabu Search 116
Table 5.27 Precision Obtained by Using “Hemorrhage” 124
Table 5.28 Precision Obtained by Using “Intra-Axial” 125
Table 5.29 Precision Obtained by Using “Extradural” 125
Siti Hasmah Digital Library
xiv
LIST OF FIGURES
Figure 1.1 Framework of CBIR in Medical 5
Figure 1.2 Tree Chart for the Hemorrhages’ Hierarchy 10
Figure 1.3 Example of Intra-Axial Hemorrhage 10
Figure 1.4 Example of Subdural Hemorrhage 11
Figure 1.5 Example of Extradural Hemorrhage 11
Figure 1.6 Overview of Proposed Methodology 14
Figure 2.1 Anatomy of Brain, Reproduced from (Brain & Nervous System Health Center, 2009)
19
Figure 2.2 Subarachnoid Hemorrhage Marked by An Arrow as A White Area in the Center and Stretching Out
22
Figure 2.3 Seeded Region-Growing Segmentation, Reproduced from (Matesin, et al., 2001)
24
Figure 2.4 Midline Locating from Contour, Reproduced from (Saito, et al., 2011)
26
Figure 2.5 Division of Sub-Regions, Reproduced from (Saito, et al., 2011) 26 Figure 2.6 Categorization of Intracerebral hemorrhage, Reproduced from
(Datta, Datta & Biswas, 2011)
27
Figure 2.7 Detected Boundaries of the Hemorrhagic Regions, Reproduced from (Bhadauria & Dewal, 2012)
31
Figure 2.8 Images Showing the Gold Standard (First Column), Shrinking’s Results (Second Column) and Expansion’s Results (Third Column), Reproduced from (Bhanu et al., 2012)
32
Figure 2.9 Overview of HHNN, Reproduced from (Leena, 2015) 34
Figure 3.1 Flowchart for Clustering and Detection 42
Figure 3.2 Contrast Stretching System 43
Figure 3.3 Constructed Histogram 45
Figure 3.4 Absolute First Difference 45
Figure 3.5 Original Images 45
Figure 3.6 Contrast Enhanced Images 46
Siti Hasmah Digital Library
xv
Figure 3.7 Obtained Parenchyma 47
Figure 3.8 Hemorrhagic Enhanced Images 48
Figure 3.9 Illustration of Midline Acquisition by Using Midpoints 55 Figure 3.10 (a) Contour of Parenchyma Area (b) Top Sub-Contour (c)
Bottom Sub-Contour (d) Line Scanning for Local Maxima Detection (e) Shortened Searching Line (f) Located Highest Average Value of Intensity Point
57
Figure 3.11 Original Images before the Contrast Enhancement 60 Figure 3.12 Enhanced Images by Proposed Method (First Row), Histogram
Equalization (Second Row) and Adaptive Histogram (Third Row)
61
Figure 3.13 Clustering Results by (a) Otsu Thresholding (b) FCM Clustering (c) K-Means Clustering and (d) EM Clustering
63
Figure 3.14 Detected Midline by Existing Approach (First Column) and Proposed Approach (Second Column)
65
Figure 4.1 Hierarchy for the Three Annotation Processes 67 Figure 4.2 Illustration for the Acquisition of the Texture Unit for 3x3
Sub-Matrix
69
Figure 4.3 (a) Right Hemisphere (b) Edge Histogram 71
Figure 4.4 (a) Left Hemisphere (b) Edge Histogram 71
Figure 4.5 (a) Subdural Region 76
(b) Inner Contour with Located Endpoints 77
(c) Outer Contour with Located Endpoints 77
(d) Inner Closed Contour 77
(e) Outer Closed Contour 77
(f) Filled Up Inner Contour 77
(g) Filled Up Outer Contour 77
(h) Overlapping Area 77
Figure 4.6 (a) Original Shape (b) Remodeling Shape Resulted of IDFT 80 Figure 4.7 An Illustration for Five Nearest Neighbourhoods 90
Figure 5.1 Architecture of Experiments 93
Siti Hasmah Digital Library
xvi
Figure 5.2 Examples of Different Kinds of Slices: (a) Intra-axial (b) Extradural (c) Subdural (d) Normal
94
Figure 5.3 Summary of Recall Generated by RBF SVM for Three-Stage
Classification 117
Figure 5.4 Summary of Precision Generated by RBF SVM for Three-Stage
Classification 117
Figure 5.5 Twenty Five Most Relevant Retrieval Results by Keyword
“Hemorrhage” 120
Figure 5.6 Twenty Five Most Relevant Retrieval Results by Keyword
“Intra-axial” 121
Figure 5.7 Twenty Five Most Relevant Retrieval Results by Keyword
“Extradural” 122
Figure 5.8 Twenty Five Most Relevant Retrieval Results by Keyword
“Subdural” 123
Siti Hasmah Digital Library
xvii
LIST OF ABBREVIATIONS
CBIR Content-based Image Retrieval
CCDCFD Sum of Centroid Contour Distance Curve Fourier Descriptor
CCR Correct Classification Rate
CT Computed Tomography
DICOM Digital Imaging and Communications in Medicine
EM Expectation-Maximization
FCM Fuzzy C-Means
GL Gray Level
GLCM Gray Level Co-Occurrence Matrices
ICH Intracerebral Hemorrhage
k-NN k-Nearest Neighbors
LBP Local Binary Pattern
LDA Linear Discriminant Analysis
MRI Magnetic Resonance Image
PET Positron Emission Tomography
PSO Particle Swarm Optimization
RBF Radial Basis Function
RL Run Length
ROI Region of Interest
SBIR Semantics-based Image Retrieval
SPECT Single Photon Emission Computed Tomography
SVM Support Vector Machine
TBIR Text-based Image Retrieval
Siti Hasmah Digital Library
descriptions of the objectives and deliverables of the research. At last, the structure of the thesis is summarized.1.1Research Overview
In medical field, image serves as one of the important tools for diagnosis, treatment monitoring and management of the diseases of the patients. The use of hardcopy medical image formats such as analog screen films are decreasing. Space of storage, maintenance and film material directly contributed to the decreasing popularity. On the other hand, the usage of softcopy format of medical images is gaining its popularity as they present less of the hardcopy image problems. Besides, the digital medical images allow the digital image processing for the implementing of the automated computer-aided system. The most commonly used Digital Imaging and Communications in Medicine (DICOM) format. With DICOM, a benchmark for image communications has been established and patient data can be stored with the actual digital images. The DICOM header consists of the tags to decode the body part, patient position, scanner information and modality (NEM, 2009; Kimura et al., 2002).
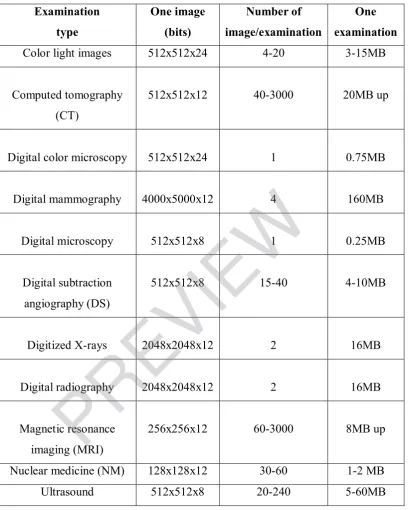
The digital medical image databases that have been used for diagnosis, therapy and decision making come from images of various scanning likes X-ray, Computed Tomography (CT) scan, Magnetic Resonance Image (MRI), ultrasound, mammogram and so on. The overview of different modalities in terms of their sizes, types and number of images per examination is depicted in Table 1.1.
Siti Hasmah Digital Library
2
Table 1.1: Types and Sizes of Different Modalities of Digital Medical Images (Huang, 2004).
Multi-slice CT scans are extensively utilized in today’s analysis of head traumas due to its effectiveness to unveil some abnormalities such as calcification, hemorrhage and bone fractures. In addition, it is more economical, requires shorter imaging time and possesses widespread availability (Ragavi & Nija, 2014). These
Examination
Color light images 512x512x24 4-20 3-15MB
Computed tomography (CT)
512x512x12 40-3000 20MB up
Digital color microscopy 512x512x24 1 0.75MB
Digital mammography 4000x5000x12 4 160MB
Digital microscopy 512x512x8 1 0.25MB
Digital subtraction angiography (DS)
512x512x8 15-40 4-10MB
Digitized X-rays 2048x2048x12 2 16MB
Digital radiography 2048x2048x12 2 16MB
Magnetic resonance imaging (MRI)
256x256x12 60-3000 8MB up
Nuclear medicine (NM) 128x128x12 30-60 1-2 MB
Ultrasound 512x512x8 20-240 5-60MB
Siti Hasmah Digital Library
3
enable patients with size too large for MRI scanner, and patients that are unable to stay motionless due to aging or pain to perform the scanning for some diagnosis purpose. For these reasons, this research work aims to explore the segmentation methods and classification methods for brain CT images.
An enormous amount of CT images are generated in modern-day hospitals. The steady growth number of the images provides an excellent opportunity and resources for the researchers in the medical area. As such, image retrieval particularly in medical domain, becomes exciting and rapidly expanding research area. Image retrieval can be defined as a finding of similar images based on the user’s query from a significant archive with the assistance of certain key elements attached with the images or extracted features from the images. Medical image retrieval is gaining importance in the area of diagnosis, research and medical education. The crucial objective of medical image retrieval system comprises organizing, retrieving and indexing of huge collection images in extremely effectual and efficient way.
Generally, the three main categories of medical images retrieval techniques (Henning et al., 2004; Dimitrovski et al., 2015) are Text-based Image Retrieval (TBIR), Content-based Image Retrieval (CBIR) and Semantics-based Image Retrieval (SBIR), with TBIR being the most conventional system. TBIR only provides textual information about the patients. The textual information is based on either indexing or captions that related with the images manually. Therefore, in TBIR, medical images are retrieved based on patient’s identity number, name and some other keywords manually annotated by medical expert and they are normally stored in a relational database (Akbarpour, 2013; Chuctaya et al., 2011). However, TBIR experiences from some drawbacks such as the extent of effort and time needed to physically interpret each image. Furthermore, the difference in human perception while illustrating the images may causethe incorrectness in the retrieval process later on.
Siti Hasmah Digital Library
4
Therefore, in the last few decades, we have CBIR. CBIR can be defined as a technique to retrieve the images based on the low-level features like color, shape, texture and spatial relationship and to index the images with the minimum human involvement (Akbarpour, 2013; Akgül et al., 2011; Smeulders et al., 2000 and Rui, Huang, & Chang, 1999).
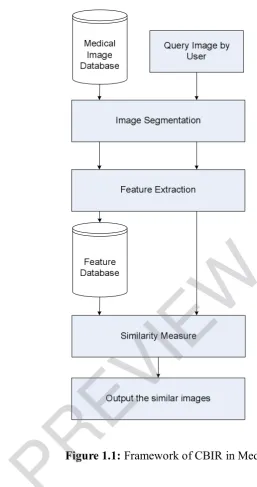
Basically, CBIR in medical domain is to retrieve the utmost visually alike images to a provided query image from a medical database. For example, finding the brain cancer tumor images, skin images, lung images and so on from a medical image collection. The general framework of CBIR in medical domain is outlined in Figure 1.1. Several advancements have been made in the area of medical CBIR (Long, Antani, Deserno, & Thoma, 2009; Müller & Deserno, 2011; Ramamurthy, Chandran, Aishwarya, & Janaranjani; 2011). Some example of ares are pathology (Zheng, Wetzel, Gilbertson, & Becich, 2003), head (Simonyan, Modat, Ourselin, Cash, Criminisi, & Zisserman, 2012), lung (Shyu, Brodley, Kak, Kosaka, Aisen, & Broderick, 1999), and mammograms (El-Naqa, Yang, Wernick, Galatsanos, & Nishikawa, 2002). However, CBIR systems do not intent to substitute the physician by predicting the disease of a specific case but to help the physician in analysis as a second opinion. The visual features of a disease contain diagnostic data and often times visually alike images relate to the same disease group. By referring the outcome of a CBIR system, the physicians can obtain more assurance in his/her conclusion or even can mull over other possibilities.
Siti Hasmah Digital Library
5
Figure 1.1: Framework of CBIR in Medical
The other group of image retrieval system, SBIR has emerged since the early 2000’s. The basic idea of semantics-based is to retrieve the images based on keywords. Both SBIR and TBIR exploit the similar method to the image retrieval which is by using the keywords for the retrieval. However, TBIR needs human assistance in annotation of each image while in SBIR, images are automatically annotated. In SBIR, the principal objective is to acquire the semantics of the images, by way of automatic image annotation. In medical field, semantic textual labels are attached to the images such as hemorrhage, infarct and so on (Kalpathy-Cramer & Hersh, 2007). In order to obtain the semantic textual label, images are segmented