This Provisional PDF corresponds to the article as it appeared upon acceptance. Fully formatted PDF and full text (HTML) versions will be made available soon.
Investigating determinants of out-of-pocket spending and strategies for coping
with payments for healthcare in southeast Nigeria
BMC Health Services Research2010,10:67 doi:10.1186/1472-6963-10-67 Obinna E Onwujekwe ([email protected])
Benjamin SC Uzochukwu ([email protected]) Eric N Obikeze ([email protected])
Ijeoma Okoronkwo ([email protected]) Ogbonnia G Ochonma ([email protected])
Chima A Onoka ([email protected]) Grace Madubuko ([email protected])
Chijioke Okoli ([email protected])
ISSN 1472-6963 Article type Research article Submission date 22 July 2009 Acceptance date 17 March 2010
Publication date 17 March 2010
Article URL http://www.biomedcentral.com/1472-6963/10/67
Like all articles in BMC journals, this peer-reviewed article was published immediately upon acceptance. It can be downloaded, printed and distributed freely for any purposes (see copyright
notice below).
Articles in BMC journals are listed in PubMed and archived at PubMed Central.
For information about publishing your research in BMC journals or any BioMed Central journal, go to http://www.biomedcentral.com/info/authors/
BMC Health Services Research
© 2010 Onwujekwe et al., licensee BioMed Central Ltd.
Investigating determinants of out-of-pocket spending and strategies for coping with payments for
healthcare in southeast Nigeria
Obinna E Onwujekwe1,2, Benjamin SC Uzochukwu2,3, Eric N Obikeze1,2*, Ijeoma Okoronkwo2,4,
Ogbonnia G Ochonma1, Chima A Onoka1,2,3, Grace Madubuko2,4 and Chijioke Okoli2
1 Department of Health Administration and Management, College of Medicine, University of Nigeria,
Enugu, Nigeria
2 Health Policy Research Group, Department of Pharmacology and Therapeutics, College of Medicine,
University of Nigeria, Enugu, Nigeria
3 Department of Community Medicine, College of Medicine, University of Nigeria, Enugu, Nigeria
4 Department of Nursing, College of Medicine, University of Nigeria, Enugu, Nigeria
*Corresponding author
Abstract:
Background: Out-of-pocket spending (OOPS) is the major payment strategy for healthcare in Nigeria.
Hence, the papers assessed the determinants socio-economic status (SES) of OOPS and strategies for
coping with payments for healthcare in urban, semi-urban and rural areas of southeast Nigeria. This paper
provides information that would be required to improve financial accessibility and equity in financing
within the public health care system.
Methods: The study areas were three rural and three urban areas from Ebonyi and Enugu states in
South-east Nigeria. Cross-sectional survey using interviewer-administered questionnaires to randomly selected
householders was the study tool. A socio-economic status (SES) index that was developed using principal
components analysis was used to examine levels of inequity in OOPS and regression analysis was used to
examine the determinants of use of OOPS.
Results: All the SES groups equally sought healthcare when they needed to. However, the poorest
households were most likely to use low level and informal providers such as traditional healers, whilst the
least poor households were more likely to use the services of higher level and formal providers such as
health centres and hospitals. The better-off SES more than worse-off SES groups used OOPS to pay for
healthcare. The use of own money was the commonest payment-coping mechanism in the three
communities. The sales of movable household assets or land were not commonly used as payment-coping
mechanisms. Decreasing SES was associated with increased sale of household assets to cope with
payment for healthcare in one of the communities. Fee exemptions and subsidies were almost non-existent
as coping mechanisms in this study
Conclusions: There is the need to reduce OOPS and channel and improve equity in healthcare financing
by designing and implementing payment strategies that will assure financial risk protection of the poor
BACKGROUND
Out-of-pocket spending (OOPS) is the major payment strategy for healthcare in Nigeria. The real
challenge of health care financing in Nigeria as in many countries in sub-Saharan Africa (SSA) lies not
primarily in the acute scarcity of resources, but in the absence of intermediation and insurance
mechanisms to manage risk, and inefficient resource allocation and purchasing practices [1]. User fees fall
within the broader concept of “cost-sharing”, a practice whereby beneficiaries contribute towards the cost
of a public service and they are defined as payment of out-of-pocket charges at the time of use of services
[2].
OOPS for healthcare increased with the introduction of user fees in the health sector and like most African
countries, Nigeria introduced user fees as a mode of financing government health services within the
framework of the Bamako Initiative revolving drug funds [3]. It is however noted that user fees and
revolving drug funds are interlinked. The introduction of user fees was arguably in response to the severe
problems in financing health services in Nigeria, like in most of sub-Saharan Africa. Government health
budgets declined in real terms in response to macroeconomic problems at the time while demand for
health services increased, partly because of population growth and successful social mobilization.
Currently, user fees apply to government owned healthcare services in Nigeria with the major aim being
to generate more funds for the health sector, so as to improve the quality of services [4]. In the private
sector, patients are also charged fees which they mostly pay out-of-pocket.
However, public expenditures in Nigeria account for just 20-30% of total health expenditures (THE),
whilst private expenditures accounts for 70-80% of THE and the dominant private expenditure is OOPS,
which accounts for more than 90% of private health expenditures [1,5]. The recently introduced national
covers a minority comprising only federal government civil servants. The NHIS plans to initiate
community-based health insurance schemes to cover people employed in the informal sector in some pilot
communities in Nigeria soon. The prevailing excessive private share of expenditures in Nigeria is all the
more alarming as most of it takes place via non-pooled OOPS, which has been noted as the most
regressive form of payment [6]. The composition of THE in Nigeria shows that private expenditures
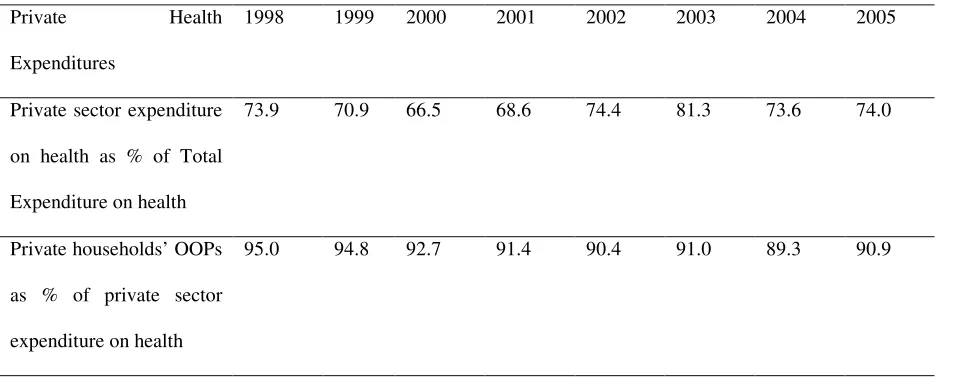
accounted for 66.5% of THE in 2000 and 74.4% in 2002 [1]. The household OOPS as a proportion of
private health expenditure, has been more than 90% in all years (Table 1). The Nigerian 2003-2005
National Health Accounts show that private health expenditure still constitutes more than 70% of THE
[5].This can lead to high incidence of catastrophic expenditures [7]. OOPS is about US$ 22.5 per capita,
which accounts for 9% of total household expenditures and half of those who could not access care did not
so because of its costs [8].
In most developing countries, OOPS are regressive while social assistance and fee exemptions are either
non-existent or where present, are not well targeted at those most in need [9,10,11]. The absence of
exemption mechanisms and pre-paid instruments is largely responsible for impoverishing health
expenditures [6]. With 70% of the population in Nigeria living below the $1-a-day [12], the excessive
reliance on OOPS curbs health care consumption, exacerbates the already inequitable access to quality
care, and exposes households to the financial risk of expensive illness at a time when there are both
affordable and effective health financing instruments to address such problems in low income settings [6].
Some analysts and donors have argued that introducing national user fee systems would address
inefficiencies and inequities in the health system [13,14,15,16]. It is recognized that a user fee policy
should include provisions for exemption of the poor. However, implementation of exemption systems is
fraught with problems, including identifying the eligible poor and administrative incapacity [17].
waivers and exemption system ineffective. Hence, a key factor underlying the inequitable impact of fees
was the failure of nearly all governments to design or implement targeted exemption mechanisms for the
poor [18,19].
There is paucity of information on how OOPS and other financing mechanisms lead to or have differential
effect on various socio-economic classes in healthcare seeking, access to care and utilization of services in
Nigeria. The federal government and some state governments have abolished user fees for the treatment of
some diseases such as malaria for the under-fives and pregnant women in the public sector. However, user
fees are still in place for the general population and even for some services for the under fives and
pregnant women. In Uganda, after user fees were abolished in 2001, the observed increase in utilization of
health services was more among the poor than in other socio-economic categories [11]. Some developing
countries such as Viet Nam, Guatemala, India, Mexico, Nepal and South Africa adopted other pro-poor
payment systems such as waivers and exemptions in response to the negative impact of user fees [10].
The objective of this study was to assess the incidence and determinants of OOPS with emphasis on the
SES differences in occurrence and coping mechanisms for OOPS and other household payment
mechanisms. Thus, this paper provides information that would be required for improved financial
accessibility and equity in financing within the public health care system, especially within primary
healthcare (PHC) which is the cornerstone of the Nigerian health care system [4]. Generating new
knowledge about the determinants and effects of OOPS in access to and utilization of PHC services, as
well as mechanisms to protect the poor from the adverse effects of OOPS is both a national and
METHODS:
Study area
The study areas were Ebonyi and Enugu states which lie within the South-east health care zone
comprising of 5 states. The study states combined reflect the situation in Nigeria. In each state, an urban, a
semi-urban and a rural community were selected. Hence, six communities were purposively selected in
the two states (so as to be representative of different geographic settings). These were the two state
capitals (Enugu and Abakiliki), two local government area (LGA) headquarters (Udi in Enugu state and
Ezilo in Ebonyi state) and two rural communities ( Eke-na-ene in Enugu state and Nkalagu in Ebonyi
state). Nigeria has an estimated population of 140million people. Enugu has a population of about 800,000
people, while Abakiliki has about 500,000 residents. Each LGA headquarters has a minimum population
of 40,000 people, while each rural community has a minimum population of 10,000 people. While trading
and civil service work are the major sources of income in Enugu and Abakiliki, subsistence farming and
petty trading are the major sources of livelihood in the other four communities.
Each study site has at least one primary health care centre. In addition, the two state capitals are served by
a teaching hospital while the two Local Government headquarters are served by a public general Hospital.
There are also a number of private hospitals/clinics, patent medicine dealers, and a wide range of private
healthcare providers (including traditional medicine practitioners) in each study community.
Household survey
The sample size was determined using the formula for sample size for a definite population, considering
0.25 as the proportion of the population positive for the health conditions that will require payments,
power of 80%, confidence interval of 95% and 0.05 as the absolute sampling error that can be tolerated.
Hence, 300 households represented an adequate sample size per study area. However, in order to take care
of refusals, the primary healthcare (PHC) house numbering system was used as the sampling frame to
Using a pre-tested questionnaire (see additional file 1), data was collected from the primary woman
household care-giver or in her absence, her spouse. The questionnaires were administered by trained
interviewers who were residents of the various communities.
The questionnaire was pre-tested amongst 50 residents of a peri-urban community near Enugu and the
results were used to improve some of the language used in the questionnaire, some questions, the mode of
questioning and the coding of some responses. We arrived at the decision to use some specific household
assets and weekly food expenditure to determine socio-economic status after discussions with many key
informants from the communities.
The questionnaire explored the demographic and socio-economic characteristics of respondents and their
households. The questionnaire was also used to examine the healthcare seeking practices. Healthcare
seeking was measured as number of cases in household in a one month period that sought healthcare from
different providers. It did not include self-treatment. The expenditures (transportation and actual
treatment) to pay for primary healthcare services for the diseases or health conditions were determined
using the one-month recall period. Some questions were used to determine the payment strategies that
people used to pay for healthcare and how they coped with the payments. The payment mechanisms
explored were direct payments with reimbursement by employers (reimbursement), out-of-pocket
spending (OOPS), National Health Insurance Scheme (NHIS), community-based health insurance
(CBHI), private voluntary health insurance (PVHI) payment in kind and payment by installment.
The approval for the study was obtained from the University of Nigeria Research Ethics Committee.
Verbal informed consent was obtained from all the respondents, who were all given the option of not
Data analysis
Principal components analysis (PCA) in STATA software package [20] was used to create a continuous
socio-economic status (SES) index [21,22] using information from the households’ asset holdings together
with the per capita weekly cost of food. The first principal component of the PCA was used to derive
weights for the SES index [23]. The assets were ownership of motorcar, motorcycle, radio, refrigerator,
television set and bicycle. In addition the monthly value of food was also included. The SES index was
divided into SES quartiles. Income was not used in defining SES because people in Nigeria do not provide
reliable information about their income. Testing of means was used to divide some key variables into the
SES quartiles and Kruskal-Wallis statistics was used to compute chi-square for trends, in order to
determine whether the means of the quartiles were statistically significantly different.
The measures of inequity were the ratio of the mean of the poorest SES group (1st quartile) over that of the
least poor SES group (4th quartile) (top/bottom quartile ratio) and concentration index [24,25,26]. The
top/bottom (Q1/Q4) quartile ratio shows the level of gap that has to be bridged in order to ensure equity
and improve the condition of the poorest households and a score of 1 signifies perfect equity [22]. The
concentration index varies from -1 and +1 and a negative sign shows that the variable of interest is higher
among the poorest and if positive, it means that it is more among the richest (or least poor).
Logistic regression analysis was used to examine the multivariate relationship of OOPS with key
explanatory variables. The dependent variable was whether or not someone paid through OOPS. The
explanatory variables were the weight that was used to derive the SES index, households'
socio-demographic characteristics and costs of transportation and cost of treatment itself. There were no prior
hypothetical expectations about the relationship of the dependent and the explanatory variables, because
RESULTS
Characteristics of the respondents and their households
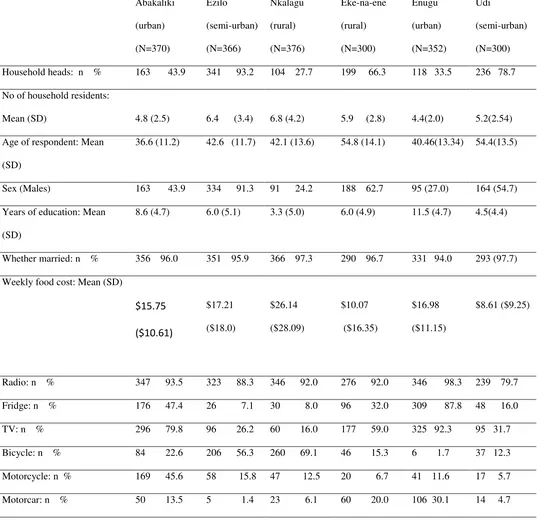
The number of complete questionnaires available for data analysis were 370, 366, 376, 298, 352 and 300
in Abakiliki, Ezilo, Nkalagu, Eke-na-ene, Enugu and Udi respectively (Table 2). The low number of
respondents in Eke-na-ene and Nkalagu (rural areas) was due to the low population there. The reduced
number of questionnaires in the six communities when compared with the sample selected was because of
some few refusals to be interviewed and refusal to answer some of the questions.
As shown in Table 2, the respondents were mostly heads of households in the rural areas (with the
exception of Nkalagu), while representatives of households were the majority of the respondents in the
two urban areas (Abakiliki and Enugu). Also, majority of the respondents were males in the rural areas
(with the exception of Nkalagu), while the converse was true in the two urban areas. The respondents
from the urban areas were expectedly more educated than those from the rural areas. The average years of
formal schooling was 11.5 years in Enugu and 8.6years in Abakiliki while it was 4.5 years, 6.0 years, 3.3
years and 6.0 years in Udi, Eke-na-ene, Ezilo and Nkalagu respectively. Most of the respondents in the six
communities were middle-aged. The average number of household residents (average household size)
ranged from 4.4 in Enugu to 6.8 in Nkalagu. The average weekly household cost of food ranged from as
low as $8.61 in Udi to as high as $26.14 in Nkalagu. The average weekly cost of food per household
member was $3.6, $3.0, $4.2, $2.0, 3.5 and $1.2 in Abakiliki, Ezilo, Nkalagu, Eke-na-ene, Enugu and Udi
respectively. The higher amounts in some rural areas were due to the high costs of home produced and
consumed food items there. The households in the urban areas had better valuable asset holdings than
their rural counterparts and were more likely to own a television set, refrigerator and motorcar. The
observed socio-economic and demographic characteristics of the study sample reasonably reflect that of
Health Seeking:
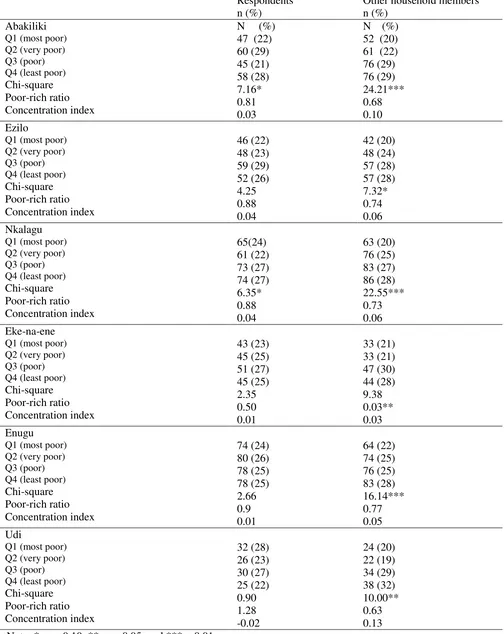
The study also shows how the respondent sought for health care (Table 3) in the one-month recall period.
The very poor group (28%) sought health care most while the poorest group (22%) were least in health
seeking in Abakaliki. In Obinagu, the poorest group (30%) sought for health care most while the
remaining percentages were distributed almost equally among the other SES groups in the community.
Health care was sought most by those in quartile 3 in Ezilo (28%), Nkalagu (26%), Eke-na-ene (28%) and
Enugu (26%). However, concentration indices showed that the variables of interest were in favour of the
worse off in Abakaliki and Obinagu, and in favour of the better off in the rest of the study communities.
The poorest households were most likely to use low level and informal providers, such as traditional
healers, whilst the least poor households were more likely to use the services of high level providers such
as health centres and hospitals.
Expenditures on healthcare seeking
Higher costs of treatment were incurred in the two urban areas (Abakiliki and Enugu) and the overall
mean monthly cost of treatment per respondent ranged from 440.7 Naira (US$4.01) in Udi to 1477.0
Naira (US$13.43) in Enugu. Conversely, the average monthly costs of transportation per respondent were
higher in the rural areas and the people paid an average of 35.3 Naira (US$0.32) in Eke-na-ene to 162.3
Naira (US$1.48) in Ezilo. The total treatment costs for other household members mirrored that of the
respondents, although the highest costs were incurred in Ezilo and Nkalagu.
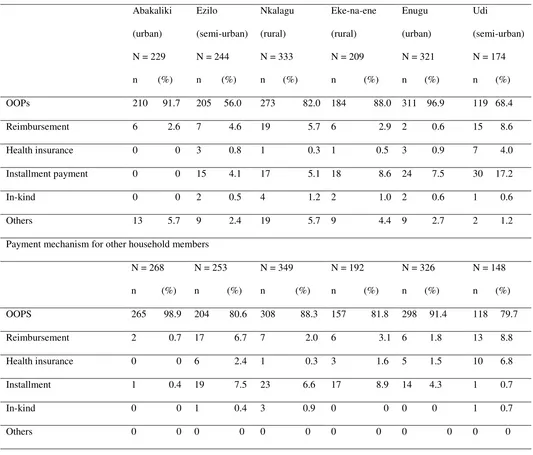
Payment strategies
OOPS was by far the commonest type of payment mechanism that was used by respondents to pay for
their healthcare in the six communities (Table 4). This was followed distantly by installment payment,
with the exception of Abakiliki where reimbursement was the second most common payment mechanism.
claimed to have utilized health insurance, which is still new in Nigeria. The urbanites significantly used
more of OOP payment strategy, while the rural dwellers significantly used more of reimbursement,
installment payment and in-kind payment mechanisms. As was the case for respondents’ payment
mechanism for healthcare, OOPS was used for the payment of healthcare for other household members
(Table 4). It was again followed in frequency of use by payment by installment.
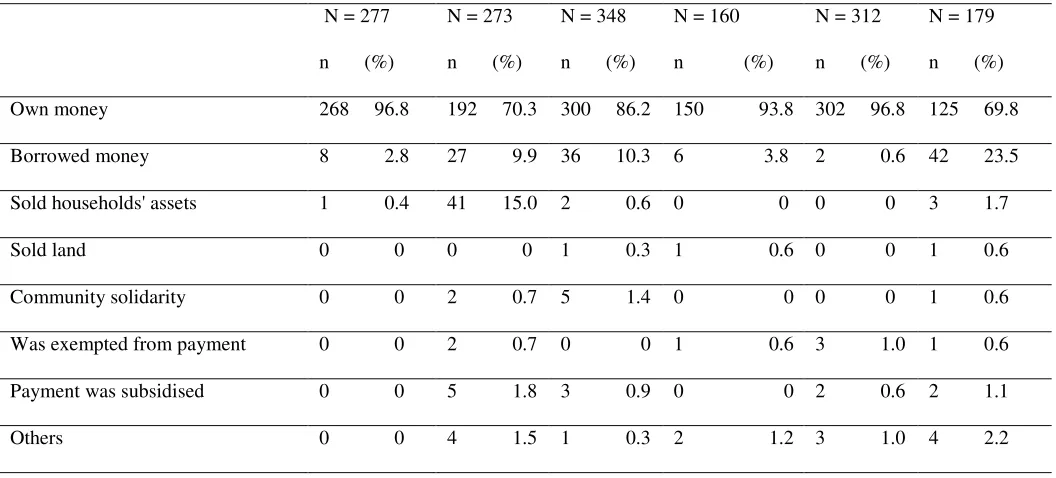
Table 5 shows the different payment-coping mechanisms that the respondents used to pay for health care.
The use of own money was the commonest payment-coping mechanism in the three communities.
However, a sizeable proportion of the respondents in three communities (Ezilo, Nkalagu and Udi)
borrowed money in order to pay for care. The sale of movable household assets or land was not
commonly employed while fee exemptions and subsidies were almost non-existent as coping mechanisms.
In case of other household members, households mostly used their own money to pay for the healthcare
services, although there was some appreciable use of borrowed money to pay for healthcare in some rural
areas (Table 5).
Socio-economic status differentials in use of OOPS and in coping strategies
In most cases, respondents belonging to different SES groups used OOPS equally to pay for healthcare
with the exception of Abakiliki where the most poor had the lowest proportion of people that used the
mechanism (Table 6). However, for other household members there was a uniform statistically significant
SES difference in the use of OOPS to pay for healthcare in the six study areas. The most-poor group was
less likely to use OOPS as a payment mechanism compared to better-off SES groups. Based on the pooled
data from the six sites, although OOPS was the most highly used payment mechanism by all SES groups,
the most poor used reimbursement (p=0.001), in-kind (p=0.035) and installment (p=0.06) more than other
SES groups. Both the inter-quartile ratios and the concentration indices support the trend of inequity in
own money to pay for healthcare. Also, as SES quartile decreased, the households sold their assets to pay
for healthcare in Ezilo. The better-off quartiles were more able to borrow to pay for healthcare in Ezilo
and Nkalagu, while the converse was true in Eke-na-ene.
Logistic regression analysis showed that there were some statistically significant determinants of choice of
OOPS for the payment of healthcare (Table 7). All the regression analyses were statistically significant.
The expenditure on treatment was positively and statistically significantly correlated with use of OOPS in
four of the communities, although the magnitudes of the coefficients were small. Females were less likely
than men to use OOPS, although the finding was only statistically significant in Udi. Factors that had
positive influence on use of OOPS were respondents being household heads in Udi, higher number of
household residents in Eke-na-ene and Ezilo, years of schooling in Ezilo and transportation costs in
Abakiliki and Eke-na-ene. However, transportation costs had a negative influence on use of OOPS in
Ezilo. The weights of the SES indices were insignificant explanatory factors, with the exception of Ezilo,
DISCUSSION
The results indicate that most respondents of the study communities used OOPS as the commonest type of
payment mechanism for health care consumption. However, this could be due to absence of wide-scale
payment alternatives to OOPS. It is possible that if NHIS and other pre-payment (especially health
insurance) mechanisms were widely available, payment by OOPS would not be so high. The limited use
of payment mechanisms such as reimbursement, installment and in-kind payments either reflect their low
acceptability by providers or a low level of awareness that they could be used by the consumers.
In the study area, OOPS appeared largely uninfluenced by socio-economic status (SES). Hence, the
differences in relative use of different providers had no relationship with use of OOPS. However, OOPS
was found to be more significantly used by the urban communities while the rural communities used more
of reimbursement, installment payment and in-kind payment mechanisms. This may be because the urban
dwellers are more educated and have more assets and economic power. The lack of SES differentials in
use of OOPS by respondents implies poor people are suffering and are not protected from the hazards and
uncertainty of paying for healthcare when ill. This can lead to individuals to either delay or not seek
healthcare at all. Some of the inequity might be explained by urban-rural differences especially taking into
consideration that the most-poor people usually reside in the rural areas and options for healthcare
payments are also more limited in rural areas.
User fees paid through OOPS, which has been universally recognised to be very retrogressive, was the
most common payment mechanism used to pay for care by all the SES quartiles in different geographic
settings. The impact of OOPS is worse on the poorest households as they are more likely to have higher
occurrences of catastrophe due to health payments through OOPS. Payment mechanisms that engender
equity should be developed and made part and parcel of the healthcare system. Countries with more
or tax-based models [26]. Although the NHIS has enrolled the federal government civil servants, the
NHIS was rarely used by the study communities indicating that the mechanism is still rare in the country.
The irony is that the countries whose populations can least afford to pay for health care are the ones who
still rely on user fees even though it is a sub-optimal method of financing. However, experiences in other
countries show that user fees can be abolished successfully [11,26,17]. After all, the income that they are
bringing in is not is usually not substantial. Nonetheless, the principal questions with regards to
elimination of user fees are still: how to appropriately fill the financing gap resulting from such
elimination, how to provide evidence that abolition is responsible for better access to modern healthcare;
and to determine if there are other important reasons that might have negative impact on the demand for
modern healthcare (e.g. low quality, bribes).
A sizeable proportion of the respondents in the three rural communities in the present study borrowed
money in order to pay for health care. Borrowing to pay medical fees has been reported in a number of
studies [27]. The adoption of specific short-term responses to crisis events such as sale of land or movable
household assets and taking a loan were not commonly used to cope with payment for healthcare in the
present study. It seems that households therefore make decisions which reflect trade-offs between
competing objectives. Research on households’ responses to drought and famine suggests that households
often adopt coping strategies which aim to protect the viability of future livelihoods, demonstrating an
“awareness of a future beyond the current crisis when assets may be needed for other purposes” [28].
Lands are often considered as ‘core’ assets, which are essential to maintaining current and future incomes,
as opposed to ‘surplus’ assets which are primarily a store of value. Disposal of ‘surplus’ assets does not
lead households to incur catastrophic opportunity costs through a decline in subsequent incomes, and is
more easily reversible. However, disposal of ‘core’ productive assets may lead to a ‘poverty ratchet’
It was not surprising that taking a loan was not a popular coping mechanism adopted by the respondents.
The reason may be that formal credit institutions employ screening devices to overcome information and
incentive problems [31], and this often results in the exclusion of poor households from access to formal
credit. Most poor households may not qualify for loans as loans are usually made available to those with
the ability to repay as assessed by a credit officer. Many households with the capacity to obtain loans may
be unwilling to seek formal loans to pay medical bills due to high interest rate and the fear that they may
find it difficult to repay the loans in the future. Similarly, community solidarity was not a popular coping
mechanism even though it has been reported that it can overcome information asymmetries and incentive
problems and as such can be used as informal credit market to households who are excluded from formal
credit institutions [32,33]. There was very little evidence of actual existence of fee exemptions and other
discretionary payment strategies that could be used to pay for the poorest and hence improve their level of
access and utilization to healthcare services.
Removing user fees and limiting the use of OOPS for essential healthcare conditions and for control of
endemic diseases should be regarded as part of a package to improve quality and sustainability of health
services. These should be complemented by implementing appropriate health insurance schemes to cover
the informal sector and ensure financial risk protection of the poor in the context the National Health
Insurance Scheme. The abolition of user fees is also cited by the Millennium Project report as a necessary
prerequisite for achieving the health-related Millennium Development Goals (MDGS) [34]. However, as
some authors cautioned from the experiences in Uganda, the removal of user fees should be accompanied
by drug availability and improved quality of services [11]. It is however noteworthy that not all health
systems will be able to remove user fees immediately, nor will removal of fees be successful without
In the right place and manner, abolition of user fees through OOPS can be part of a powerful vicious circle
as it can improve access and outcomes. Studies in Burkina Faso [35] and elsewhere [36,37,38] have
shown that the introduction of fees resulted in deterring people, especially the poor and children, from
using health care services. In contrast to this, a widely cited study from Cameroon found that the poor
used more state-provided health care despite fee increases as a result of quality improvements [39].
Similarly, growing demand after introduction of cost recovery and better quality of care was found in a
pilot study in Niger [40].
CONCLUSION
This study has demonstrated the existence of SES inequities in use of OOPS to pay for healthcare
services. Developing equitable financing approaches will depend on the assessment of the burden and
determinants of OOPS on healthcare seeking by different socio-economic and geographic groups, leading
to determining how best to protect the poor. Innovative approaches that would reduce the inequity in
financial access to and utilization of healthcare services by the poor are needed, especially if the
health-related millennium development goals (MDGs) are to be met in Nigeria. However, the attainment of the
MDGs in health could be hampered by OOPS.
Equity can be achieved if public expenditures are targeted to poorer and underserved sections of the
society, and if an appropriate financial risk protection mechanism(s) are adopted across the states and the
country in general, especially within the context of the National Health Insurance Scheme. In order to
avoid the negative incentives of OOPS on those who are unable (or unwilling) to pay, user fee exemptions
can provide a way of avoiding the negative equity impacts of such a policy [2]. Hence, discretional fees
and quality improvements of services at reduced costs are additional strategies for enhancing financial
The body of knowledge on how OOPS affect equitable access to care and utilization of services in Nigeria
and in many sub-Saharan African countries needs to be continually increased so as to help improve
evidence-based decision making and accelerate efforts of policy makers to move away from OOPS to
more insurance-based payment mechanisms. In addition, this will help ensure that people do not have to
pay out-of-pocket at point of consumption of healthcare services. Future studies should examine other
dimensions of incidence (such as geographic differences) and consequences of OOPS such as catastrophe
and impoverishment in different settings amongst different population groups. Future studies that would
examine the determinants of OOPS should also broaden the inquiry to include alternatives such as people
refraining from seeking healthcare.
Competing interests: ‘The authors declare that they have no competing interests’
Authors’ contributions: OO conceived the study and wrote the first draft of the paper. All the co-authors
participated in data collection, data analysis and interpretation of the data, as well as critical revision of
the drafts of the paper. All authors read and approved the final manuscript.
ACKNOWLEDGEMENT: The study was funded by the Alliance for Health Policy and Systems
Research, Geneva, Switzerland. We thank the reviewers for their comments, which helped us to improve
REFERENCES
1. Soyibo A: National Health Accounts of Nigeria, 1998-2002. Ibadan: University of Ibadan; 2004.
2. Witter S: An Unnecessary Evil? User fees for healthcare in low-income countries. London: Save the
Children;2005.
3. Uzochukwu BSC, Onwujekwe OE and Akpala CO: Effect of the Bamako-Initiative drug revolving
fund on availability and rational use of essential drugs in primary health care facilities in Southeast
Nigeria. Health Policy and Planning 2002, 17(4):378-383.
4. Federal Ministry of Health: The National health policy of Nigeria. Abuja: Federal Ministry of Health
(FMOH); 2005.
5. Soyibo A, Olaniyan L and Lawanson O: National Health Accounts of Nigeria, 2003-2005. Ibadan:
University of Ibadan; 2009.
6. Preker AS: Feasibility of Mandatory Health Insurance - Challenges in Health Care Financing. Abuja
Flagship Course. Abuja: The World Bank; 2005
7. Onwujekwe O, Hanson K, Uzochukwu B, Ichoku H, Ikeh E and Onwughalu C: Are malaria
treatment expenditures catastrophic to different socio-economic and geographic groups and how do
they cope with payment in southeast Nigeria? Tropical Medicine and International Health 2010, 15
(1): 18–25.
8. Federal Office of Statistics: Core Welfare Indicators Questionnaire Survey: Combined 6-States Main
Report. Abuja, FOS, State Statistical Agencies of Abia, Cross River, Gombe, Kebbi, Osun, and Plateau
states. Abuja:Federal Office of Statistics; 2004.
9. Nguyen TH, Le Thi TH, Rifkin SB, et al: The pursuit of equity: a health sector case study from
Vietnam. Health Policy 1995, 33:191-204
10. Wagstaff A: Poverty and health sector inequalities. Bulletin of World Health Organisation, 2002,
11. Nabyonga J, Desmet M, Karamagi H, Kadama PY, Omaswa FG and Walker O: Abolition of
cost-saving is pro-poor: evidence from Uganda. Abolition of cost-cost-saving is pro-poor: evidence from
Uganda. Health Policy and Planning, 2005, 20(2):100-8.
12. World Bank: World Development Indicators. Washington: World Bank; 2003.
13. Griffin C: Healthcare in Asia. A comparative study of cost & financing Washington DC: World Bank;
1992.
14. Shaw R and Griffin C: Financing Health Care in Sub-Saharan Africa through user fees and
insurance. Washington DC: World Bank; 1995
15. World Bank: Financing health services in developing countries: an agenda for reform. Washington:
World Bank; 1987.
16. World Bank: World Development Report 1993: Investing in Health. New York: Oxford University
Press for World Bank, 1993.
17. Russell S and Gilson L: User fees policies to promote health services access for the poor: a wolf in
sheep’s clothing? International Journal of Health Services 1997, 27:359-79.
18. Kutzin J: How Health Insurance Affects the Delivery of Health Care in Developing Countries.
Working Paper, Population and Human Resources Dept. Washington DC:World Bank; 1994
19. Gilson L, Russell S and Buse K: The political economy of user fees with targeting: developing
equitable health financing policy. Journal of international Development 1995, 7(3):369-401).
20. STATA manual version 6 (1995 – 1999): Texas: STATA press.
21. Filmer L and Pritchett D. Estimating wealth effects without expenditure data - or tears: an
application to educational enrolments in states of India. Demography 2001, 38:115-32.
22. Onwujekwe OE. Inequities in healthcare seeking in the treatment of communicable endemic
23. Onwujekwe OE, Hanson K and Fox-Rushby J: Inequalities in acquisition of mosquito nets and
willingness to pay for Insecticide-treated nets in Nigeria: Threats to successes of malaria control
interventions. Malaria Journal 2004, 3:6
24. Wagstaff A, Van Doorslaer E and Paci P: Equity in the finance and delivery of health care: some
tentative cross-country comparisons. Oxford Review of Economics 1989, 5(1): 89-112.
25. Wagstaff A, Van Doorslaer E and Paci P: On the measurement of inequalities in health. Social
Science and Medicine 1991, 33:545-557.
26. Wagstaff A, van Doorslaer, E and Watanabe N: On decomposing the causes of health sector
inequalities, with an application to malnutrition inequalities in Viet Nam. Policy Research Working Paper
No 2714. Washington (DC): World Bank; 2001.
27. Russell S. Ability to pay for health care: concepts and evidence. Health Policy and Planning 1996,
11: 219-37.
28. Devereux S. Goats before ploughs: dilemmas of household response sequencing during food
shortages. IDS Bulletin 1993, 24(4):52-59.
29. Chambers R: Editorial Security and the family: coping with seasonality and calamity in rural
India. Journal of Peasant Studies 1989, 17:341-412.
30. Corbett J: Poverty and sickness, the high cost of ill-health. IDS Bulletin 1989, 20 (2):58-62.
31. Hoff K and Stiglitz J: Introduction: Imperfect information and rural credit markets: puzzles and
policy perspectives. World Bank Economic Review 1990, 4(3):235-250.
32. Udry C: Credit markets in Northern Nigeria: credit as insurance in a rural economy. World Bank
Economic Review 1990, 4(3):251-269.
33. Fafchamps M: Solidarity networks in preindustrial societies: rational peasants with a moral
economy. Economic Development and Cultural Change 1992, 41:147-176.
34. Sachs J et al: Investing in Development: A practical plan to achieve the Millennium Development
35. Sauerborn R, Nougtara A and Latimer E: The elasticity of demand for health care in Burkina Faso:
differences across age and income groups. Health Policy and Planning 1994, 9:185-192.
36. Pannarunothai S and Mills A: The poor pay more: health-related inequality in Thailand. Social
Science and Medicine 1997, 44:1781-1790.
37. Fabricant SJ, Kamara CW and Mills A. Why the poor pay more: household curative expenditures
in rural Sierra Leone. International Journal of Health Planning and Management 1999, 14:179-199.
38. Acharya S, Carrin G and Herrin A: The Macroeconomy and Health Sector Financing in Nepal: a
Medium-Term Perspective. Macroeconomics, Health and Development Series No.11. Geneva: World
Health Organization; 1993.
39. Litvack JI and Bodart C: User fees plus quality equals improved access to health care: results of a
field experiment in Cameroon. Social Science and Medicine 1993, 37:369-383.
40. Diop F, Yazbeck A and Bitran R: The impact of alternative cost recovery schemes on access and
Table 1 Private Health Expenditure in Nigeria, 1998-20051,5
Private Health
Expenditures
1998 1999 2000 2001 2002 2003 2004 2005
Private sector expenditure
on health as % of Total
Expenditure on health
73.9 70.9 66.5 68.6 74.4 81.3 73.6 74.0
Private households’ OOPs
as % of private sector
expenditure on health
Table 7: Logistic regression analysis of out-of-pocket user fees versus independent variables Abakaliki
Coeff (SE)
Ezilo Coeff (SE)
Nkalagu Coeff (SE)
Eke-na-ene Coeff (SE)
Enugu Coeff (SE)
Udi Coeff (SE) Status in household -.11 (.58) -.37 (.58) -.37 .49) -.80 (.63) -.67 (.52) .95 (.38)** No of household
residents
-.09 (.07) .07 (.04)* -.02 (.03) .11 (.05)** -.01 (.08) .07 (.06)
Sex -.35 (.58) .18 (.51) -.05 (.49) .80 (.61) -.22 (.53) -.91 (.32)*** Age .03 (.01)** .003 (.01) -.01 (.01) -.0002 (.01) .01 (.02) -.02 (.01) Years of schooling .001 (.04) .04 (.03)* .02 (.04) -.01 (.03) .01 (.04) -.04 (.04) Marital status -1.06 (.66) -1.2 (.69)* .59 (.70) 1.00 (.87) .43 (.62) 1.30 (1.16) Cost of treatment .01 (.001)*** .001 (.0002)*** .0004 (.0002)** .0002 (.0002) .0002 (.0001) .0004 (.0002)* Transport costs .02 (.006)*** .002 (.001) -.002 (.001)* .02 (.004)*** -.002 (.001) -.001 (.002) SES index .04 (.10) -.18 (.10)* .09 (.10) .05 (.10) .09 (.15) .04 (.10) Constant -.56 (.88) .24 (.99) .94 (.83) -1.43 (1.01) 1.26 (.96) -1.38 (1.31) LR chi2 197.6*** 64.4*** 20.0** 40.7*** 11.46*** 22.31***
Pseudo R2 0.39 0.13 0.05 0.11 0.05 0.06
No of correct predictions
86.52% 67.21% 73.40% 69.80% 88.64% 65.86%
Significance of parameters * <0.10, **<0.05, ***<0.01
ADDITIONAL FILES
Additional file 1
Title: Additional file 1
Additional files provided with this submission:
Additional file 1: Household%20questionnaire[1].doc, 81K