Reservoir Rock Characterization Using Log-petrophysical,
geochemical, and Thermal Method on Well I-1 and I-2 in
Regions 'Y' Central Sumatra
Isti Nur Kumalasari
1, a), Ordas Dewanto
1, b)1
Geophysics Engineering, Egineering Faculty, Lampung University
a)
b)
Abstract. Reservoir characterization is a process to define the qualitative and quantitative characters or reservoir using all existing data (Sukmono, 2002). Reservoir characterization is important to know the subsurface state, especially oil and gas reservoirs. This study used three data and methods to characterization of reservoir wells I-1 and I-2 in Region "Y" Central Sumatra Basin. We used Log-petrophysical, geochemical and Thermal method. Log data Interpretation used for characterizing reservoir located in sand rocks and have great permeability, which can be detected by looking at small gamma ray value and high log spontaneous value. The content of hydrocarbons was detected from log NPHI and RHOB separation and resistivity values (log LLD) of greater than 60 Ohm-m. The results of log data processing indicates that the potential at the Well layer II (614-615.4)m or (2014.4-2016.1)ft has a porosity value = (25.57-35.86)% and Rw = 0:45 Ohm-m, and well I-2 (797- 893.8)m or (2614.8-2932.4)ft has a porosity value = (26.35-29.72)% and Rw = 0:45 Ohm-m. Thermal method (T3D) and geochemistry are used to estimate the hydrocarbon maturation level. Immature indicated by geochemical indicators Ro =(0,34-0,44)%, T3D=(1-2)×103 kal cm-3 and T=(60-70)oC, for wells I-1 occurs at Z=(580-680)m or (1902.89-2230.97)ft Well I-2 occur at Z=(502-629)m or (1646.98-2063.65) ft. Mature indicated by Ro =(0,44-0,73)%, T3D=(10-15)×103 kal cm-3 and T=(90-100)oC, for well I-1 occur at Z=(1160-1270)m or (3805.77-4166.67) ft
and for well I-2 occur at Z=(1096-1276)m or (2933.07-3595.8)ft. Over mature only occur at well I-2 (1595-1699m) or (5232.95-5574.15)ft with Ro=0,72-0,91)%, T3D=(50-70) ×103 kal cm-3 and T=(100-120)oC. Gas was found I-2 (1780-1964m) or (5838.90-6443.57)ft with Ro =(1,00-2,00)%, T3D=(100-150)×103 kal cm-3 and T=(110-130)oC. The conclusion is that the wells I-1 and I-2 of Central Sumatra, was the prospect well, because of the addition results obtained porosity and Sw nice (containing hydrocarbons), supported by the thermal data and geochemical showed layers of hydrocarbons immature, ripe and gas.
PRELIMINARY
measurement of the thermal conductivity of rocks, porosity temperature, temperature gradient, age, stress, lithology and geothermal flow. This study uses data logging, data is thermal, and geochemical data to determine reservoir characteristics in well I-1 and I-2 in the "Y" in Central Sumatra.
REGIONAL GEOLOGY
The location, the state of Geology and Stratigraphy
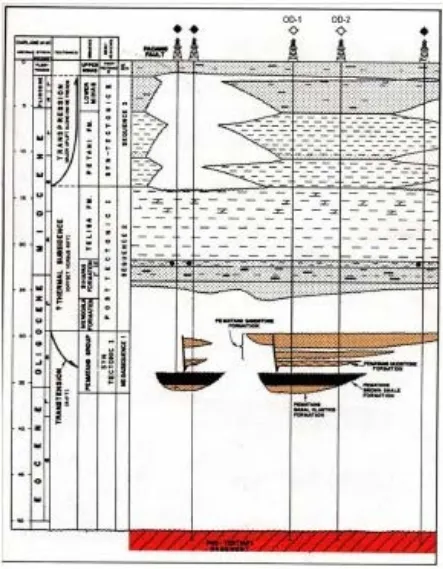
Geographically, Central Sumatran basin are at 90 o BB-103°BT and 1 o LS- 4 o LU. Judging from tectonic position, Sumatra Basin is basin behind the arc relatively elongated Northwest-Southeast, where the formation is affected by the subduction of the Indian-Australian plate under the Asian plate. This subduction process produces the movement of the crust at the bottom of the basin and result in heat convection. It’s couse flow of heat from the mantle upwardly passing lanes fault. Overall, that;s what's causing high heatflow in Central Sumatra basin area (Eubank et al., 1981 in Wibowo, 1995). Eubank and Makki (1981) divides the regional stratigraphic unit in Central Sumatra into five formations that Pematang Formation, Sihapas Formation, Telisa Formation, Petani Formation and Minas Formation. The composition stragigrafi Central Sumatra region can be seen in figure 1.
THEORY
Thermal conductivity of rocks, Formation, Formation Group, and the Well
The basic relationship of heat transfer by conduction forward by Fourier J.BJ stating that the heat flow by conduction in a material equal to the product of three magnitude of the thermal conductivity of the material, cross-sectional area, and the temperature gradient in the penampanng. Conduction is the process of heat propagation in a substance that is not accompanied by mass transfer generally occurs in solids. Gretener research results in 1982 that the value of thermal conductivity at each of the different substances, and the price of conductivity at the same lithology as well different. This means that the conductivity is affected by the composition of the material itself. International unit rock thermal conductivity is W / m ° The thermal conductivity of the formation (KFM) is the ability of a formation in the wells to conduct heat. Formation conductivity is determined by the following formula:
𝐾𝐹𝑀=��𝐾𝑑𝐵1
Where; KFM = thermal conductivity of formations (10-3 cgs), dFM1= thickness of lithology-1 (m), dFM2= thickness of lithology-2 (m), dFM1+dFM2 = thickness of the formation (m), KFM1= thermal conductivity of type lithology-1 (10
-3
cgs), KFM2= heat conductivity of types lithology -2 (10 -3 cgs) and so adapted to the type of formation. The thermal conductivity of group formation (KKFM) is the ability of a group of formations in the well to heat mengahantarkan.
Thermal conductivity equation group formation as follows
:
𝐾𝐾𝐹𝑀 =��𝐾𝑑𝐹1 dFM2 = thickness of the formation-2 (m) dFM1+dFM2 = thickness of group formation (m), KFM1 = heat conductivity of formations-1 (10 -3 cgs), KFM2= heat conductivity of formations-2 (10-3 cgs) and so adapted to the type of formation. The thermal conductivity of wells (KSM) is the thermal conductivity which calculated from the depth of wells up to
the surface. How determination that by summing the respective prices of thermal conductivity formations that exist in these wells (Subono and Siswoyo, 1995)
;
𝐾𝑆𝑀=��𝑑𝐾𝐹𝐴𝐹𝐴+𝐾𝑑𝐹𝐵𝐹𝐵+⋯ �×𝐷𝐴1� −1Where; KSM = heat conductivity calculated from the end of the well s / d surface (10-3 cgs), dFMA, dFMB, dFMN =
thickness of formations A, B s / d N (m or cm), DA = total depth.
Temperature, Gradient Temperature, Heat Flow, and Thermal 3 Dimensions
Each space of rock has a different temperature because of the difference of porosity value, hydrostatic pressure and thermal conductivity. Temperature can affect the organic matter contained in the sediments. Increased
(1)
(2)
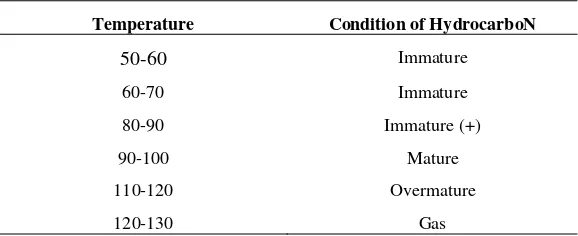
temperatures will transform heavy oil into light crude oil, condensate and then final become gas. Table 1 shows the state of hydrocarbons based on the temperature (Dewanto, 2001). The temperature of the oil and gas reservoir is determined by the depth and geological position. Increasing of depth in general have temperature more high. On the other hand the value of this temperature is determined by the temperature gradient. The temperature gradient is expressed in ° F / 100ft or ° C / 100m. Factors that influence the geothermal gradient is heat conductivity, local structures, and overpressure (Koesoemadinata, 1978). Of the heat that spreads flowing from the bottom to the surface, causing the room through which the heat flow has a temperature. Formulas temperature gradient according to Dresser Atlas (1982) are as follows:
𝑑𝑇 𝑑𝑍=
(𝑇𝑓−𝑇𝑚) 𝐷 𝑥100
Where; dT/dz = gradient of temperature (OC/100m), Tf = formation temperature (oC), Tm = surface temperature (OC), D = depth of formation (m)
Geothermal heat flow is the amount of heat flowing from the Earth to the surface by conduction. Formula of geothermal flow according Gretener (1982) are as follows:
𝑄=𝐾𝑑𝑇
𝑑𝑍
Where; cal/cmµQ = the value of geothermal heat flow (HFU atau
µ
cal/cm
2s
atau mW/m2 ), K = Thermal conductivity (10-3 cal cm-1 dt-1OC-1 atau W/mOC), dT/dZ= gradien temperatur (OC/100m), 1 HFU= 10-6 kal cm-2 dt-1. Heat capacity is calculated based on simple case Lopatin-Waples and calculation Time Temperature Index modified by entering parameters so that the total heat flow maturase on a space rock is converted into a 3 D thermal formula as follows:Log Gamma Ray is a method for measuring the gamma radiation produced by radioactive elements contained in the rock layers along the borehole. According to Adi Harsono (1997), radiation levels shale (shale) higher than other rocks because of the radioactive elements tend to settle in layers of impermeable shale, this occurs during the process of changing geological rock. In permeable formations the GR radiation levels is lower, and the curve will go down to the left. So the GR log is a log permeability that’s nice being able to separate properly between shale layers of permeable layer. So if the value of the gamma ray log large indicates that the layer is impermeable or shale (shale). Figure 2 shows the response of Gamma Ray log in various lithology. SP log is a recording of the electrical potential difference between the electrodes in the electrode surface remains engaged in the borehole. The pit must be filled with mud is conductive.
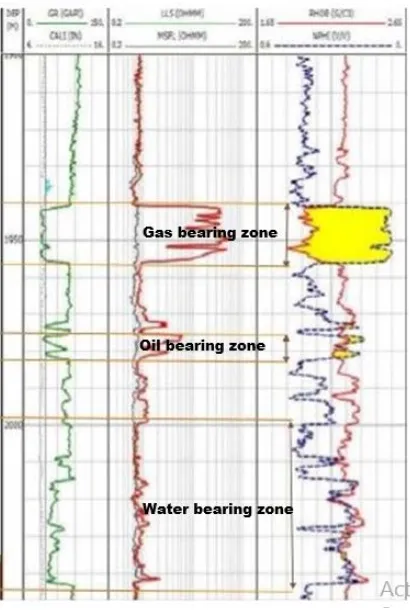
Log Resistivity
According to Riki Pahlevi Zain (2012), made reference resistivity log important presence or absence of hydrocarbons. The presence of hydrocarbons is characterized by high resistivity values, whereas water or clay has low resistivity. Figure 1 illustrates the changes caused by gas, oil and water in the borehole (Grace and Dewanto, 2015). According to Grace and Dewanto (2015), if it contains gas will indicated byn gamma ray log value will be lower, at less than 60 API, and the value will be large resistivity log more than 100 ohm-meters. Log resistivity can be less than the value when the cross between density and neutron log with a big separation. If it contains oil will indicated with gamma ray log value will be lower, at less than 60 API, and log resistivity values will range from 100 ohm-meters. Resistivity can be less than the value when the cross between density and neutron logs with little separation. If it contains water will indicated with gamma ray log value is lower, at less than 60 API, and the value will be large resistivity less than 60 ohm-meter and the absence of any cross between density and neutron logs.
Log Neutron and Log Density
When combined with interval scale opposite log neutron and density can be used to detect the presence of hydrocarbon content shown by the cross-over (butterfly effect), the greater the separation cross over that shown by
(5)
log neutron and density, it can be interpreted that the hydrocarbon is a gas and if the sparation is smaller it is interpreted that the hydrocarbon is oil or water. In addition we also need to compare with resistivity logs, if the resistivity indicates a high value then it is possible that areas cross over the hydrocarbons but if resisitivitasnya lower zone is possible that the water (Hangga Wijaya, 2014). Log Neutron measuring hidrogens ions contained in a formation. Log neutrons will respond to the presence of hydrogen in the rock layers so that the layers of water or oil thelog neutrons will reflect the fluid that fills the pores of the rock, while the density log is used to measure the density by emitting gamma rays into rock formations (Cahaya et al, 2015).
Vitrinite Reflectance
Vitrinite Reflectance (Ro) is the geochemical data obtained from the measurement results. Ro is usually an indicator to estimate the degree of maturation of hydrocarbons, namely by looking at the magnitude of the reflection at the core.
RESEARCH METHDOLOGHY
Flow Chart
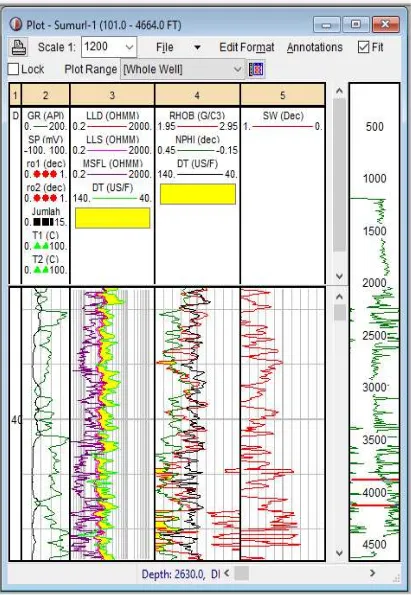
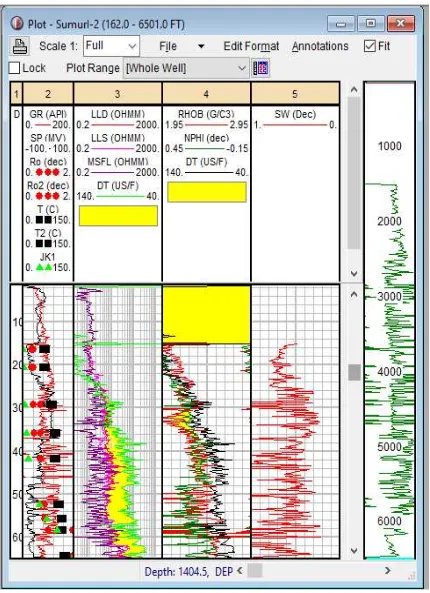
In this study, the data used is data log (gamma-ray, resistivity, neutron porosity, density), geochemical data (Ro) and thermal data (temperature). Data processing was performed using Interactive software Petro- physics (IP) and Thermal 3D, as well as measurement coring to obtain geochemical data (Ro). The research area is the Central Sumatra Basin. In this study a detailed flow chart shown in Figure 3.
RESULTS AND DISCUSSION
Rhermal Conductivity, Gradien Temperatur, dan Heat Flow
The results of data processing based on the measurement of the thermal conductivity of rocks, wells produce heat conductivity values are summarized in Table 3 and 4. Table 3 shows in temperature wells (Gts), geothermal heat flow (Heat Flow) on wells I-1 and I-2 is based on the measurement of conductivity oanas rocks (KB). Table 4 shows the results of the processing of group formation thermal conductivity (KKF), gradient temperatur formation group (GTKF) and and temperature at depth change eraser (dZ) in the wells I-1 by. Table 5 shows the results of the processing of group formation pannas conductivity (KKF) gradient temperature formation group (GTKF) and temperature on any changes in the well depth dZ I-2 is based on the measurement KB.
Vitrinite Reflectance, Temperature and T3D
Ro measurement results, temperature, and T3D at sumus I-1 and I-2 in the Regions 'Y' Central Sumatra contained in Tables 6 and 7. Table 6 shows the depth value, Ro, temperature, and T3D the wells I-1 Table 7 shows the depth data, Ro, temperature, T3D and description of the hydrocarbon level on wells I-1.
Log Data Analysis
Ro and temperature measurement that has a value of Ro 0.34 to 0.40%, T 60-70 o C and T3D 2 ×10³ cal cm -3. At this depth there sparasi log NPHI and small RHOB suggesting possible hydrocarbon oil but immature, SW = 0.646 and with a small resistivity values. So the I-1 well at a depth of 2230,971 ft of data Ro, Temp, T3D, and log data (except LLD) both support that at this depth the productive layer containing organic material or immature oil. Furthermore, there are immature organic material (approaching mature) at a depth of 3080.709 ft on a permeable layer. Determination of the organic material from the research immature Ro and temperature measurement that has a value of Ro 0.4-0.44% T 80-90 o C T3D 5×10³cal cm-3 At this depth log data indicates sparasi between the NPHI and RHOB moderate, SW = 0.716 and has a resistivity values LLD 6.48 Ohmm. By looking at the log sparasi RHOB NPHI and the coating has a possibility of hydrocarbon oils containing immature (undercooked approach) is supported by data Ro, temperature, and T3D. At sumus I-1 also contained organic material that has been cooked at a depth of 3805.774 ft on a permeable layer. Determination of the organic material from the research is not yet mature from result of Ro and temperature measurement having a value of Ro 0.44-0.70%, T 90-100 o C and T3D 10 ×103 cal cm-3. In this layer there is cross over between log NPHI and RHOB, SW = 1 and has a resistivity of 10.9 Ohmm. So at a depth 3805.774 log data do not support Ro, Temperatre, and T3D data. Please note that the data log are only 1D that is only based on depth so have the possibilities in the area nearby or surrounding prospects or data to support. Furthermore, at a depth of 4166.667 ft mature organic material contained in the impermeable layer showed with a great response of gamma ray. Determination of the organic material from the research is not yet mature from the result of Ro and temperature measurement having a value of Ro 0.70-0.73%, T 90-100 o C and T3D 15 ×103 cal cm -3. In this layer there is a thin line between log sparasi NPHI and RHOB, SW = 0.609 and also sparasi between LLD and DT indicating oils hydrocarbon in mature level on shale layer or called oilshale. Value resistivity at depth is 2.48 Ohmm 4166.667 ft.
between LLD and DT indicating organic material Yag ripe yangberada in the source rock. Value resistivity at depth is 6.01 Ohmm 5232.940 ft and SW = 0598. At a depth of 5574.147 ft contained organic material passing mature or overmature the impermeable layer showed with a great response to gamma ray. Determination of the organic material from the research is not yet mature and temperature measurement Ro Ro having a value of 0.85-0.91%, T 110-120 o C and T3D 70×103cal cm-3. In this layer there between log sparasi NPHI and RHOB but there sparasi LLD and Dt, it indicates that this apisan adlah sorcerock ang menganduk too ripe organic material. Value resistivity at depth is 7.16 Ohmm 5574.147 ft and SW = 0772. At a depth of 5839.895 ft organic material contained in the gas impermeable layer showed with a great response to gamma ray. Determination of the organic material from the research is not yet mature and temperature measurement Ro having a value of Ro 1.00 -1.95%, T 110-120 o C and T3D 100×103
cal cm -3. In this layer there between log sparasi NPHI and RHOB but there sparasi between LLD and DT showing the organic material contained in the gas sorce rock. Value resistivity at depth is 16 Ohmm 5839.895 ft and SW = 1. At a depth of 6443.570 ft organic material contained in the gas permeable layer showed with a great response to gamma ray. Determination of the organic material from the research is not yet mature and temperature measurement Ro Ro having a value of 1.95-2.00%, T 120-130 o C and T3D 150×103 cal cm -3. In this layer there between log sparasi NPHI and RHOB. Value resistivity at depth is 39.2 Ohmm 6443.570 ft and SW = 0755. LLD resistivity value of log data at this depth is quite large compared with the previous depth. But the log data sparasi NPHI and RHOB not support the data Ro, temperature, and T3D. Please note that the data are only 1D log that is only based on depth so have the possibilities in the area nearby or surrounding prospects or data to support.
CONCLUSION
The conclusion of this research are:
1. The results show that the log data processing layer potential:
a. Wells II (614-615.4) m or (2014.4-2016.1) ft has a porosity value = (26.35-29.72)% and Rw = 0:45 Ohm-m.
b. Wells I-2 (797-893.8) m or (2614.8-2932.4) ft has a porosity value = (25.57-35.86)% and Rw = 0:45 Ohm-m.
2. The results of thermal method (T3D) and geochemistry are used to estimate the level of hydrocarbon maturation. Is
a. Early maturation (immature), indicated by geochemical indicators Ro = (0.34 to 0.44)%, T3D = (1-2) x10 3 cal cm -3 and T = (60-70) o C, for wells I-1 occurs at Z = (580-680) m or (1902.89-2230.97ft Well I-2 occur at Z = (502-629) m or (1646.98-2063.65) ft.
b. Mature indicated by Ro = (0.44 to 0.73)%, T3D = (10-15) x10 3 cal cm -3 and T = (90-100) o C, for wells I-1 Z = ( 1160-1270) m or (3805.77-4166.67) ft and the well I-2 occur at Z = (1096-1276) m or (2933.07-3595.8)
c. Over occur only in mature wells I-2 (1595-1699m) or (5232.95-5574.15) ft with Ro = 0.72 to 0.91)%, T3D = (50-70) x10 3 cal cm -3 and T = (100-120) o C.
d. Gas was found in wells I-2 (1780-1964m) or (5838.90-6443.57) with Ro = (1.00 to 2.00)%, T3D = (100-150) x10 3 cal cm -3 and T = ( 110-130) o C.
3. The results of log data on both wells are:
a. For I-1 well at a depth ft 1902.8871, 3805.7743 ft log data do not support the data Ro and temperature. At a depth ft 2230.9711, 3080.7087 ft, 4166.667 ft log data supports data Ro and temperature. b. For I-2 wells at a depth ft 1646.9816, 2063.6483 644.5696 ft ft and log data do not support the data Ro
and temperature. At a depth ft 2933.0709, 3595.8005 ft, ft 4186.3517, 5232.9396 ft, ft 5574.147, and 5839.895 ft log data supports data Ro and temperature.
c. Please note that the data are only 1D log that is only based on depth so have the possibilities in the area nearby or surrounding prospects or data to support.
BIBLIOGRAPHY
2. Dewanto, O., Analisa Hubungan Airan Panas Bumi Terhadap Awal Maturasi Hidrokarbon pada Cekungan Minak di Jawa Barat-Utara (Journal of Science and Technology, University of Lampung, Lampung, 2001) ISSN 0853-733X Vol. 7 No.3, pp. 29-42.
3. Dresser Atlas, Well Logging and Interpretation Techniques, The Course For Home Study, (Dresser Industries Inc., 1982), pp. 22-32, 39-94, 102-129, 165-178.
4. Eubank, R.T. and Makki, A.C., Strucktural Geologi of the Central Sumatra Basin (10th Annual Convention Indonesian Petroleum ing, Jakarta, 1981) p. 285-317
5. Gretener, P.E., Geothermics: Using Temperature in Hydrocarbone Exploration, in Short Course San Francisco Annual Meeting May 1981, The American Association of Petroleum Geologists Tulsa, (Oklahoma, USA, 1982), pp.1- 67.
6. Harsono, Adi, Evaluasi Formasi dan Aplikasi Log (Schlumberger Oilfield Service Mulia Center, Jakarta, 1997).
7. Kementrian Energi dan Sumber Daya Minera. Energi dan Sumber Daya Mineral (http://www.esdm./berita/migas/40-migas/4215-cadangan-shale-gas-indonesia-teridentifikasi-di-4-wilayah.htm l, 2016).
8. Kementrian Energi dan Sumber Daya Minera. ESDM: Potensi Shale Gas Indonesia Mencapai 574 TCF. (http://satunegeri.com/esdm-potensi-shale-gas-indonesia-mencapai-574-tcf/?utmsource=dlvr.it&utmmedium=f acebook, 2016).
9. Koesoemadinata, R.P., Geologi Minyak dan Gas Bumi (ITB, Bandung, 1978), pp. 194-204.
10. Purwanto, Andikm Analisa Suhu, Konduktivitas, dan Aliran Panas untuk Menafsir Struktur Bawah Prmukaan Daerah Air Putih Lebong Utara (Journal Gradients, 2007), Vol.3, pp. 252-256
11. Rahmat, Evaluasi Formasi dan Kalkulasi Cadangan Minyak Awal (Origin Oil in Place) Berdasar Data Sumur “TM” Lapangan “RM” (Thesis Field Studies tenik Geophysics, University of Lampung, Unpublished, 2015). 12. Subono, S. dan Siswoyo, Thermal Studies of Indonesian Oil Basin (CCOP Technical Bulletin, 1995) Vol. 25,
pp. 37-54.
13. Wibowo, R.A., Pemodelan Termal Sub-Cekungan Aman Utara Sunatera Tengah (Thesis Field of Earth Sciences Graduate Studies ITB, Unpublished, 1995).
14. Wijaya, Hangga, Petrofisik (https://www.academia.edu/9255218/PETROFISIK, 2014).
15. Zain, Riki Pahlevi, Analisa Multiatribut Seismik untuk Karakteristik Reservoar pada Lapangan Spinel Cekunggan Cooper-Eromanga Australia Selatan (www.lib.ui.ac.id/file?file=digital/20313093-S43643Analisa %20petrofisika .pdf, 2012).
Attachment.
TABLE 1. Hidrocarbon Condition Based on Temperature
Temperature Condition of HydrocarboN
TABLE 2. Maturity Level of Organic Matter Based on Ro (Dewanto O., 2001)