http://www.pphmj.com
http://dx.doi.org/10.17654/MS102030645
Volume 102, Number 3, 2017, Pages 645-654 ISSN: 0972-0871
Received: March 24, 2017; Accepted: June 5, 2017 2010 Mathematics Subject Classification: 62J12.
Keywords and phrases: longitudinal data, outlier, regression model.
A ROBUST PROCEDURE FOR GEE MODEL
Netti Herawati and Khoirin Nisa
Department of Mathematics University of Lampung Indonesia
Abstract
In longitudinal studies, multiple measurements are taken on the same subject at different points in time. Thus, observations for the same subject are correlated. This paper proposes a robust procedure for estimating parameters of regression model when generalized estimating equation (GEE) applied to longitudinal data that contains outliers. The procedure is a combination of the iteratively reweighted least square (IRLS) and least trimmed square (LTS) methods and is called iteratively reweighted least trimmed square (IRLTS). We conducted a simulation study for gamma model and Poisson model using the proposed method, the result shows that our approach can provide a better result than the classical GEE.
1. Introduction
semiparametric because they rely on specification of only the first two moments. Under correct model specification and mild regularity conditions, parameter estimates from GEEs are consistent. The generalized estimating equation approach requires correct specification of the first two moments of a model. However, these moment assumptions can be distorted by contaminated or irregular measurements namely outliers. As a result, the generalized estimating equation method fails to give consistent estimators, and more seriously this will lead to incorrect conclusions [1, 8]. In this situation, we need a robust method that can minimize the effect of outliers.
In recent years a few studies have considered robust methods for longitudinal data analysis, see e.g. [1, 2, 4, 8, 11]. In this paper, we combine the IRLS and LTS for obtaining a robust estimation of GEE when data contain outliers. We have shown the effectiveness of this procedure for normal model [7]. In this paper we apply the proposed procedure to gamma and Poisson models.
2. Generalized Estimating Equation
Let the vector of measurements on the ith subject be Yi =
[
Yi1,...,Yini]
Ti ≠ To model the relation between the response and covariates, we can
use a regression model similar to the generalized linear models:
( )
μi ηi Xiβ,g = =
where Vi be the covariance matrix of Yi modeled as Vi =λA1i 2R
( )
α A1i 2,i
A is a diagonal matrix of variance functions v
( )
μij , and R( )
α is theworking correlation matrix of Y i indexed by a vector of parameters .α
Solutions to equation (1) are obtained by alternating between estimation of λ and .α There are several specific choices of the form of working correlation
matrix Ri
( )
α commonly used to model the correlation matrix of Yi, amongthem are exchangeable and autoregressive correlation matrices.
Solving for β is done with iteratively reweighted least squares (IRLS).
The following is an algorithm for fitting the specified model using GEEs as described in [3] and [8]:
1. Compute an initial estimate of βˆGEE, for example with an ordinary
generalized linear model assuming independence.
2. A current estimate βˆGEE is updated by regressing the working
4. Iterate until convergence.
3. Iterated Reweighted Least Trimmed Square
using LTS [9] method is given by: smallest to largest. LTS is calculated by minimizing the h ordered squares
residuals, where h can be chosen between the range , 4
with n being sample size and number of parameters, respectively. One can refer to e.g. [9, 10] for some details on LTS method.
The IRLTS procedure is stated in the following short algorithm. To motivate this method, it is convenient to write the algorithm with involving the residuals.
3. Choose h observations which have the lowest h-residuals, we denote as subset H.
4. Improve estimates of β by solving βˆnew based on subset H using
IRLS.
5. Iterate until convergence.
4. Simulation Study
, 1 μij =β0 +β1x1ij +β2x2ij
( )
ij 0 1x1ij 2x2ij, Log μ =β +β +βwhere βk’s for k = 0,1, 2 are randomly generated, i =1, 2,...,200 and
. 5 ..., , 2 , 1 =
j The covariates x1ij are i.i.d. from a uniform distribution
( )
1,5 ,Unif and x2 is the measurement time variable, i.e., x2i =1, 2, 3, 4, 5. For each scenario, we generate the data based on the underlying true correlation structures as exchangeable and autoregressive with α = 0.5. For the first model (inverse link) the gamma distributed model was used, and for the second model (log link) the Poisson distributed model was applied. In this simulation, 1000 Monte Carlo data sets were generated for each scenario. We considered contamination proportion in data ε = 5%,10%, 20% and
30%. We evaluated the results using the mean square error (MSE) of the parameter estimates.
We provide the expected values and MSEs of parameter estimates resulted from our simulation on Table 1-Table 4. Table 1 and Table 2 show the expected values and MSEs of parameter estimates for the first model, while Table 3 and Table 4 for the second model.
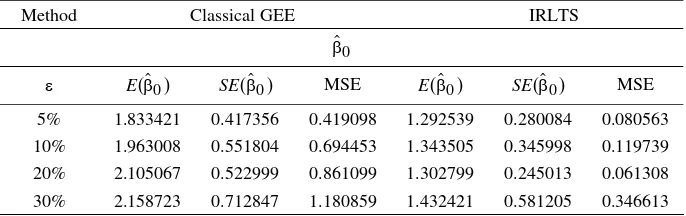
Table 1. The expected values, standard errors and MSEs of βˆ for gamma i
distributed model with exchangeable correlation matrix
Method Classical GEE IRLTS
0
ˆ β
ε E( )βˆ0 ( )
0
ˆ β
1
ˆ β
ε E( )βˆ1 SE( )βˆ1 MSE E( )βˆ1 SE( )βˆ1 MSE
5% 0.664892 0.297197 0.205406 0.957103 0.034595 0.003693 10% 0.587415 0.348410 0.297492 0.968876 0.075239 0.007119 20% 0.314225 0.347369 0.600688 0.964959 0.039372 0.003323 30% 0.297561 0.338291 0.617832 0.937923 0.088894 0.012682
2 5% 0.743453 0.289166 0.174850 0.974127 0.039936 0.006689 10% 0.549449 0.423348 0.425292 0.958451 0.018566 0.007922 20% 0.355655 0.349199 0.597828 0.975630 0.032734 0.005954 30% 0.332191 0.336312 0.621917 0.969043 0.071512 0.010960
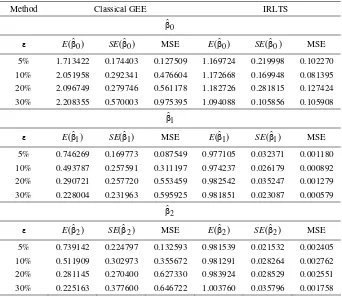
Table 2. The expected values, standard errors and MSEs of βˆ for gamma i
distributed model with autoregressive correlation matrix
Method Classical GEE IRLTS
0 5% 1.713422 0.174403 0.127509 1.169724 0.219998 0.102270 10% 2.051958 0.292341 0.476604 1.172668 0.169948 0.081395 20% 2.096749 0.279746 0.561178 1.182726 0.281815 0.127424 30% 2.208355 0.570003 0.975395 1.094088 0.105856 0.105908
1
ˆ β
ε E( )βˆ1 SE( )βˆ1 MSE E( )βˆ1 SE( )βˆ1 MSE
5% 0.746269 0.169773 0.087549 0.977105 0.032371 0.001180 10% 0.493787 0.257591 0.311197 0.974237 0.026179 0.000892 20% 0.290721 0.257720 0.553459 0.982542 0.035247 0.001279 30% 0.228004 0.231963 0.595925 0.981851 0.023087 0.000579
As shown in Table 1 and Table 2, our approach (IRLTS) performs better than the classical GEE. The MSEs of IRLTS are smaller than the MSEs of
classical GEE, the outliers influence the estimation of βˆ0, βˆ1 and βˆ2. The parameter estimates of classical GEE are much more influenced than the parameter estimates of IRLTS. The more outliers contained in the data the larger the deviation of classical GEE estimates from the parameter value. In Table 3 and Table 4, the behavior of MSEs of both methods is the same as the first case, here we can see that IRLTS performs better than the classical GEE because the MSEs of IRLTS are smaller than the MSEs of classical GEE.
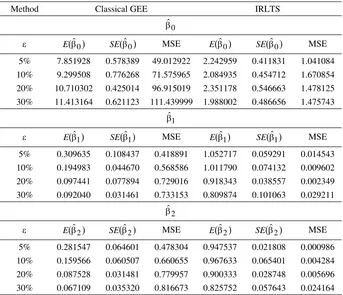
Table 3. The expected values, standard errors and MSEs of βˆ for Poisson i
distributed model with exchangeable correlation matrix
Method Classical GEE IRLTS
0
ˆ β
ε E( )βˆ0 ( )
0
ˆ β
SE MSE E( )βˆ0 SE( )βˆ0 MSE 5% 7.851928 0.578389 49.012922 2.242959 0.411831 1.041084 10% 9.299508 0.776268 71.575965 2.084935 0.454712 1.670854 20% 10.710302 0.425014 96.915019 2.351178 0.546663 1.478125 30% 11.413164 0.621123 111.439999 1.988002 0.486656 1.475743
1
ˆ β
ε E( )βˆ1 SE( )βˆ1 MSE E( )βˆ1 SE( )βˆ1 MSE
5% 0.309635 0.108437 0.418891 1.052717 0.059291 0.014543 10% 0.194983 0.044670 0.568586 1.011790 0.074132 0.009602 20% 0.097441 0.077894 0.729016 0.918343 0.038557 0.002349 30% 0.092040 0.031461 0.733153 0.809874 0.101063 0.029211
2
ˆ β
ε E( )βˆ2 ( )
2
ˆ β
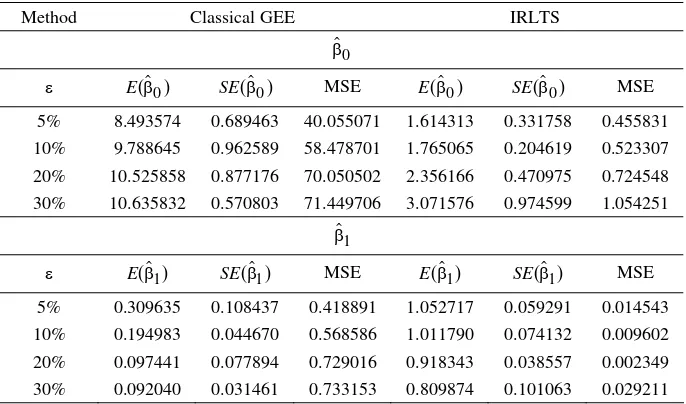
The result for Poisson model shows similar behavior to the result for gamma model. For the result of Poisson model in Table 3 and Table 4, IRLTS also performs better than the classical GEE. The MSEs of IRLTS are smaller than the MSEs of classical GEE, the outliers influence the estimation
of ,βˆ0 βˆ1 and βˆ2. The parameter estimates of classical GEE are much more influenced than the parameter estimates of IRLTS. The more outliers contained in the data the larger the deviation of classical GEE estimates from the parameter value. In Table 3 and Table 4, the behavior of MSEs of both methods is the same as the first case, here we can see that IRLTS performs better than the classical GEE.
The estimation of IRLTS yields better results than classical GEE for both cases we considered here. The MSEs of IRLTS is smaller than classical GEE, this means that IRLTS can reduce the influence of the high leverage points better than the classical GEE.
Table 4. The expected values, standard errors and MSEs of βˆ for Poisson i
distributed model with autoregressive correlation matrix
Method Classical GEE IRLTS
0
ˆ β
ε E( )βˆ0 SE( )βˆ0 MSE E( )βˆ0 SE( )βˆ0 MSE
5% 8.493574 0.689463 40.055071 1.614313 0.331758 0.455831 10% 9.788645 0.962589 58.478701 1.765065 0.204619 0.523307 20% 10.525858 0.877176 70.050502 2.356166 0.470975 0.724548 30% 10.635832 0.570803 71.449706 3.071576 0.974599 1.054251
1
ˆ β
ε E( )βˆ1 ( )
1
ˆ β
2
ˆ β
ε E( )βˆ2 SE( )βˆ2 MSE E( )βˆ2 SE( )βˆ2 MSE
5% 0.281547 0.064601 0.478304 0.947537 0.021808 0.000986 10% 0.159566 0.060507 0.660655 0.967633 0.065401 0.004284 20% 0.087528 0.031481 0.779957 0.900333 0.028748 0.005696 30% 0.067109 0.035320 0.816673 0.825752 0.057643 0.024164
5. Concluding Remark
In this paper, we have shown that our proposed procedure can minimize the effect of outliers on parameter estimation; IRLTS can produce a relatively efficient and consistent estimator compared to the classical GEE (IRLS). Based on the MSE, IRLTS performs much better than the classical GEE for gamma and Poisson models.
Acknowledgement
The authors would like to thank the anonymous referees for their valuable suggestions and comments that led to a considerably improved manuscript.
References
[1] A. Abebe, J. W. McKean, J. D. Kloke and Y. Bilgic, Iterated reweighted rank-based estimates for GEE models, Technical Report, 2014.
[2] P. S. Gill, A robust mixed linear model analysis for longitudinal data, Stat. Med. 19 (2000), 975-987.
[3] G. Johnston and M. Stokes, Repeated measures analysis with discrete data using the SAS system, SUGI Proceeding, SAS Institute Inc., Cary, NC, 1996.
[4] S. H. Jung and Z. Ying, Rank-based regression with repeated measurements data, Biometrika 90 (2003), 732-740.
[5] K. Y. Liang and S. L. Zeger, Longitudinal data analysis using generalized linear models, Biometrika 73 (1986), 13-22.
[7] K. Nisa and N. Herawati, Robust estimation of generalized estimating equation when data contain outliers, INSIST 2 (2017), 1-5.
[8] B. F. Qaqish and J. S. Preisser, Resistant fits for regression with correlated outcomes: an estimating equations approach, J. Statist. Plann. Inference 75(2) (1999), 415-431.
[9] R. J. Rousseeuw and A. M. Leroy, Robust Regression and Outlier Detection, Wiley, New York, 1987.
[10] P. J. Rousseeuw and K. van Driessen, Computing LTS regression for large data sets, Data Mining and Knowledge Discovery 12 (2006), 29-45.