1
The Correlation Of Polymorphism Of Growth Hormone To
The Pre-Weaning Saburai Goat Growth
Sulastri, Siswanto, and Kusuma Adhianto
Department of Animal Husbandry Faculty of Agriculture University of Lampung Jl. Prof. Dr. Soemantri Brojonegoro No.1 Gedong Meneng
2 The Correlation Of Polymorphism Of Growth Hormone To
The Pre-Weaning Saburai Goat Growth Abstract
Polymorphisms of growth hormone gene were analyzed for association with pre-weaning growth of female Saburai goat. Analysis of PCR-RFLP (polymerase chain reaction-restriction fragment length polymorphism) was conducted to determine polymorphism in two single nucleotide polymorphisms (SNPs) that A781G (Ser / Gly35) and A1575G (Leu147). The frequency of allele A, B, C, and D of 0.68, 0.32, 0.50, and 0.50. The results of analysis using SNPs A781G, 22 female saburai goat are heterosigot AB and 12 homozygous AA. Growth performance at birth with genotype AB was higher than AA (weight 3.04±0.20 kg vs 2.94±0.05 kg, height 12.79±1.02 cm vs 11.12±0.19 cm, body length 15.03±0.55 cm vs 12.83±0.76 cm, chest circumference 15.18±0.55 cm vs 14.46±0.21 cm), also growth performance at weaning with genotype AB was higher than AA (weight 29.92±1.01 kg vs 29.56±0.67 kg, height 51.34±0.9 cm vs 50.90±1.01 cm, body length 50.40±1.13 cm vs 49.44± 0.85 cm, chest circumference 60.93±1.92 cm vs 59.44±0.81 cm, ADG pre weaning 0.299 ± 0.010 kg vs 0.296± 0.007 kg). It was concluded that the growth hormone gene in exon 2 to exon 3 (SNPs A781G) was polymorphic and has correlation to growth performance pre weaning female Saburai goat.
Keywords : Saburai goat, growth hormon polymorphisms
INTRODUCTION
The Saburai goat is a local genetic resource in Lampung province and it was
provisioned based on the Decree of Minister of Agriculture of Republic of Indonesia number
359/Kpts/PK.040/6/2015. This goat is a type raised for meat so that its growth is economical
in its kind (Sulastri and Sukur, 2015).
The Saburai goat growth varies. It is suspected to be caused by the genotype diversity
which control the goat growth. This genotype diversity is used as a basic for Saburai goat
selection with a high growth performance to produce breed with higher performance that
their parents. The growth performance selection can be done with identification of genetic
polymorphism of growth hormone. The objective of this research was to find out the
correlation between genetic polymorphism of growth hormone and the pre-weaning Saburai
goat growth in Lampung province.
The goat growth genetic hormone has 17 chromosomes, it is composed from 2544
alkali nitrogen, and it has 5 exons and 4 nitrons (Kioka et al., 1989; Hua et al., 2009). Hua et
al. (2009) studied GH gene polymorphism in the male Boer goat as a candidate for genetic
3 (Leu147), were identified through the analysis of fragmenting and polymerase chain
reaction-restriction fragment length polymorphism (PCR-RFLP). The analysis results
showed that in the Boer goat genetic hormone of growth, there were genotypes AA, AB, CC
and CD. Based on these phenotypes, the goat could be grouped based on the body weights
and body measures.
Sun et al. (2010) observed 254 of individual goats (43 Boer goats, 111 with Xuhuai
goats, 100 Chinese Haimen goats) with PCR-SSCP and fragmening DNA methods. The
observation results showed that only exon II from FIT2 (fat-inducing transcript) gene that
was amplified with primary P5 from GIT gene which was proven to be polymorphic.
Irine (2011) reported his research results through polymerase chain reaction-single
strand conformation polymophism (PCR-SSCP) method that the exon II growth hormonal
gene in the PE goat, and the cross breed between PE and Saanen goats, was polymorphic.
The close relationship between polymorphism of growth hormonal gene and the growth
characteristics in some type of goats showed that this polymorphism could be used as
markers in selecting goat or as the marker asisted-selection (MAS).
MATERIAL AND METHOD
This research was conducted to 34 pre-weaning female Saburai lambs, born as twins,
and breed result of first parity product. Growth performance data including bodyweights and
body measures at birth and weaning (2-3 years old) were obtained from recording goats
owned by members of Pelita Karya III livestock farmer group in Dadapan village of
Sumberejo sub district, in Tanggamus district. The measures included body length, chest
circumference, chest depth, chest widt, waist height, ear length, and ear width.
3 ml of blood sample was taken from each of lamb individuals through jugular venous
by using 22 ½ G syringe and contained in BD Vacutainer K2 EDTA (K2) tube. Blood sample
was analyzed in the biochemistry laboratory of Faculty of Medicine in Gadjah Mada
University. DNA isolation was conducted by using Wizard® Genomic DNA Purification Kit
(Promega, USA). Analyses were done by using PCR KIT and GH gene primers (GHF-1 and
GHR-1 primers; GHF-2 and GHR-2 primers) shown in Table 1 and restriction enzyme
HaeIII.
4 The gene GH multiplication was conducted by using Polymerase Chain Reaction
(PCR). Primers to use and design were based on the sequences of DNA gGH (Gene Bank
Accesion No. D00476). These primers (Table 1) referred to the research by Hua et al. (2009)
in testing the correlation of GH gene polymorphism in the male Boer goat.
The 422 bp and 116 bp DNA fragments were amplified by using GH primer gene.
The total of volume for PCR reaction in this research was 25 µ l which contained of 20 µ l
PCR Master Mix; 2 µ l for each of forward primer and reverse primer ddH2O and 1 µ l DNA
template. The PCR operational program was conducted according to recommendation of Hua
et al. (2009) shown in Table 2.
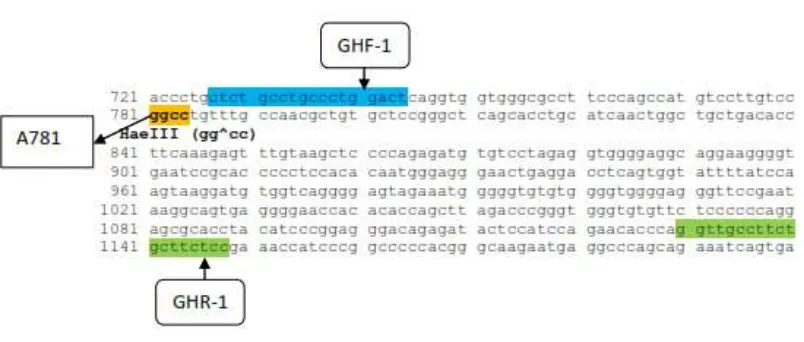
Detection of GH Gene Polymorphism with RFLP Method
422 bp and 116 bp PCR products were cut by using HaeIII (GG^CC) restriction
enzyme. Appearing alleles in the PCR 422 product (exon 2 and 3 regions) were allele A (366
bp and 56 bp) and allele B (422 bp). The genotypes having chance to appear were genotype
AA (366 bp and 56 bp), AB (422 bp, 366 bp and 56 bp), and BB (422 bp). The HaeIII
enzyme cutting sites are shown in Figure 1.
The alleles having chance to appear in PCR 116 product (exon 4 region) were allele
C (88 bp and 28 bp) and allele D (116 bp). Genotypes having chance to appear were genotype
CC (88 bp and 28 bp), CD (116 bp, 88 bp and 28 bp), and DD (116 bp). The enzyme cutting
sites are shown in Figure 2.
Data Analysis
The frequencies of genotypes and alleles of GH genes in exon 2, 3, and 4 for each
type of goat were estimated by using a formula recommended by Hardjosubroto (1998):
population
*) this formula applies for BB, AB, CC, CD, and DD genotypes
B)
5 RESULT AND DISCUSSION
Genotype in the Saburai Goat Growth Hormone Gene
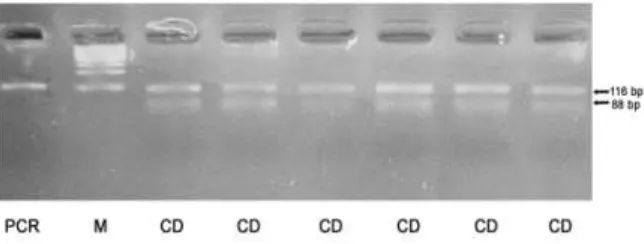
Single nucleotide polymorphisms (SNP) A781G located in exon 2 to exon 3 were
used to identify genotypes through PCR-RFLP procedures. Two fragment in PCR 22 base
pair (bp) product digested by using HaeIII restriction enzyme were identified successfully.
AA genotype was identified as fragments with size of 366 and 56 bp. Three fragments were
identified as AB genotype with sizes of 422, 366 and 56 bp (Figure 3).
The research results showed that by using SNPs A781G, 22 Saburai lambs were
identified as individuals with AB heterozygotes and 12 lambs as homozygote individuals
with AA genotype. However, no individual had BB genotype.
Single nucleotide polymorphisms (SNPs) A1575G which was located in exon 4
could also be used to identify CD genotype with PCR-RFLP procedure. HaeIII restriction
enzyme was also used to digest PCR product with size of 116 bp. Framents with sizes of 116
bp, 88 bp, and 28 bp could be identified in individuals with CD genotype (Figure 4). Letter M
in Figure 4 and 5 is a marker as it is recommended by Hua et al. (2009). All Saburai lambs
identified by using SNPs A1575G were found to have CD heterozygote genotype.
GH gene polymorphism in 34 Saburai lambs showed that BB, CC, and DD
genotypes were not found in all observed individuals. Individuals with BB genotype were
also not found in the Boer goat population (Hua et al., 2009).
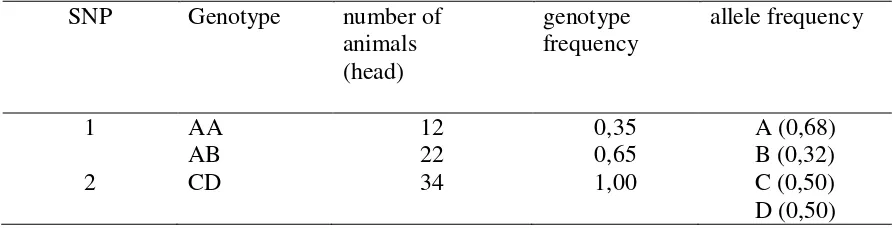
Frequencies of Allele and Polymorphism
Frequencies of allele A, B, C, and D in Saburai lamb GH gene were respectively 0,68,
0,32, 0,50, and 0,50. Saburai lamb GH gene was polymorphic because the frequencies of
these alleles were respectively lower than 0.99. Gene is determined to be polymorphic when
alleles in the gene are not more that 0.99 (Harris, 1994).
The allele A frequency (0.68) was higher than allele B (0.32), and this indicated that
the change of allele A appearance in the Saburai lamb was higher than allele B. the reason
was that allele A appeared in 22 lambs with AB genotypes and 12 lambs with AA genotype,
while allele B appeared only in 12 AB genotype lamb. In addition, there was no Sabuari lamb
having BB genotype, where this increased the chance of allele A to appear in the observed
6 The research result showed that there was no BB genotype found in SNPs A781G,
and there were no CC and DD genotypes were found in SNPs A1575G. It was suspected
because of the particular breeding setting. This breeding setting made lower chance of
appearance of genotype which regulated characteristics not expected by the livestock farmers.
Unfound particular genotypes were also reported in other researchers. In the male
Boer goat population, there was AA genotype found in 25 lambs and AB genotype in 129
lambs, but there was no BB genotype found. Allele A frequency (0.68) in pre-weaning
female Saburai lamb in this research was higher than allele B frequency (0.32). It was also
similar to the research result of male Boer goat population which showed that allele A
frequency (0.5812) was higher than allele B (0.4188) as it was reported by Hua et al. (2009).
The frequencies of allele C and D in this research was respectively 0.50 because the
observed female Sabuari lambs were all having CD heterozygote genotype (CD genotype
frequency of 100%).
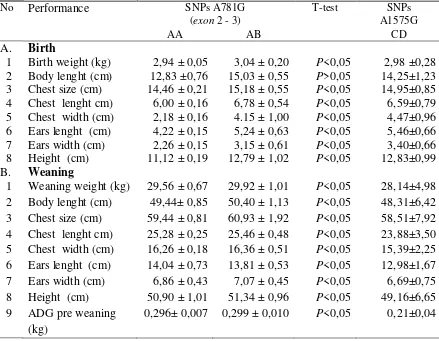
The Correlation of GH Gen Polymorphism with Growth Performance
The research results showed that pre-weaning female Sabuari lambs with AB
genotype had higher growth performance than those with AA genotype (Table 3). Higher
growth performance of the Saburai lambs with AB genotype showed that GH gene
polymorphism correlated to the pre-weaning female Saburai lamb performance. The gene
polymorphism is determined to have correlation with a particular performance if this
polymorphism is able to group performances in the different groups strictly (Hua et al.,
2009).
The inborn growth characteristics in individuals with AB genotype was higher than
AA genotype except body length which did not show differences statistically (P>0.05). The
growth performance at weaning from individuals with AB genotype was also higher than
those with AA genotype. It is shown in Table 3.
Higher growth performance of individuals with AB genotype than those with AA
genotype indicated that genotype AB controlled higher growth in the observed Saburai
lambs.
The explanation above indicates that female Saburai lamb GH gene polymorphism in
7 performance. Therefore, GH gene polymorphism is suspected to be able to use for a marker
in selecting pre-weaning Saburai goat growth performance. Other researches also showed the
correlation between polymorphism of GH gene detected with SNPs A781G in exon 2 to
pre-weaning and post-pre-weaning male Boer goats (Hua et al., 2009).
All of the Saburai goats in this research had CD genotype which showed weaning
weigth of 28.14 kg, body length of 48.31 cm, and body height of 49.16 cm. Saburai goat
body length and height in this research result are not significantly different to the research
result of Hua et al. (2009). The body weight differences are suspected to be caused by genetic
and environment differences. Observed Saburai goats in this research have PE genetics of
local goat, so that cross breeding goat is easier and faster to adapt with local environment
conditions. Boer goat is east to have adaptation with varying environment conditions so that
it is often to be cross bred with other types of goats. Characteristics to consider when
selecting type of goat for goat feed lot business are its adaptation ability, reproduction
characteristic, and growth performance. Goat with high adaptation ability will be able to have
maximum reproduction where ever it is raised (Casey dan Van Niekerk, 1988).
CONCLUSION
It was concluded that the growth hormone gene in exon 2 to exon 3 (SNPs A781G) was
polymorphic and has correlation to growth performance pre weaning female Saburai goat.
REFERENCES
Casey, N. H. dan W. A. Van Niekerk. 1988. The Boer goat , origin, adaptability, performace testing, reproductive, and milk production. Small Rumin. Res. 1:291 – 302.
Hardjosubroto, W. 1998. Genetika Hewan. Fakultas Peternakan. Universitas Gadjah Mada. Yogyakarta. .
Harris, H. 1994. Dasar-dasar Genetika Biokemis Manusia. Edisi Ketiga. Diterjemahkan oleh Abdul Salam M Sofro, Ph.D. Gadjah Mada University Press. Yogyakarta.
Hua, G.H. , S.L. Chen, J.N. Yu, K.L. Cai, C.J. Wua, Q.L. Li, C.Y. Zhang, A.X. Liang, L. Hana, L.Y. Geng, Z. Shen, D.Q. Xu and L.G. Yang. 2009. Polymorphism of the growth hormone gene and its association with growth traits in Boer goat bucks. Meat Sci. 81: 391 - 395.
PCR-8 SSCP. Skripsi. Departemen Ilmu Produksi dan Teknologi Peternakan. Fakultas Peternakan. IPB. Bogor.
Kioka, N, E. Manabe, M. Abe, H. Hashi, M. Yato,M. Okuno, Y. Yamano, H. Sakai, T. Komano, K. Otsumi and A. Iritani. 1989. Cloning and Sequencing of Goat Growth Hormone Gene. Agric. Biol. Chem. 53 (6): 1583-1587.
Sulastri dan Sukur. 2015. Evaluasi kinerja wilayah sumber bibit Kambing Saburai di
Kabupaten Tanggamus. Prosiding Seminar Nasional Sains & Teknologi VI. Lembaga Penelitian dan Pengabdian Universitas Lampung : 282 -- 290
9 TABLE
Table 1. Primer name and primer sequences GH gene, size of the PCR product and amplification
GHF-2 5’-TCAGCAGAGTCTTCACCAAC-3’ 116 bp Exon 4
GHR-2 5’-CAACAACGCCATCCTCAC-3’
Table 2. Operational Program of PCR
Cycle Temperature (oC) Time
Table 3. Frequency of alleles and genotypes at GH gene female Saburai goat
10 Tabel 4. Performance at birth and weaning Saburai goat kids on
genotypes AA, AB and CD
No Performance SNPs A781G
(exon 2 - 3)
T-test SNPs
A1575G
AA AB CD
A. Birth
1 Birth weight (kg) 2,94 ± 0,05 3,04 ± 0,20 P<0,05 2,98 ±0,28 2 Body lenght (cm) 12,83 ±0,76 15,03 ± 0,55 P>0,05 14,25±1,23 3 Chest size (cm) 14,46 ± 0,21 15,18 ± 0,55 P<0,05 14,95±0,85 4 Chest lenght cm) 6,00 ± 0,16 6,78 ± 0,54 P<0,05 6,59±0,79 5 Chest width (cm) 2,18 ± 0,16 4.15 ± 1,00 P<0,05 4,47±0,96 6 Ears lenght (cm) 4,22 ± 0,15 5,24 ± 0,63 P<0,05 5,46±0,66 7 Ears width (cm) 2,26 ± 0,15 3,15 ± 0,61 P<0,05 3,40±0,66 8 Height (cm) 11,12 ± 0,19 12,79 ± 1,02 P<0,05 12,83±0,99 B. Weaning
1 Weaning weight (kg) 29,56 ± 0,67 29,92 ± 1,01 P<0,05 28,14±4,98 2 Body lenght (cm) 49,44± 0,85 50,40 ± 1,13 P<0,05 48,31±6,42 3 Chest size (cm) 59,44 ± 0,81 60,93 ± 1,92 P<0,05 58,51±7,92 4 Chest lenght cm) 25,28 ± 0,25 25,46 ± 0,48 P<0,05 23,88±3,50 5 Chest width (cm) 16,26 ± 0,18 16,36 ± 0,51 P<0,05 15,39±2,25 6 Ears lenght (cm) 14,04 ± 0,73 13,81 ± 0,53 P<0,05 12,98±1,67 7 Ears width (cm) 6,86 ± 0,43 7,07 ± 0,45 P<0,05 6,69±0,75 8 Height (cm) 50,90 ± 1,01 51,34 ± 0,96 P<0,05 49,16±6,65 9 ADG pre weaning
(kg)
11 .
Figure 1. The layout of the enzyme HaeIII cuts in areas exon 2 dan3
.
12 Figure 3. PCR-RFLP pattern of SNPs A781G GH gene were digested with HaeIII
Figure 4. PCR-RFLP pattern of SNPs A1575G GH gene were digested with HaeIII