R
ISK
M
ANAGEMENT
C
ASE
S
TUDY
Table of Contents
Executive Summary ... 3
Major risks to the company ... 3
Modelling Approach ... 4
Modelling Process ... 4
Model Output ... 6
Financial Impact and Risk Tolerance ... 8
Combining model results and risk tolerance ... 9
Impact of recent events ... 9
Description of the risks modelled ... 10
Commodity Price ... 10
Scenarios tested ... 100
Risk mitigation options ... 11
Natural Disaster ... 122
Scenarios tested ... 122
Risk mitigation options ... 122
Results of scenario testing ... 122
Industrial Accident ... 133
Scenarios tested ... 133
Risk mitigation options ... 133
Results of scenario testing ... 133
Political Instability ... 144
Scenarios tested ... 144
Risk mitigation options ... 144
Results of scenario testing ... 144
Variation in Resource Availability ... 15
Description of the model and scenario tested ... 15
Risk mitigation options ... 15
Results of scenario testing ... 155
Risk Summary ... 16
Conclusion ... 16
Executive Summary
This report is an example of an actuarial risk modelling approach. It is intended as a starting point in a multi-disciplinary approach to risk modelling within an oil & gas company.
This report is a case study of the potential major risks faced by an upstream oil and gas production company. The report was produced as a practical example of some of the possible steps the directors of the company could take towards meeting the FRC risk reporting requirements.
The case study shows modelling of five of the key risks to the company individually and in aggregate using estimates of the likelihood, impact and correlation of these risks.
The risk identification work and analysis was performed using publically available information and data. Therefore, the risks were identified and prioritised based on their description in the various data sources used for this case study. To refine both risk prioritisation and modelling methodology, the risks could be discussed with industry professionals.
This case study highlights some of the areas where actuaries could help companies in the oil gas industry to comply with the new FRC risk-reporting guidelines by working with other professionals to build and analyse suitable risk models.
Major risks to the company
As part of the case study we reviewed the information contained in the annual returns for various companies in the oil and gas industry between 2009 and 2013. We also reviewed various industry publications and reports from rating agencies to determine a list of risks that the company may face in achieving its strategic objectives.
We prioritised the risks using the following criteria:
1. The level of importance the individual data sources placed on the risk
2. The number of times the risk was mentioned in the sources we used for the case study 3. The feasibility of modelling the risk numerically
Below is the resulting prioritised risk list:
Category Risk Description
Modelled Risk
Economic ■ Commodity Price Volatility and decreases in oil
or natural gas prices leading to worsened operating results and future prospects.
YES
Environmental ■ Natural Disaster Natural catastrophe leading to
interrupted or reduced production or industrial accident
Category Risk Description
Modelled Risk
Operational ■ Industrial Accident Major accident or oil spill
resulting in loss of life, environmental damage, regulatory fines, civil liability, loss of licence to operate and reputational damage.
YES
Political ■ Political Instability Disruption of supply due to
war, civil war, guerrilla attack, terrorism or other political instability.
YES
Resource ■ Resource Availability Material change in estimates
regarding oil and gas reserves or development potential.
YES
Apart from above risks, there are many other risks such as foreign exchange, insurance risk, joint ventures, competition, credit risk, transportation infrastructure, general protection safety, legal and regulatory requirement etc. which can be analysed in similar way.
Modelling Approach
We chose stochastic modelling approach as it involves using a statistical distribution to represent the range of possible outcomes for the company.
We chose this modelling approach due to its many advantages. It is realistic in that it simulates a wide variety of outcomes and can show what would happen if two or more of the risks occurred at the same time. It allows us to specify which outcomes are relatively more likely to occur, and which
c) Industrial Accident d) Political Instability e) Resource Availability
The modelling process involved three steps: 1. Modelling individual risks
2. Based on the Risk Flow diagram below we estimated the degree to which the five individual risks were related.
3. The impact of the risks o the Co pa s fi a ial i di ators as the odelled ased o 10,000 random scenarios of commodity price movement and associated loss events.
We considered the following financial indicators:
a) Profit After Tax
b) Cash and Cash Equivalents c) Return on Capital
d) Share Price Risk Relationships
The five key risks selected for modelling are related and the occurrence of one may affect another. The Risk Flow diagram below provides an overview of the possible relationships between the Price decreases may lead to pressure on the company and less emphasis on
Market concern over ceased production or blocked supply. Increases may possibly fuel
The figure above is based on our understanding of the individual risks. It is designed to provide an indicative view of how the individual risks may relate to one another.
Model Output
The following graphs show the range of model results along with their relative likelihood.
0% 2% 4% 6% 8% 10% 12% 14% 16%
50,000,000 200,000,000 350,000,000 500,000,000
Pe
rc
en
til
e
Profit After Tax
Profit After Tax
0% 1% 2% 3% 4% 5% 6% 7% 8%
2% 5% 8% 11% 14% 17% 20% 23%
Pe
rce
nt
ile
The table below shows the individual effects of each modelled risk. Note that the potential change in commodity price has a range of outcomes, while the other risks are modelled as once-off events.
The main driver of the model results is the change in commodity price. The other loss scenarios are
e pe ted to e a sor ed the o pa s e isti g ash reser es (which were nearly £303.55 m at time of modelling), except for a major industrial accident. Scenarios of sharp commodity price drop or industrial accident occurrence see return on capital going negative and the company running out of cash. Therefore model results indicate that the company is vulnerable to commodity price decreases, although in most scenarios commodity prices increase (which also offsets other losses if they occur).
Depending on insurance cover, a major industrial accident could have a catastrophic effect on profitability, highlighting the importance of safety processes.
The risk of political instability was assumed to be higher than either that of a major industrial accident or a natural disaster, but the cost of such incidents is expected to be lower.
Name Graph Min
Profit After Tax -2,315.22 269.07 4,745.97
The o pa s operatio s i o e ou tr are e posed to risk in multiple areas: political instability and earthquake, which may in turn influence instability.
Overall, the company is exposed to the major risks typical of its industry and has specific exposure in certain locations. Building a risk model of the company accounting for the key risks provides a more complete and realistic picture of company activities and potential scenarios. The company can use the results to gauge how its risk tolerance matches the risk of becoming insolvent.
Note: The model results are sensitive to the assumed inputs and may change given further information on the company and its operations.
Financial Impact and Risk Tolerance
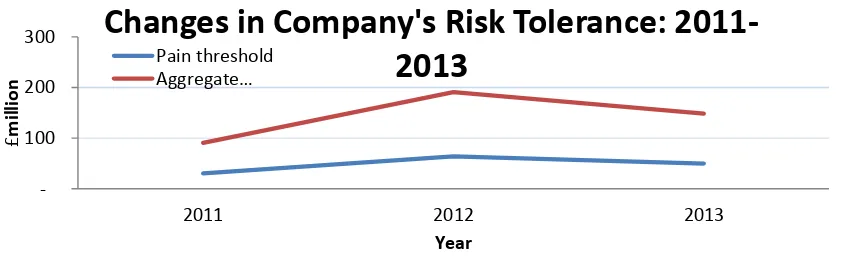
Figure 3 shows change in the respective risk tolerance thresholds for the Company over the past 3 years.
We can see that the thresholds have reduced and narrowed for the 2013 compared to 2012. This is largely attributed to the increase in the long-term debt capital raised by the company in 2013 and the related financial commitments the Company must honour thus leaving the Company with less free capital that can be used as a buffer against unforeseen events. So, it is necessary to estimate the likelihood of company breaching the threshold level. The section below combines Risk Tolerance and Return on Capital.
100 200 300
2011 2012 2013
£
m
il
li
o
n
Year
Changes in Company's Risk Tolerance:
2011-2013
Pain threshold
Combining model results and risk tolerance
We can combine the Risk Tolerance with the return on capital model results to produce an indication of how likely it is that the company would breach these threshold levels.
The above graph shows the return on capital distribution with the Aggregated Risk Tolerance highlighted.
As discussed above the Aggregated Risk Tolerance of the company would be reached when the Return on Capital falls below its debt cost of capital. This would require around a 12% drop in
o odit pri e, hi h ased o the odel results is a e e t hi h has appro i atel 1 i 4
chance of occurring.
Impact of recent events
While we were preparing this case study, oil prices actually fell by over 50% compared to 2014 average price levels. The share price of our test company fell by nearly 60%, indicating this companys ul era ilit to commodity price falls, probably due to the nature of its projects (in high cost and moderately risky locations) and the level of debt it carries.
Output such as this can be used to illustrate how the level of risk taken by the company compares to the risk tolerance assumed by the board, and what events need to occur for the return on capital to fall below these levels. In this case, the conclusion that the company had a reasonably high chance of breaching its thresholds has been supported by actual events.
Description of the risks modelled
Commodity Price
Scenarios tested
The graph below shows the historic data related to the price of crude oil between 1960 and 2012.
It can be seen that the oil prices have been steadily rising over the past 50 years. However, the changes in the average annual price show that there have been both significant positive and negative fluctuations.
We considered the changes in the average oil prices between 1960 and 2012. We split the magnitude of the negative fluctuations into a number of mutually exclusive bands. Where the values fell into the relevant bands, the number of such instances was counted. The probability of the oil price falling by a given amount was then calculated based on the number of instances the event occurred versus the total number of years of historic data observed.
-The table below shows the distribution of oil prices and the relevant oil revenues by scenario:
Historic experience shows that the commodity prices in any given year can go down by as much as 47% leading to a loss of revenues of over £0.67 bn.
In the model this potential movement was simulated using a distribution fitted to the historical movements, which indicated an average upward trend of 10.3% and standard deviation of 30.8%. This was intended to provide some indication of the potential variability in commodity price.
The figure above shows the distribution of the simulated risk outputs. We can see that while the commodity price is more likely to go up based on the historic movements, a downwards movement as large as 26.8% is within the 90% range of outcomes. Therefore, the company should be prepared to absorb the price fluctuations, which are at least within this range.
Note: The model does not allow prices to fall below zero.
Risk mitigation options
Commodity price risk can be managed in the short term by using a range of financial instruments and hedging strategies.
Natural Disaster
Scenarios tested
We considered a scenario where the Co pa s assets are e posed to a atural disaster, su h as typhoon. Such event may cause destruction to several off-shore platforms and lead to a prolonged disruption in production.
We estimated the cost of business interruption due to a natural disaster based and its impact on the volumes of daily production, the cost of restoration of services and clean up.
Risk mitigation options
The Company may consider employing the following risk mitigation options to better prepare for the potential consequences of a risk of natural disasters:
Crisis management preparation Earthquake risk review
Purchase of insurance to cover both the property component of the operations and the potential losses due to business interruption.
Results of scenario testing
Natural disasters can lead to substantial losses in this industry. However, much of this can be covered by insurance, taki g u h of the pressure off the o pa s fi ancial position.
Assuming that the company has appropriate levels of insurance protection in place, any given loss
out o e is likel to lead to so e fi a ial pressure o the Co pa s cash reserves along with need for some additional borrowing.
In our analysis we assumed that the impact of the loss would be spread over 1-5 years as facilities are brought back into operation. This is an important assumption and one that we have not been able to substantiate using only the publicly available information.
Industrial Accident
Scenarios tested
We performed our analysis based on a scenario with the Company experiences a major well blowout, fire, explosion or other incident in North Sea.
Any such incident may lead to loss of equipment and production, rescue and containment costs and a large volume of oil spilt into the sea with subsequent cost of clean-up and, potentially legal consequences. We estimated the costs associated with such incident and the probability of occurrence based on publically available information about past incidents.
Any such incident is likely to cause public concern and may lead to various consequences, such as increase in oil prices due to disruption of supply, political, regulatory or reputational impact. Not all of the consequences may materialise at the point when the event happens and therefore, we assumed that the company is likely to feel the pressure and experience financial costs from any such incidents over at least the following 20 years.
Risk mitigation options
There are a number of potential options to minimise the risk of industrial accident. The options below may help the Company in both avoiding this risk and mitigating the consequences of an industrial accident should it occur:
Increased focus on health and safety Inspections and process assessments Communication assessments
Emergency response preparation
Insurance covering the cost of property and business interruption
Results of scenario testing
Although unlikely, this is possibly the most severe risk faced by the company not only as an individual risk, but also as a risk that can potential impact the other areas of o pa s performance, such as, for example, reputation and ability to hire skilled personnel.
When performing our analysis, we made the following assumptions, which may need to be examined and verified in light of more information being available:
- The potential liability for an accident is large enough that the company would be forced to sell significant portions of assets in order to meet it
- Under this scenario, the company would incur significant upfront and ongoing costs relating to immediate incident response and subsequent litigation, compensation and clean-up costs
- The viability of the company may be threatened by immediate cashflow shortage and by long-term costs of incident
- It is likely to result in lower tax and dividend, due to the operating losses incurred
Overall, this risk may lead to an operating loss and a decrease in available cash all the way up to running out of cash. Depending on the actions taken to mitigate the loss and provide for the cost, this can lead to negative return on capital and significant reduction in the total net assets.
Political Instability
Scenarios tested
We o sidered a s e ario i hi h o pa s operatio s i a gi e ou tr a not safely continue due to a potential militant attack on the facilities or complete loss of control or access to the facilities due to political instability in the region.
The impact of this scenario may be loss of production due to loss of access to the facilities, oil spills and loss of equipment, the cost of rescue of the Company staff and other costs associated with military actions.
Risk mitigation options
The company may potentially address the probability and impact of this risk using the following options:
Review and aid security in region
Review and assess exposure in high-risk regions
Maintain relationships with government and local population
Results of scenario testing
If the event occurred, it is possible that the company would incur a substantial loss. However, much of this loss could potentially be covered by its insurance, if insured against this type of risk (war/terrorism).
Assuming that the relevant insurance cover is in place, we anticipate that the company would be able to meet the loss from its cash reserves along with some further borrowing.
In our model, the impact of the loss was assumed to spread over 1-3 years as facilities are brought back into operation. Further analysis along with discussions with industry experts in this area may be required to validate this assumption.
Should this risk materialise to a significant degree, the company may experience a decrease in operating profit, cash and Return on Capital. Actuaries can estimate the expected cost of the loss as well as the likelihood of occurrence using publicly available data. Actuaries would identify the risk with help of questionnaire.
Variation in Resource Availability
Description of the model and scenario tested
The Company depends on maintaining successful exploration and discovery projects to achieve the planned revenue. However, the level of production from a given field is an estimated value and may not materialise as originally expected. This risk is specific to the geological factors involved in estimation and projection of the expected capacity of the new projects. The data on the estimation techniques and the potential capacity of the new fields is not publicly available and as such the scenarios modelled are hypothetical.
We would expect the relevant data to be available from specialised industry sources and from within the company. Therefore, the approach to modelling this risk can be refined based on the more detailed data.
Risk mitigation options
The Company may consider the following actions to mitigate the impact and probability of this risk: - Direct resources to lower risk projects
- Invest in best available technology
- Ensure high standards of risk analysis before committing resources
Results of scenario testing
It is anticipated that company could meet this loss from existing cash reserves with minimal further borrowing.
In the model we assumed that the overall impact of this risk could be spread over 1-2 years as facilities are dismantled and transferred to other prospects. Further discussions with industry experts or access to more detailed information may aid in validation of this assumption.
Risk Summary
We have modelled five of the key risks to the company individually and in aggregate. We have used judgement in estimating the likelihood, impact and correlation of these risks and there is potential for further analysis to refine this.
Commodity Price The co pa s re e ue is dire tl depe de t o the a ual a erage le el
achieved selling the oil and gas. These are actively traded commodities and their price fluctuates depending on a large number of factors. Price fluctuations may be significant and are typically actively managed using financial instruments and hedging techniques.
Natural Disaster The company operates in a storm-prone Asia-Pacific region and one
earthquake-prone country. Major events are infrequent but possible. Event impact would be reduced with adequate insurance coverage.
Industrial Accident This could be a catastrophic risk that threatens the viability of company,
which emphasizes need for risk management and process safety.
Political Instability Potential exposure in one country should be monitored.
Resource Availability There is potential for the new projects to yield significantly lower
production volumes than initially estimated.
We have identified several other risks that could possibly be explored in more detail or added to the model. Those risks are noted in the risk list earlier in this document.
Conclusion
Appendix
Commodity Price
Description of the model
The o pa s ai sour e of re e ue is the sale of the oil a d gas it produ es. “hould the
Company fail to achieve the planned annual average oil price, this would have a direct impact on the
Co pa s re e ue.
We have modelled potential impact of commodity price rises and falls, based on historical movements in commodity prices. Actuaries can quantify the risk and identify demand and supply of commodity. Actuaries can model the risks involved in Demand and Supply. Actuaries build demand and supply curve to figure the impact of prices.
The impact of the loss on the financial statements of the company was examined.
Note: This analysis was completed before the recent (2014) oil price decline.
Natural Disaster
Description of the model
The company operates offshore oil production facilities in the Asia-Pacific region, in areas exposed to tropical cyclones.
The company also operates gas production facilities in a country exposed to earthquakes.
The fi a ial i pa t of a plausi le atural disaster affe ti g the o pa s operatio s as
modelled. Estimates of the expected cost of the loss as well as the likelihood of occurrence were produced using publicly available data.
The impact of the loss on the financial statements of the company was examined. Actuaries model the climate change to identify the frequency of Natural disaster.
Industrial Accident
Description of the model
The company operates offshore oil production facilities worldwide, including the UK North Sea. The extraction of oil offshore is an inherently complex and hazardous process that has the potential for disaster if not managed closely.
The fi a ial i pa t of a plausi le i dustrial a ide t affe ti g the o pa s operatio s as modelled. Estimates of the expected cost of the loss as well as the likelihood of occurrence were produced using publicly available data.
Political Instability
Description of the model
The company operates gas production facilities in Country ABC. Some production facilities are located in regions exposed to activity of militant groups leading to potential temporary or permanent loss of assets and access to the resources.
The fi a ial i pa t of a plausi le ilita t atta k affe ti g the o pa s operatio s as odelled.
Estimates of the expected cost of the loss as well as the likelihood of occurrence were produced using publicly available data.
The impact of the loss on the financial statements of the company was examined.
Reliances and limitations
This model only looks at 5 key risks to demonstrate how modelling techniques can be used in the risk management of the company. This can be extended to cover the multitude of risks faced by a
multinational Oil Gas company.
We have been limited to publicly available data. The report makes use of estimates and assumptions that could be refined with access to company data. Estimates can be improved with data on company operations, production, per-facility values and output, company share of facilities (in case of joint ownership/operation), and existing mitigation measures. The approach used in this case study is su je t to li ited a aila ilit of data regardi g o pa s operatio s.
Loss cost and likelihood estimates are highly uncertain and are provided for illustration purposes only. We anticipate that the eventual cost and outcome of these scenarios would vary from the estimated amounts.
The risk of natural disaster could be more fully quantified if we incorporated the output of commercially available software.
Disclaimer: This case study has been prepared on behalf of the Institute and Faculty of Actuaries (IFOA) to illustrate the capabilities of actuaries and the potential contribution of actuarial techniques to industry sectors outside the traditional actuarial areas of operation. The case study is a desk-top exercise which considers a number of risks applicable to a hypothetical company in one of those industries for the purposes of demonstration only, but the risk assessments were not performed in conjunction with relevant experts from those industries and so are not complete or conclusive. The IFoA does not accept any responsibility and/or liability whatsoever for the content or use of this document. This document does not constitute advice and should not be relied upon as such. The IFoA does not guarantee any outcome or result from the application of this document and no warranty as to the accuracy or correctness of this document is provided. You assume sole responsibility for your use of this case study, and for any and all conclusions drawn from its use. The IFoA hereby excludes all warranties, representations, conditions and all other terms of any kind whatsoever implied by statute or common law in relation to this report, to the fullest extent permitted by applicable law.