Hemoglobin Level, Energy Intake, and Body Mass Index of
Kebersihan,
Keindahan, Kenyamanan Lingkungan
Workers in an Academic
Institution
Carmelia Cantika Maharani,1 Reni Farenia,2 Pandji Irani Fianza3
1Faculty of Medicine Universitas Padjadjaran, 2Department of Anatomy, Cell Biology and Physiology Faculty of Medicine Universitas Padjadjaran 3Department of Internal Medicine Faculty of Medicine Universitas Padjadjaran/Dr. Hasan Sadikin General Hospital Bandung
Abstract
Background: Productivity is a priority that is required from every worker. Work productivity of each person is different. The important factors of work productivity are hemoglobin level, energy intake, and body mass index (BMI). The objective of the study was to identify hemoglobin level, energy intake, and BMI of Kebersihan, Keindahan, Kenyamanan Lingkungan (K3L) workers in Universitas Padjadjaran, Jatinangor.
Methods: A descriptive study was carried out to 80 K3L workers in Universitas Padjadjaran on October 2014. The total number of 80 workers was chosen with cluster random method. Primary data consisted of hemoglobin level measured by Hemocue®Hb 201+, dietary consumption recall (2x24 hours), and anthropometry data (weight and height). The collected data were analyzed and presented by frequency tabulation and percentage.
Results:The study showed that more than a half of subjects (77%) had normal hemoglobin level. The majority of subjects (47%) had low energy intake. Most of subjects (59%) had normal BMI, 12% subjects were underweight, 18% subjects were overweight, and 11% subjects were obesity.
Conclusions: The majority of K3L workers have normal hemoglobin level, energy intake deficiency, and
normal BMI.
Keywords: Body mass index, energy intake, hemoglobin.
Correspondence: Carmelia Cantika Maharani Faculty of Medicine, Universitas Padjadjaran, Jalan Raya Bandung-Sumedang Km.21, Jatinangor, Bandung-Sumedang, Indonesia, Phone: +6287774623773 Email: carmeliacantika@gmail.com
Introduction
Productivity is a priority that is required from every worker. Internal factors that determine work productivity consist of health, nutrition, education, and motivation of workers. Health
factors which related significantly to work
productivity is hemoglobin level in blood.1 Low hemoglobin level will reduce the ability to perform physical activity due to decrease
of oxygen exchange efficiency in skeletal
muscle. Thus, anaerobic metabolism occurs and it produces lactic acid.2 The accumulation of lactic acid leads to muscle fatigue and slow muscle work continuity, hence decrease the work capacity.2
Wolgemuth et al.1 showed that 1.3 g/dl increase in hemoglobin level was associated
with 5.6% significant productivity gains of
road workers in Kenya. Besides hemoglobin level, energy intake has an important role in
work productivity. Deficiency energy intake
leads to lack energy to work and do activities.3
Study had shown that energy deficiency
may decrease work capacity ;thus decrease work productivity.4 Workers who have normal body mass index (BMI) would have higher productivity rather than those who have underweight and overweight BMI.3,5,6 Underweight BMI indicates chronic energy
deficiency meanwhile overweight and obese
Therefore, each worker has 341 m2-1,767 m2 working area. The K3L workers work from 7 a.m. until 3 p.m. Wide working area and long working hours make K3L workers need to be healthy, so they have an optimal condition; thus leads to high productivity. An indicator of K3L workers’ productivity can be observed by their attendance record. Mean attendance of workers in a month reached 65-85%. According to the interview with chief of K3L, he stated that many workers only worked for half day.
The objective of the study was to identify the hemoglobin level, energy intake, and BMI of Kebersihan, Keindahan, Kenyamanan Lingkungan (K3L) workers in Universitas Padjadjaran, Jatinangor.
Methods
This study was carried out using descriptive method on October 2014 in Jatinangor. The population of this study was 415 of K3L workers. The criteria of study sample were K3L workers who work in Universitas Padjadjaran Jatinangor in 2014. The total number of 80 workers was chosen with cluster random method. Ten workers were chosen randomly from each eight working area.
Primary data consisted of hemoglobin level, energy intake, and anthropometry data (weight and height). Blood samples were taken for hemoglobin measurement using peripheral blood. Hemoglobin level was measured by
Hemocue®Hb 201+ then classified into world
Helath Organization (WHO) category. Energy intake measured by 24 hours dietary recall
(2x24 hours). Dietary habits were investigated to determine the adequacy of workers’ diet particularly for calories. The interviewer investigated all of food consumed by subjects in the last 24 hours for two times without consecutive manner. Data were collected in household measurements then it converted into gram unit. Then the dietary data were analyzed by using Nutrisurvey application. The energy intake data from the application were categorized into Recommended Daily Allowance (RDA) 2004.7 Meanwhile the height was measured by microtoise (accuracy 0.5 cm) and weight was measured by weight scales Camry (accuracy 0.1 kg). After that, BMI was calculated by equation weight(kg) / height2
(m2). The result would be classified into
BMI category according to Ministry of Health Republic of Indonesia 2003.
This study had been approved by Health Research Ethics Committee Faculty of Medicine Universitas Padjadjaran.
Results
Study samples were 80 workers with equal proportions between females and males, 40 (50%) workers. Study subjects were differentiated into females and males because of having differentiation in cut off hemoglobin, energy intake, and BMI categories. All of the study subjects were in productive age. Productive age ranged from 15 to 64. Most of study subjects were in age group 30-49. Mean of the age of study subjects was 37. Age factors
should be concerned because it has influence in
energy intake requirement of each individual.
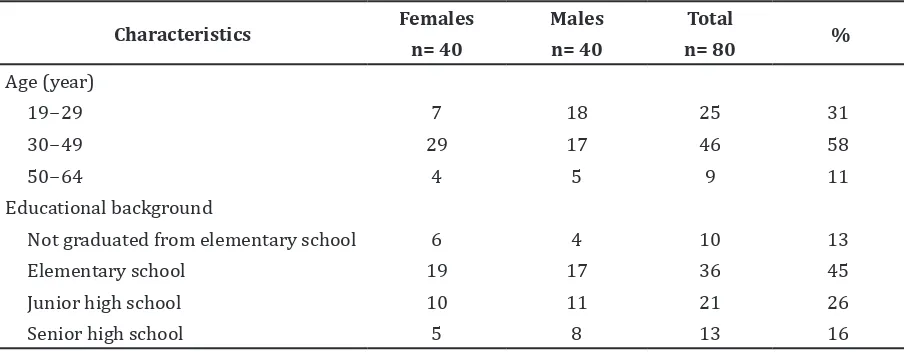
Table 1 Characteristics of Study Subjects (n=80)
Characteristics Females Males Total %
n= 40 n= 40 n= 80
Age (year)
19−29 7 18 25 31
30−49 29 17 46 58
50−64 4 5 9 11
Educational background
Not graduated from elementary school 6 4 10 13
Elementary school 19 17 36 45
Junior high school 10 11 21 26
Table 2 Frequency Distribution of Hemoglobin Level Category
Hemoglobin level category
Females Males Total
n % n % n %
Low 11 28 7 18 18 23
Normal 29 72 33 82 62 77
Total 40 100 40 100 80 100
The classification of age group was adjusted
with age category in RDA (2004). Almost half of the study subjects (45%) had the last educational background in elementary school
and even 13% had not finished elementary
school (Table 1).
Mean of hemoglobin level of females subjects was 12.76±1.35 g/dl. Instead, mean of hemoglobin level of males subjects was 14.19±1.48 g/dl.
As shown in table 2, most of the study subjects had normal hemoglobin. 23% subjects had low hemoglobin level, consist of 28% females and 18% males. Frequency of low hemoglobin or anemia was greater in females than males.
As shown in table 3, the lowest mean
energy intake was recorded in 19−29 age group females and 50−64 age group males.
In females subject, the highest mean energy
consumption level was presented in 30−49 age group females, and 19−29 age group males.
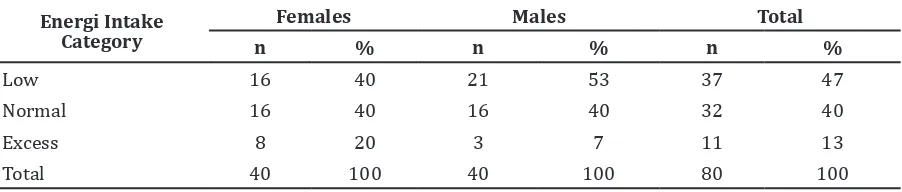
As shown in table 4, 37 (47%) study subjects had less energy intake than the recommendation. Females subjects have greater number of workers who had exceeded energy intake category than males. The frequency of study subjects that had exceeded energy intake was 13%.
Means of BMI study subjects were 24.79±4.16 in females and 20.60±4.04 in males. The highest BMI was presented by females and the lowest BMI was in males.
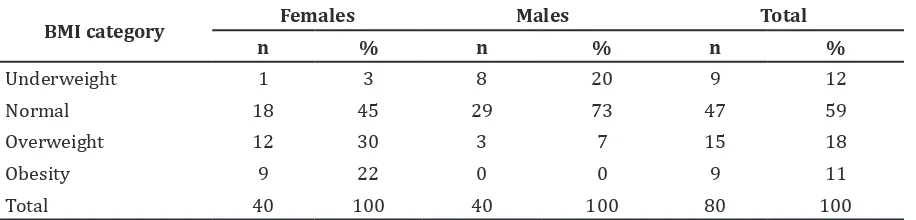
As shown in table 5, this study discovered that 59% subject had normal BMI. Besides, 12% subjects had underweight BMI consisting of 3% females ,and 20% males. Subject with BMI status obesity was 11% ,and all of them was females.
Table 3 Energy Intake of Study Subjects
Age (year)
Females Males
Mean±SD* (kcal**)
Max (kcal)
Min (kcal)
Mean consumption
level (%RDA#)
Mean±SD (kcal)
Max (kcal)
Min (kcal)
Mean consumption
level (%RDA)
19−29 1585.23±492 2485.8 111.3 83.5 2003±624 3697.8 1124.3 82
30−49 1774.10±448 2773.2 1147 93.7 1920.3±338 2576.6 1307.3 80
50−64 1659.67±438 2160.6 1214.4 91.2 1906.3±194 2174.3 1695.8 92.5
Total 1729.61±449 2773.2 1111.3 91.6 1955.8±472 3697.8 1124.3 82
Note: * Standard Deviation, ** kilocalories, # Recommended Daily Allowances
Table 4 Frequency Distribution of Energy Intake Category
Energi Intake Category
Females Males Total
n % n % n %
Low 16 40 21 53 37 47
Normal 16 40 16 40 32 40
Excess 8 20 3 7 11 13
Discussion
IThe results of this study showed that more than half of subjects had normal hemoglobin level. Approximately 23% subjects had anemia which consists of 11 females subjects, and 7 males subjects. The proportion subjects that had anemia were greater in females subjects
(61%). These findings are similar to those
of Wolgemuth et al.1, Sinclair and Hinton8, Pasricha et al.9 that prevalence of anemia was greater in females than males. Women are more susceptible to have anemia because of inadequate iron, and protein intake, inadequate absorption, or increase demand of iron as in menstrual period, pregnancy, and lactation.9
Despite most of study subjects had normal hemoglobin level category. About more than 90% subjects had marginal hemoglobin level between normal and low. It can be caused by the lack variation of food consumed by study subjects, such as lack of red meat, and vegetables consumption. This study’s result
similar to the findings in Kenyan workers.1 This study had 47% subjects who had
deficiency energy intake based on RDA 2004.
The recommendation requirement of energy
intake of females subjects whose 19−29 age
group is 1900 kcal. Females subjects whose
age group 30−49 needs 1800 kcal while subjects in age group of 50−64 needs 1750
kcal. The requirement of energy intake of
males subjects whose 19−29 age group is
2550 kcal. Males subjects whose age group
30−49 needs 2350 kcal while subjects inage group of 50−64 needs 2250 kcal.8 This study showed that subjects who had the lowest
energy intake were age group 50−64. There
is 5% reducing of energy requirements as it
increases with age in 50−64 that may have
contributed into the result of this study.7 Study
had proven that energy intake deficiency leads
to reduce energy production in body ;thus it
results in lower productivity.3 If the amount
of energy is not sufficient, our body will break
down the energy reserves.2
Deficiency energy intake in the study
subjects may have been caused by lacking knowledge of good nutrition. The highest educational level reached by this study subjects was senior high school and most of them had latest educational level in elementary school. As the increase of educational level, there is increase in health, and nutrition’s knowledge.10
Low socioeconomic level may have influenced
the ability to purchase food. Besides most of the study subjects only ate once or twice in a day with none or rare consumed snacks. This result was similar to those reported in factory’s workers in Semarang.3,4 Workers with most
deficiency energy were also found in Kenyan
workers.1
The proportion of the subjects that had exceeded energy intake was greater in females
than males. These findings are similar to those
study in Bangladesh. They stated that females workers who were better in knowledge, and understanding about relation between food, and health were able to try consuming healthy food.10 Better nourished female workers can be caused by their role in foods preparation. Since their frequent access to food during its preparation may have contributed the additional quantities of calories to their diets.1
This study showed that 12% study subjects was underweight, 59% was normal, 18% was overweight, and 11% was obesity. The BMI is determined by the equilibrium of energy intake and physical activity. Work load of K3L workers were hygiene maintenance such as street cleaning, garbage accumulation and transport, drainage cleaning; also park maintenance such as watering, cleaning, weed cutting, soil crumbling, dried leaf cutting, fertilizing, and pest controlling. Low BMI status can be caused by the imbalance between less energy intake but more energy was used in
Table 4 Frequency Distribution of BMI Category
BMI category Females Males Total
n % n % n %
Underweight 1 3 8 20 9 12
Normal 18 45 29 73 47 59
Overweight 12 30 3 7 15 18
Obesity 9 22 0 0 9 11
study subjects which had normal BMI but low energy intake may have been caused by the difference in the work load proportion of each workers. Imbalance state between work load and working hours also may have contributed to this condition. These can be explained by workers with less work load but had the same working hours made the workers to have more less productive leisure time in work . Workers who BMI status is overweight and obesity can be explained by their exceeded energy intake with less energy used in work. Low work motivation or less work load than others may have contributed to this condition .
The result of this study was contrast with Utami3 which stated that most of the factory workers had low BMI. However the pieces of study conducted by Adrianto and Ningrum11 towards Semarang factory workers and Mahardika and Roosita12 towards factory workers in West Java revealed similar results that most of their workers had normal BMI.
Thus, it can be concluded that most of K3L workers have normal hemoglobin level,
deficiency energy intake, and normal BMI.
Limitation of this study was the accuracy of 24 hours dietary recall which depends on study subjects’ memories (recall bias ) and local language problem . It may have contributed in high subjectivity in data collection. Adjusting the eating habit of subjects and more complete food model could increase the accuracy of 24 hours dietary recall results. In order to increase worker productivity, it is suggested that the workers should be educated about dietary habit, healthy food resources and nutritional balance. Universitas Padjadjaran also should give extra feeding in between working hours so the increase of energy intake could increase work productivity. Besides Universitas Padjadjaran should implement further study
about physical fitness of workers and the efficiency of work load and working hours.
They could also give the workers additional job in their leisure time so the working time
would be more efficient and may increase
workers’ income.
References
1. Wolgemuth JC, Latham MC, Hall A, Chesher
A, Crompton DW. Worker productivity and the nutritional status of Kenyan road construction laborers. Am J Clin Nutr.1982;
36(1):68−78.
2. Guyton AC, Hall JE. Textbook of medical physiology. 11 ed. USA: Saunders Co. University of Mississipi School of Medicine;
2005.p.79−80,864−75.
3. Utami SR. Status gizi, kebugaran jasmani dan produktivitas kerja pada tenaga kerja
wanita. KEMAS. 2012;8(1):74−80.
4. Hapsari OB, Kartini A. Pengaruh minuman karbohidrat elektrolit terhadap produktivitas kerja. Journal of Nutrition
College. 2013; 2(4):564−70.
5. Adi DPGS, Suwondo A, Lestyanto D. Hubungan antara iklim kerja, asupan gizi sebelum bekerja, dan beban kerja terhadap tingkat kelelahan pada pekerja shift pagi bagian packing PT. X, Kabupaten Kendal. Jurnal Kesehatan Masyarakat. 2013; 2(2):1-11
6. Adak DK, Gautam RK, Gharami AK. Assessment of nutritional status through body mass index among adult males of 7 tribal populations of Maharashtra, India.
Mal J Nutr. 2006; 12(1):23−31.
7. Hardinsyah, Riyadi H, Napitupulu V. Angka kecukupan energi, protein, lemak dan serat makanan. Prosiding Widyakarya Nasional
Pangan dan Gizi VIII. 2004:p.17−9.
8. Sinclair LM, Hinton PS. Prevalence of iron
deficiency with and without anemia in
recreationally active men and women. J
Am Diet Assoc. 2005;105(6):975−8.
9. Pasricha SR, Drakesmith H, Black J, Hipgrave
D, Biggs BA. Control of iron deficiency
anemia in low- and middle-income
countries. Blood. 2013;121(14):2607−17.
10. Alam N, Roy SK, Ahmed T, Ahmed AM. Nutritional status, dietary intake, and relevant knowledge of adolescent girls in rural Bangladesh. J Health Popul Nutr.
2010;28(1):86−94.
11. Adrianto EH, Ningrum DNA. Hubungan antara tingkat kesegaran jasmani dan status gizi dengan produktivitas kerja. KEMAS. 2010;5(2):145–50.
12. Mahardikawati VA, Roosita K. Aktivitas
fisik, asupan energi, dan status gizi wanita