TEAM-BASED LEARNING
AS AN INSTRUCTIONAL STRATEGY
A Comparative Study between Indonesian
and Australian Students
Bens Pardamean
Harjanto Prabowo
Hery Harjono Muljo
Team-Based Learning as an Instructional Strategy: a comparative study between Indonesian and Australian students
2017, Universitas Bina Nusantara
Author : Bens Pardamean
Harjanto Prabowo Hery Harjono Muljo Teddy Suparyanto
Copy Editor: Imanuel Didimus Manulang Layout & Cover: Anindito
ISBN : 978-602-99817-3-5
Universitas Bina Nusantara
Research & Technology Transfer Office Jl. Kebon Jeruk Raya No. 27
Kebon Jeruk
Jakarta Barat 11530
PREFACE
Swinburne University of Technology (SUT), Australia, has implemented the blended learning with TBL in the teaching and learning process. Recent research from the university found that the blended learning with TBL approach has a significant impact on student achievement. While
Bina Nusantara University (BINUS) is one of leading Indonesian universities which has implemented ICT (information and communication technology) in the teaching and learning process. In collaboration with SUT, BINUS University conducted a research study in 3 phases to examine the effectiveness of the blended learning using the TBL approach. The study investigated the effectiveness of blended learning and teaching approach in enhancing student learning outcomes in Indonesia and Australia. However, this book is a record of its results.
Our thanks in particular to Direktorat Riset dan Pengabdian Masyarakat, Direktorat Jenderal Penguatan Riset dan Pengembangan, Kementerian Riset, Teknologi, dan Pendidikan Tinggi, which strongly supports the research process. Thanks to Higher Education Coordinating III that was appointed by Kementerian Riset, Teknologi, dan Pendidikan Tinggi to coordinate the research administration. Thanks to Rector of Bina Nusantara University who has given full support to the researchers.
SYNOPSIS
Indonesian and Australian higher education are currently under the same pressure to demonstrate the effectiveness of their educational efforts. These two countries also face the similar issues in their teaching and learning process in order to maintain educational standards and student proficiency outcomes. Specifically, it is not enough anymore that students just pass the course. They need to have a more active role in the learning process.
On the other hand, the use of blended learning in the learning and teaching activity is one approach to remedy the situation. Blended learning is defined as the combination of face-to-face and online learning. It is expected by using creative and innovative uses of technology to improve teaching practices will enhance the benefits of the online learning delivery. As for the face-to-face teaching activity, instructional strategy such as Team-Based Learning (TBL) can provide opportunities for both developing teamwork capabilities and enhancing active learning. TBL is one of the student-centre learning approaches and is designed to provide students with both conceptual and procedural knowledge.
TABLE OF CONTENT
Preface Synopsis
Table of Content
Introduction
1.1.Recent Learning and Teaching Phenomena 1.2.Learning Issues
1.3.Rationales for Study
1.4.Purposes and Methotodologies Blended Learning and Team-Based Learning
2.1. Blended Learning 2.2. Team-Based Learning
2.3. Blended Learning with Team-Based Learning Approach Knowledge Transfer
3.1. Dissemination 3.2. Train-the-trainer 3.3. Guide Book for TBL The Implementation
4.1. Train-the-trainer workshops 4.2. Pilot Project
4.3. Paper Analysis
5.1. Data Collection and Processing
5.2. Comparative Analysis between BINUS and SUT Conclusions
INTRODUCTION
1.1. Recent Learning and Teaching Phenomena
The higher education in Indonesia and Australia are currently under pressure to demonstrate the effectiveness of their educational efforts. As higher education sector plays an important role in the well-being of society, maintenance of educational standards and student proficiency outcomes is an important issue. Specifically, it is not enough anymore
that students just pass the course. In today’s environment, the lecturers
need to pay attention on the alignment between learning and assessment
(“assessment for learning”), and that students are not passive learners but need to have a more active role in the learning process. Clasen and Bowman (1974) proposed this student-centric learning style in the past 40 years, and Ramsden (1992) argued that curriculum is defined by assessment, which shapes the student experience (Brown & Knight, 1994).
The idea of the alignment of the learning and teaching (L & T) with the assessment and the students as active learners is not new. Nevertheless, the problem is the alignment is not easily adopted and implemented. In the traditional teaching method, the students are treated
as the ‘empty vessel’ needed to be filled with the ‘wisdom’ from the
teachers. Moreover, learning experience between teachers and students is more transactional. The teachers impart their knowledge through face-to-face lecture, and students are expected to master the individual assignments which will be followed by cramming for the final exams. Basically, students study just for the tests or exams. This type of teaching and learning approach does not enhance the continuity in the knowledge acquisition for students to be life-long learners, and thus diminish the lasting effect of learning.
One approach to mitigate this situation is the use of blended learning in the learning and teaching activity. Williams (2002) defines the blended learning as the combination of face-to-face and online learning. It is expected, creative and innovative uses of technology to improve teaching practices will enhance the benefits of traditional teaching methods and online delivery. However, this definition is not enough to grasp the idea that blended learning will maximize students’ learning
outcomes as it is just to ‘attach’ the technology into traditional face -to-face teaching approach as an add-on and without redesigning the delivery
learning’ or ‘online learning’, the blended learning is not just
implemented simply by transferring of learning and teaching material online. As defined by Alebaikan and Troudi (2010), the blended learning is a significant integration of online and traditional face-to-face class activities.
Previous studies by Bates (2000) and Garrison and Anderson (2003) indicate that the application of ICT (information and communication technology) can assist the elimination of geographical and situational learning barriers, present better opportunities for students and teachers interaction, and subsequently lead to improving the quality of learning experiences. In other words, the proper application of the blended learning approach is expected to enhance the overall learning outcomes. For the face-to-face teaching activity, instructional strategy such as Team-Based Learning provides opportunities for both developing teamwork capabilities and enhancing active learning (Fink, 2004), and therefore it can be utilized. Team-Based Learning (TBL) is one of the student-centre learning approaches. TBL is designed to provide students with both conceptual and procedural knowledge (Michaelsen & Michael, 2008). This approach consists of three phases. They are Readiness Assurance Process (RAP), review of concepts, and application of concepts. This learning approach forces the student work as individual and group.
A university which has implemented the blended learning with TBL in the teaching and learning process is Swinburne University of Technology (SUT), Australia. Recent research from the university found that the blended learning with TBL approach has a significant impact on student achievement (Masli, 2012). Furthermore, Bina Nusantara University (BINUS University) is one of leading Indonesian universities which has implemented ICT in the teaching and learning process. In collaboration with SUT, BINUS University will conduct a research study in 3 phases to examine the effectiveness of the blended learning using the TBL approach.
identify factors that support and influence blended learning process within TBL approach.
1.2. Learning Issues
A. In Australian Higher Education
Currently, there are three emerging issues on Australian higher education (Biggs, 1999; Blackwell, 2011, Gibbs, 1992; Graham, 2006; Sharma & Tobias, 1990). First, diversity of learners with distinctive behaviour toward online learning. Blackwell (2011) noted that according
to recent study by Sharon Purchase et al on students’ behaviour in using university online learning forums, there are three distinct groupings: e-collaborators, reticents, and individual contemplators. The e-collaborators mostly have a significantly higher age; they are more likely to share their knowledge within online setting. On the other hand, reticents are mostly younger students and may have embraced online social networking sites. Surprisingly, the reticents spend the least amount of time engaging in online learning. And the last group, individual contemplators (about two third were Asian students in Purchase et al study) are the least likely to
participate in the online learning’s discussion board. Purchase et al
suggested that the diverse student body with distinct behavioural clusters
“gain the most from their university classes by offering them the timers (DEEWR, 2009), which was 2.4% increase over the previous year figure (in 2008, there were 332,622 part-time students). These part-time students (as well as full-time students) have part-time or full-time job. Data from ABS (2008) shows a staggering image: of the young adults aged 20 to 24 years who were in full-time education, 16.4% had part-time or full-time work; and those were in part-time education, 60.1% worked either part-time or full-time. Consequently, as more students are time poor, the student attendance at lecture is declining (Sharma, 2011).
concepts, facts and other learning contents. As lecture time is limited, the students will listen, absorb and memorize what the lecturer has said. Some activities, such as homework, review of the questions and concepts and other activities will complement the teaching activities via tutorial. The students are more or less passive participants in the learning process, except in the presentation session during the case study seminar. Like other physical sciences, business-related courses require students to master technical as well as non-technical competencies. Moreover, Tobias (1990) showed that many capable students in the introductory physical science courses are dissatisfied with the passive role that the lecture method imposes on them.
When teaching business-related courses, it is a tradition to rely on the text as a primary information source. Students are urged to read the text, but many do not do so. As a result, the lecturer spends more time in organizing and clarifying the text’s information for the students. In this approach, students are less engaged in the learning process. The learning and teaching activities as Biggs (1999) stated are more inclined to teacher-controlled category. This traditional didactic method of teaching business-related courses does not maximize the potential of students in learning and understanding the teaching materials. The focus of this type of didactic instruction is learning about concepts and ideas.
However, we are in the opinion that an effective teaching method should involve students to be active participants in the learning process. The focus of instruction here is learning how to use the concepts and ideas in meaningful ways as Gibbs (1992) has defined a deep approach to learning as “the student attempts to make sense of what is to be learned, which consists of ideas and concept [and] involves [the student in] thinking, seeking integration between components and between tasks,
and ‘playing’ with ideas”. This is not only to motivate capable students
to be higher performers, but also to bring out ‘the potential’ of the ‘not -so-capable’ students to master the basic technical as well non-technical competency in business-related courses.
B. In Indonesia
of higher educations in Indonesia have built web-based learning portals for their blended learning programs.
Unfortunately, the portals are used only as means for the distribution of lecture materials and tasks. Most students are only to download the materials before the exams. The learning process in the classroom is still being held in traditional way or teacher-centred. Students just come to class, listen to teacher presentations and do the task or discussion. This method of learning process cannot maximize the outcome of blended learning.
1.3. Rationales for Study
Indonesian and Australian higher education face the similar trends in teaching and learning process. The trends are the diversity of learners with distinctive behaviours toward online learning, most students have part- or full-time job, and need to engage students in learning process. Majority of students are not able to be active learners. Moreover, Indonesian student has low-level of reading interest. These challenges should be resolved in a timely approach in order to increase the quality of education.
Therefore, an innovative learning and teaching approach is needed to address the learning issues that have been identified as above. As technology has a substantial impact on the ways students collaborate with their classmates and teachers and transforms the learning and teaching activities of the traditional face-to-face teaching approach, a blended learning approach will be appropriate. According to Graham (2006), a blended learning is a combination of online and face-to-face teaching. To be more specific, as Alebaikan and Troudi (2010), it is ‘a significant integration of online and traditional face-to-face class
activities’.
1.4. Purposes and Methotologies
The study was based on the research showing that the blended learning approach presents an effective platform for employing different pedagogical strategies and has the potential to maximise the advantages of both face-to-face and online learning (Wu, Tennyson & Hsia, 2010). A mix of different pedagogies and teaching strategies has been regarded as good practice for many years. Lectures are no longer the standard, and teaching involves more classroom interaction, case studies, student group work and presentation, simulations and other types of learning activities (Williams, 2002).
A study conducted by Boyle et al (2003) in the United Kingdom confirms that blended learning can improve learning outcomes. Also in the United Kingdom, a review of its literature and practice commissioned by the Higher Education Academy concluded that overall students are very positive about blended learning (Sharpe et al., 2006). In addition,
students’ interaction and overall satisfaction have been shown to improve
through blended learning (DeLacey & Leonard, 2002). Thus, the aim of this study is to investigate whether the blended learning and teaching
approach can enhance students’ overall learning outcomes in a final university courses in Indonesia and Australia.
It is therefore, this study consisted of three phases in three years. Those phases were transfer knowledge, implementation, and analysis. The first year of study was to transfer Team-Based Learning (TBL) method from Swinburne University of Technology (SUT) to Bina Nusantara University (BINUS University). BINUS University learned and adapted the teaching and learning process that has been used by SUT. During the first part of this phase, train the trainers took place. After six months, BINUS started to train the lecturers and develop a course in one semester using TBL approach for a pilot project. The training covered how to prepare the materials and tasks for e-learning content, and how to run a TBL in face-to-face lectures. The output of the first phase was a tutorial and guide book, and recommendations for blended learning with TBL method toward the implementation phase.
students at the SUT’s Faculty of Business and Enterprise, Hawthorn
campus. At BINUS University, we investigated several courses in ICT, accounting, and management subjects for undergraduate students. The blended-learning approach was employed in these courses, which were the integration of the online and face-to-face learning and teaching activities.
Additionally, students worked collaboratively online in managing forum discussion. The face-to-face learning and teaching activities occurred during 2-hour tutorial. During the semester, all students were required to take RAP (Readiness Assurance Process) tests. Before students came to the tutorial for RAP tests, they had to prepare themselves, either read the textbooks or PowerPoint slides. The RAP test was to make sure students understand the concept of the learning materials. Initially, students took the tests individually, and then as a group of 4 or 5 students, they worked on same questions to find the correct solutions. The tests were multiple choices. After the RAP tests, the students worked to analyse the mini cases, and presented their findings to their classmates. Other face-to-face activities include presentation of major case studies and news brief. All these activities are assessed. At SUT, we have implemented the blended learning method since last year. Based on preliminary data, the results were encouraging. We should have sufficient data to compare the results between Indonesia and Australia.
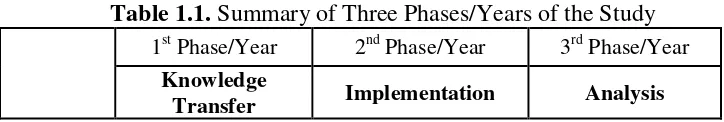
The third year was the comparative study between Indonesian and Australian students to find out factors that support and influence blended learning process within TBL approach. Data were analyzed after one year of data collecting. In this phase, the study conducted a comparative analysis between Indonesian and Australian students. A manuscript has been drafted and will be submitted to an international journal for publication. Table 1.1 summarizes the three phases/years of the study along with its respected outputs and indicators.
Table 1.1. Summary of Three Phases/Years of the Study
1st Phase/Year 2nd Phase/Year 3rd Phase/Year
Knowledge
BLENDED LEARNING
AND TEAM-BASED LEARNING
2.1. Blended Learning
Williams (2002) defines the blended learning as the combination of face-to-face and online learning. It is expected by using creative and innovative uses of technology to improve teaching practices will enhance the benefits of traditional teaching methods and online delivery. However, this definition is not enough to capture the idea that blended
learning will maximize students’ learning outcomes as it is just to ‘attach’
the technology into traditional face-to-face teaching approach as an add on and without redesign of delivery and pedagogy (Bleed, 2001; Vaughan, 2007).
As opposed to ‘distance learning’ or ‘online learning’, the blended
learning is not just implemented simply by transferring of learning and teaching material online, but as defined by Alebaikan and Troudi (2010),
the blended learning is ‘a significant integration of online and traditional face-to-face class activities’. Previous studies (Bates, 2000; Garrison & Anderson, 2003) indicate that the application of ICT (information and communication technology) can assist eliminate geographical and situational learning barriers, present better opportunities for students and teachers interaction and subsequently lead to improving the quality of learning experiences. In order words, the proper application of the blended learning approach is expected to enhance the overall learning outcomes.
2.2. Team-Based Learning
Team-Based Learning (TBL) is one of the teaching and learning approaches which involves students’ participation. The knowledge is not directly transferred from teacher to students. This teaching and learning approach consists of activities that make the students build their own knowledge individually and group. Michaelsen and Sweet (2008) concluded that TBL possibly relies on small group interaction more heavily than any other commonly used instructional strategy in postsecondary education.
used for group work. Third, courses taught with TBL typically involved multiple group assignments that are designed to improve learning and promote the development of self-managed.
TBL shifts teachers or lecturers’ role in teaching and learning process. It shifts the teachers’ role from dispensing information to
designing and managing the overall instructional process. On the other hand, the students’ role is shifted from being passive recipients of information to one of accepting responsibility for the initial exposure to the course content. So, the students would be prepared for the in-class teamwork. This approach consists of three stages: readiness assurance, review of concepts and application of concepts.
2.2.1. TBL Process
The implementation of TBL consists of three main parts. They are preparation, practice and assessment (Fink, 2002). In TBL, students work individually or in groups. Students are grouped in 5-7 individuals for each group. Figure 2.1 describes the process of implementation of the TBL.
1) Preparation
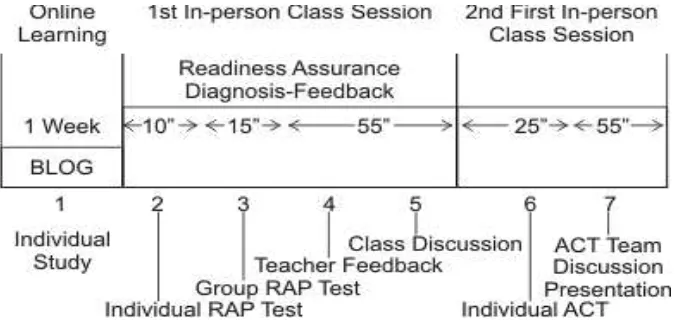
Preparation process consists of two main stages. These stages are preparation before the class and in-class preparation. Preparation before the class as the first stage is known as Reading (Fink, 2002; Michaelsen & Sweet, 2008). Nowadays, the rapid development of ICT has influenced the styles and types of learning material distribution. While the last stage, in-class preparation is also called Readiness Assurance Rrocess (RAP) (Fink, 2002; Michaelsen & Sweet, 2008).
a) Reading
In this stage, students usually do it by themselves. Prior the class, students have to learn the material distributed previously by the lecturers. Reading does not merely mean read a textbook. Instead, it is rather be an independent learning process. ICT potentially increases lecturers’ creativity to distribute learing materials. These materials are not only limited to text materials, but could also be website link suggestions, learning videos or even animations. The utilization of some new technologies is expected
to gain students’ attention and make them easy to learn.
enough to support learning process. It is important for lecturers to check the validity of the materials contents. TBL stages modification with the benefits of ICT can be seen in Figure 2.2.
b) Readiness Assurance Process (RAP)
In-class learning processes usually begin with a process of Readiness Readiness Assurance Process (RAP). RAP consists of 4 phases (Fink, 2002):
(1) Individual Test
RAP is an assessment process to measure students’
understanding towards materials learned in the Reading stage. The type of this assessment is multiple choices tests with 4 or 5 possible answers. The number of possible answers is based on the IF-AT worksheet model. It will be elaborated in section 2.2.3.
The way of doing the RAP assessment is different from
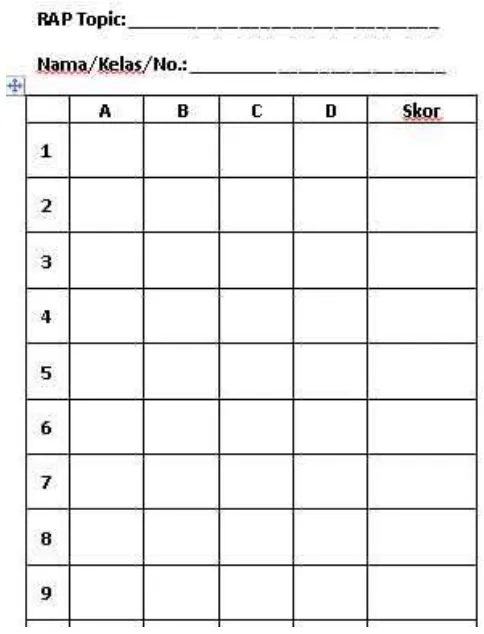
general multimple choices tests. RAP’s worksheet is a table as
we can see in Figure 2.3. This worksheet consists of columns indicating the answers and rows indicating the question’s number. Students can fill the answers on the appropriate column and row. The maximum score for each question is based on the number of possible answers. For instance, a question that has 4 possible answers, then the maximum score is 4. If a student is quite sure that the answer is A, she/he can fill the number of 4 in A column. Then, if the answer is correct, she/he will get the score 4. On the contrary, if the answer is incorrect, she/he will get the score 0.
In another case, a sudent can distribute the score into several answers if she/he is not quite sure with the answer, as long as the total score is 4. The combination score could be 3-1, 2-2 or 2-1-1. If she/he has no clue about the answers, she/he can equally distribute the score for each answer. So the combination could be 1-1-1-1. However, the last strategy is not recommended. The final score obtained by a student for a particular question is determined by the score she/he filled on
the final test score is calculated by dividing a student’s total
score with the maximum of total score.
The steps of constructing RAP assessment will be exlained on section 2.2.2. The detail jobs for student and lecturer in this stage are:
- Student : do the assessment.
- Lecturer : monitoring the assessment process. A lecturer has to make sure that no one is cheating in this assessment. It is important to know the competency level of each student objectively.
The length of this assessment is from 10 to 20 minutes. The assessment is not expected to spend more than 40% of time for each meeting.
(2) Team Test
After the individual test is completed, students are asked to do the RAP assessment in group that already predefined before. The expected outcome is a discussion and debate to choose the correct answers. At this stage, students work on the IF-AT worksheet. Students can answer on the IF-AT worksheet by scratch it with a coin on the considered column. The correct answer is marked with a "*". If the group does not find the "*" in the column selected first, the group can return again to the discussion to determine another possible correct answer. This process will be repeated until the group can find the correct answer.
Score for each question is determined based on the number of columns scratched. For example, the IF-AT worksheet with 4 possible answers: if a group scratch just one time to get the correct answer, the score for that question is 4 and if they scratch 2 times, the score is 2. However, if the group scratch three times to find the "*", they get score 1 and they will get score 0 if they scratch for 4 times. The final score of each group is the percentage of the total score of all questions divided by the maximum score.
Job details of lecturers and students at this stage are as follows.
- Lecturer : check students’ answers for the individual test, then a lecturer has to make an analysis of the most incorrectly answered question.
The time length of this test ranged from 20 to 30 minutes. This test should be slightly longer than the individual tests. So that students have a little extra time to discuss the answer for each question.
(3) Appeals
The next stage is the Appeals. This stage allows students to criticize some answers that they think are wrong. The critique must be accompanied by reasons and literature sources if possible. This criticism usually appears because either there are misconceptions from students or there are faults from lecturers when making the question. Criticism caused by lecturers’ mistakes will never be expected to be found in TBL process.
Job details of lecturers and students at this stage are as follows.
- Student : make written critiques.
- Lecturer : check and confirm the student’s critiques.
(4) Corrective Instruction
The final step in the RAP is Corrective Instruction. This stage is a brief and specific explanation to clarify
misconceptions found in the individual test as well as students’
critiques at the appeals stage.
2) Training
a) Task Explanation
The important thing at this stage is to arrange students to do the job correctly by reminding them about the concepts used, giving an overview of the problem, working time length, and making a report of the workmanship.
b) Group Discussion
After the explanation of the tasks, students will be given time to discuss the questions and choose the answers in a group. During the discussion, lecturers need to get around listening to the conversation in the discussion. Two important things to be gained from listening to the discussion are as follows.
(a) Obtaining assurance through the control process that each group and its member are actively involved in the discussion process.
(b) Lecturer can immediately give feedback and guide a group if there is a misconception in the discussion process.
c) Reporting
When the discussion process is almost complete, lecturer is expected to examine the work of each group and reminds them to allocate the group’s time to prepare the reports. Once the group is ready, the group is asked to present the answers to the class. The interesting thing about this process is when there is a different answer or work step either from lecturer or other groups. These differences will enrich the classroom discussions.
d) Discussion between Groups
e) Closing
Lecturer closes the discussion with a reminder of the key points, the general rule that may arise and the viewing angle that can strengthen what they have learned. When the discussion is not closed properly, some important things may get lost or forgotten by students.
3) Appraisal
This stage is the last stage of the whole process of TBL. At this stage, students are tested either individually or in groups. Individual test can be a written test, while the group assessment can be projects done in a several days.
Figure 2.2. TBL Modification Utilizing ICT
(Pardamean, Suparyanto, Suyanta, Eryadi & Donovan, 2014)
Figure 2.3. Individual Test Answer Sheet
2.2.2. TBL’s Tests
Overall TBL process involves four kinds of tests: the individual test, application test, final test and project. Weight score for each test and the calculation of the final score shall be determined by the lecturer before the lecture begins. Things that must be considered in judging the weight of the preparation described in section 2.2.5. This subchapter will discuss two types of tests specifically, which are the individual test and application test.
Individual test is a test that is done in the RAP process. This test is a multiple-choice test that aims to identify the ability and understanding level of students about the concepts they learn independently. Number of questions in these tests ranged from 10 to 50 items. Number of questions depends on the type of IF-AT answer sheet and the concepts involved in the learning material that has been given to the students. Number of possible answer on each question is determined by the type of IF-AT answer sheets which will be used in the group test stage of RAP. The following steps can be taken in the constructing the individual test questions.
1) Preparation
This stage consists of 2 parts:
(a) Determine the type of IF-AT answer sheets that will be used. The type and serial number of IF-AT answer sheets will determine the number of possible answers as well as answer keys that will be used in every question. The serial number of IF-AT answer sheet is located at the bottom left of the answer sheet. This number will determine which answer key to be prepared.
(b) Determine the concepts involved.
At this preparation stage of constructing assessment questions, lecturer will search and define the concepts in the learning materials given to the students. All of these concepts need to be recorded. Lecturers should also verify whether these concepts are correct.
2) Questions Constructions
This stage is divided into 3 parts: (a) Determine Number of Questions
The number of questions is based on how many concepts are included and have been recorded.
(b) Make the Questions
Answer key should be match the serial number IF-AT answer sheet used.
Do not contain questions with answer choices of "all answers are correct" or "just A and B are correct". It will lead to debate, especially for students who choose the correct answer, but mistakenly scored because the incompleteness of their answers.
Using sequential question numbers from 1 to 50 which is sufficient to use 1 IF-AT answer sheets rather than repeating the numbers for the same material. This is to avoid cheating because students have memorized the serial number of IF-AT answer sheets.
The question does not contain a negative sentence, such as "no" or "except". It would complicate and confuse students.
Do not make the matchmaking questions. (c) Define the Correct Answer and the Wrong Ones
The total number of wrong answers is the number of possible answers minus 1. Here is the guidance in determining the answer must be similar with the correct answer.
The answer must not contain "not one of the options above" or "all of the above".
Possible answers must be arranged in a logical order (eg order numbers or timeline).
Possible answers must not overlap each other. (d) Arrange the Questions
The last step in this stage is to arrange questions. In every question item, the correct answer is placed accoding to the IF-AT answer key that has been chosen.
3) Verification
4) Correction
This correction is based on the verification result to assure all questions as well as the answers are totally correct.
b) Application Test
This is an essay test that should be done in groups. This test includes the application of the concepts learned in the RAP process. The level of difficulty in this test is progressive. The questions in this test can be a small study case that needs to be solved by the students based on the concepts they have learned. In the process, students are required to provide a written explanation to the answers they choose to solve the case. For more complex question, students may be asked to make a prediction to particular problems.
2.2.3. IF-AT Worksheet
IF-AT answer sheet (Immediate Feedback - Assessment Technique) is a multiple-choice answer sheet that can immediately provide feedback to students (Epstein Education Enterprises, 2014). In the process of TBL, the answer sheets are used in the process of group work (team test) under RAP. In groups, students can immediately get feedback whether the answers they set is correct.
Students can scratch the IF-AT answer sheet with a coin to answer the questions in the test. The feedback provided by the IF-AT answer sheets is true or false statement of the answers determined by the group. The correct answer is marked with a "*". If students do not find the "*" then the answer is wrong. The groups must immediately discuss to re-determine other possible answers, if they do not find the "*" on the options they choose. This procedure is repeated until the group found the sign "*" on each question.
The answer key of IF-AT answer sheet will be included based on the serial number of the answer sheet purchased. The serial number is printed on the bottom left of the IF-AT answer sheets. The serial number consists of a four digit combination of one letter and three numbers, eg "A010". The answer sheets and the serial number can be separated by tearing the page. It is advisable to tear the serial number first before giving to students. It can prevent students to memorize the answers based on the serial number of IF-AT answer sheets. This confidentiality is important, so that the serial number ss well as the answer key should not to be distributed to students.
2.2.4. Technique of Grouping in TBL
In TBL, the formation of the group is an important part to be considered. There are three principles that can be used as a reference in the formation of groups, namely (Michaelsen, Parmelee, McMahon, & Levine, 2007):
a) Group member are not chosen by students.
b) Each group must consist of students with diverse capabilities (heterogenous).
c) Group formation has to be transparant.
Once group are formed, each member within a group will know each other, both the name and the ability of other group members. When
students learn that their role is determined by the principle of ‘resource
capabilities distribution’, they would rate their group members from two
perspectives: "we are all pretty much the same" or "each of us may have some particular ability to solve problems in the discussion."
The group formation can sometimes be a contentious issue for students and lecturers. Students are usually recommended forming a group whose members are determined by the students themselves. The formation of such groups is often simply based on students' social relationships and not on the ability of students. Groups like this will not help in group discussions and in completing a given task.
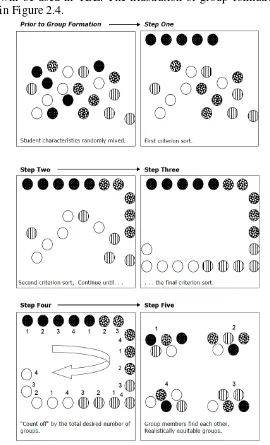
Sweet (2003) provides simple but effective steps to form a heterogeneous group. The steps are as follows.
1) Defining grouping criteria
characteristics determined by the experience, expertise and thinking ability of students in previous lectures will certainly make it easier for students. Nevertheless, students who come from different cultures and countries will certainly be more difficult.
2) Make a priority list of grouping criteria
List of characteristics is arranged based on the importance level. Both useful and harmful characteristics are compiled into one list, with the most important characteristics at the top. In grouping process, priority setting is very important because many students have more than one characteristic. For example, a student who has the ability in certain areas actually has the ability to speak less.
3) Prepare the students
Explain to students that they will be grouped and the lecture can be slightly noisy, yet fun. Explain to them that the participation of students in the lecture is indispensable, both in group discussions and self task.
4) Group students based on the first characteristic
For the first group, lecturers can ask their students to form a group based on the same characteristics. A group of students that have the first characteristics is called group 1.
5) Group students based on the next characteristics
Then, students that have second characteristics will be grouped into the group 2. Lecturer can make the lists for all remaining criteria.
6) Count the number of students
Once all students are in the characteristic group, then lecturer can count the number of members in each of these groups. After that, the total number of students in all groups can be cross checked with the total number of students in the class.
7) Decide the number of groups to be formed
lecturer wants to make 4 groups then each student needs to count from 1 to 4.
8) Form the groups
Once all students have their own numbers based on previous step, they will be asked to make groups with the same number. These groups then will be used in TBL. The illustration of group formation can be seen in Figure 2.4.
2.2.5. Scoring Technique
The representatif of each group was asked to propose a percentage of the value of the course to be determined by the score in every key performance area (Individual performance, Group performance and Participation within the group). The representatif of each group will also decide the weight of RAP and the final examination in the area of Individual Performance. Class grading weight can be set by the following procedure (Team Based Learning, 2013):
a) Each group will set the initial weight and elect the group represintatif to meet with other groups’ representatives.
b) Representatives of the group will meet in the middle of the room and do consensus (ie, every member must agree on a class grading weight for the class as a whole).
c) Lecturers can determine the boundaries of class grading, for example:
at least 10% of the total value for each key performance area. in the area of individual performance, at least 50% of the class
grading weight should be based on the final exam.
Participation within the Group
Each individual will assess the participation of all other members of their group until the lecture ends. Scores of participation in a group for each individual are the average points they received from members of their group. With the example of vote assumption: (1) the value of participation in the group was 10 points and (2) there are six members in the group. Then the illustration of procedures that can be done is as follows.
group cannot help everyone in their group to get an A by giving high scores to their colleagues. The only way to get everyone in the group got an A is to work hard on the individual test, exam or project group.
2.2.6. Benefit of TBL
Michaelsen and Sweet (2008) classified the benefits of TBL into three categories.
a) Benefits for students:
Students can master the basic course contents.
Students can progress considerably beyond simply acquiring factual knowledge and achieve a depth of understanding that can come only through solving a series of problems that are too complex for even the best students to complete through their individual effort.
b) Benefits from an administrative perspective, when TBL is well implemented:
Faculty and other professional staff time used for training facilitators and involved in team facilitation are minimal. TBL is cost-effective since it can be successfully
employed in large classes and across academic programs. The kinds of assignments characteristic of TBL reduced
the potential for interpersonal hostilities within teams to develop to a point where administrators must deal with the personal, political, and possibly even legal aftermath. c) Benefits for faculty
2.3. Blended Learning with Team-Based Learning Approach
Blended learning consisted of two types of activity. There are online activity and face activity. Before conducting the face-to-face class, students must learn or read materials. These materials should be prepared by the teacher and posted it on e-learning portal. E-learning is the learning process which utilizes the Internet or intranet (The Herridge Group, 2003) and Learning Management System (LMS) is needed to establish an e-learning system.
Thus, LMS is an information system that administers instructor and e-learning courses (Brown & Johnson, 2003). LMS also keeps track of student progress. With the LMS, the distributions of learning materials are quite easy. On other hand, in the face-to-face class, teacher can conduct TBL activity. E-learning can guarantee the teaching material distribution and TBL can guarantee the learning process. This
KNOWLEDGE TRANSFER
The first year of study was to transfer Team-Based Learning (TBL) method from Swinburne University of Technology (SUT) to Bina Nusantara University (BINUS). BINUS learned and adapted the teaching and learning process that has been used by SUT. During the first part of this phase, train the trainers took place. After six months, BINUS started to train the lecturers and developed a course in one semester using TBL approach for a pilot project. The training would cover how to prepare the materials and tasks for e-learning content, and how to run a TBL in face-to-face lectures.
The result of the research within the first year was dissemination and train-the-trainer. We also developed Guide Book for implementing TBL. The dissemination was done by presenting a paper at the international conference. This international conference was held on 14th
– 17th April 2014 in Bali. Meanwhile, Train-the-Trainer was conducted in Swinburne University of Technology, Hawthorn, Melbourne, Australia on 23th–25th September 2014. Based on the experience and knowledge gained from the Train-the-Trainer process, Guide Book was developed for the implementation of TBL in Bina Nusantara University.
3.1. Dissemination
Dissemination process was done by creating a paper for international conference. This paper is entitled “Enhancing the Use of Digital Model with Team-Based Learning Approach in Science
Teaching”. Five researchers were involved in the writing of this paper. They are Bens Pardamean and Teddy Suparyanto (from Graduate Program of Information Technology, Bina Nusantara University, Jakarta, Indonesia), Suyanta (from SMP Negeri 142, Jakarta, Indonesia), and Eryadi Masli and Jerome Donovan (from Faculty of Business and Enterprise, Swinburne University of Technology, Hawthorn, Australia).
teacher's audio explanation. The TBL approach was implemented as the instructional strategy during in-class sessions. A portion of the classroom time was spent ensuring students master the class material. A vast majority of class time was used for team assignments focusing on problem-based learning and simulating complex questions that the student would face as the course developed. The utilization of digital models and TBL improved the students' ability to learn independently and to present their ideas coherently, transforming them into more engaged, independent learners, not just in science learning but also in their overall academic experience.
The paper was presented in Information & Communication Technology-EurAsia Conference on 14th–17th April 2014 in Bali. The ICT-EurAsia 2014 was held with the support of The International Federation for Information Processing (IFIP) which is the leading multinational umbrella organization in Information and Communications Technologies. The proceeding of ICT-EurAsia 2014 was published in the Lecture Notes in Computer Science of Springer.
3.2. Train-the-Trainer
Train-the-Trainer was held in Swinburne University of Technology, Hawthorn, Melbourne, Australia. This training was held on 23th–25th September 2014. Two lecturers from Bina Nusantara University came to Swinburne University of Technology to learn about Team Based Learning process. The two lecturers are Bens Pardamean and Teddy Suparyanto. They would be responsible as trainers for Bina Nusantara University.
3.3. Guide Book for TBL
THE IMPLEMENTATION
The second year was the implementation phase of blended learning with the TBL in BINUS teaching and learning process. A pilot project and data collection started during this phase. Data were collected
from student’s grade for each assessment. The course unit investigated is
HBI345n International Business Strategy, which is the third-year subject
for undergraduate students at the SUT’s Faculty of Business and
Enterprise, Hawthorn campus. At BINUS, we investigated course unit International Human Resource Management (IHRM), which is a subject for undergraduate students at the School of Business Management.
During the pilot project, the SUT’s lecturers visited BINUS to observe
and advise the course which was conducted with TBL teaching method. At the end of the pilot project, researchers from BINUS University international journal with Scopus indexed. Train-the-trainer workshops were conducted for School of Business Management and School of Hotel Management, BINUS University. The lecturers were trained to prepare their courses with TBL approach. After the workshop, the lecturers conducted their courses with the TBL approach and collected all of the data. Meanwhile, the paper was written based on the knowledge in preparing the TBL approach in IHRM course. This paper was submitted to UNESCO Prospects Journal, a Q2 Scopus indexed paper. It is ranked a B by Australia's ERA 2010.
4.1. Train-the-trainer workshops
Train-the-trainer workshops were conducted in two sessions. These workshops were conducted to prepare the lecturers to run TBL class. The topics for these workshops were:
Schedule of train-the-lecturer workshops are displayed in Table 4.1 and Table 4.2. Figure 4.1 shows an activity during train-the-lecturer workshop.
Table 4.1. Schedule of Train-the-trainers Workshop – Session 1
February 3, 2015 Training-the-lecturers Phase 1: Introduction of TBL
February 10, 2015
Training-the-lecturers Phase 2: TBL Teaching preparation - Part 1
February 17, 2015
Training-the-lecturers Phase 3: TBL Teaching preparation - Part 2
February 26,
2015 Training-the-lecturers Phase 4: Creating RAT
Table 4.2. Schedule of Train-the Lecturers Workshop – Session 2 September 3,
2015 Training-the-Lecturer Phase 1: Introduction of TBL
September 11, 2015
Training-the-Lecturer Phase 2: TBL Teaching preparation & RAT
4.2. Pilot Project
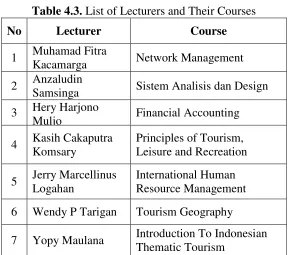
The activity after train-the-trainers workshop was conducting a pilot project. In this activity, seven lecturers were chosen to run their courses with TBL approach. The list of these lecturers and their courses is displayed in Table 4.3. Figure 4.2 shows the students’ activity during a TBL class.
Table 4.3. List of Lecturers and Their Courses
No Lecturer Course
1 Muhamad Fitra
Kacamarga Network Management
2 Anzaludin Samsinga Perbangsa
Sistem Analisis dan Design
3 Hery Harjono
Muljo Financial Accounting
4 Kasih Cakaputra Komsary
Principles of Tourism, Leisure and Recreation
5 Jerry Marcellinus Logahan
International Human Resource Management
6 Wendy P Tarigan Tourism Geography
Figure 4.2.Students’ Activity during a TBL Class
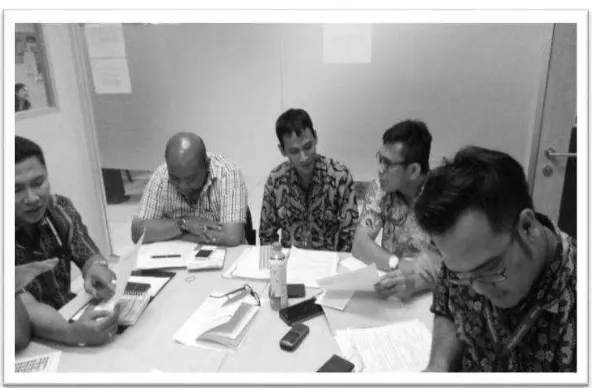
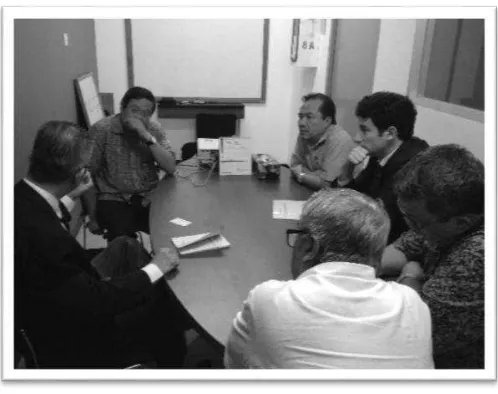
During the pilot project, two researchers/collaborators from SUT, Australia visited the pilot project classes. They came to BINUS University campus on September 4th, 2015. The researchers observed the courses which were conducted using TBL method. Figure 4.3 shows the discussion took place after class observation.
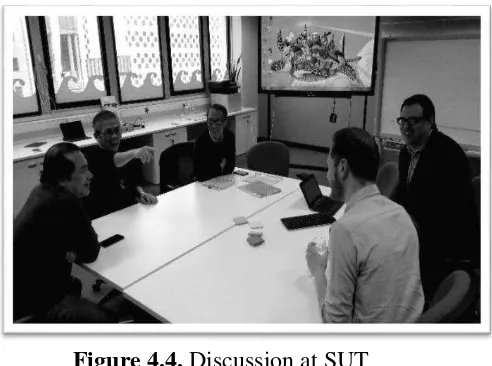
Visiting the SUT campus occurred on September 7 to 9, 2015. Researchers/collaborators from BINUS University met with their counterparts from SUT, Australia to evaluate the pilot project results. Figure 4.4 shows a discussion meeting in SUT, Australia. The result of this discussion was a spreadsheet template for data recording during TBL implementation.
Figure 4.4. Discussion at SUT
Moreover, data from the pilot project courses were collected. These data then would be analyzed as part of year three research activities with SUT. The collected data consist of RAT scores, midterm
test scores, final test scores and students’ survey
4.3. Paper
A paper submitted to an international journal was writen based on the experience in preparing the TBL approach in IHRM course. This paper entitled “The Development of a Blended-Learning Teaching Portfolio for Management Courses Using Team-Based Learning
Masli and Jerome Donovan (from Faculty of Business and Enterprise, Swinburne University of Technology, Hawthorn, Australia).
This paper was writen based on the experience in preparing TBL teaching method which was implemented in an International Human Resource Management class taught by Jerry M. Logahan. The paper describes a teaching porfolio that helps lecturers maximize the benefits of blended learning, a combination of in-person and online learning, through the use of Team-Based Learning (TBL) teaching and learning approach. It shows that TBL can provide opportunities in developing teamwork capabilities and enhancing active learning, which could remedy the weaknesses of implementing blended learning. The teaching portfolio consisted of: course overview, graduate competency, syllabus, course materials resource, teaching scenario, reading assurance test, midterm/final exams, student assignments, assessment of learning outcomes, and course quality improvement sheet. Each item was developed based on the characteristics of the course. The teaching portfolio was considered a valuable tool for lecturers to manage a blended-learning course that can help students in achieving higher scores and motivating them to read course materials prior to class sessions. In its actual implementation, it also helped increase students understanding of the subject matter and encouraged students to become more active in group discussions. Moreover, this approach led to class attendance in a timely manner, reducing tardiness.
ANALYSIS
The study started with the process of technology transfer of Team-Based Learning (TBL) method from Swinburne University of Technology (SUT) to Bina Nusantara University (BINUS University) in the first year. The study was continued with implementation process of TBL in BINUS and data collection in the second year. The third year was the comparative study between Indonesian and Australian students to identify factors that support and influence blended learning process within TBL approach. Data were collected from courses conducted at Bina Nusantara University, Indonesia and Swinburne University of Technology, Australia. Data collected from both sites for one year were analyzed.
5.1. Data Collection and Data Processing
A. At Bina Nusantara University
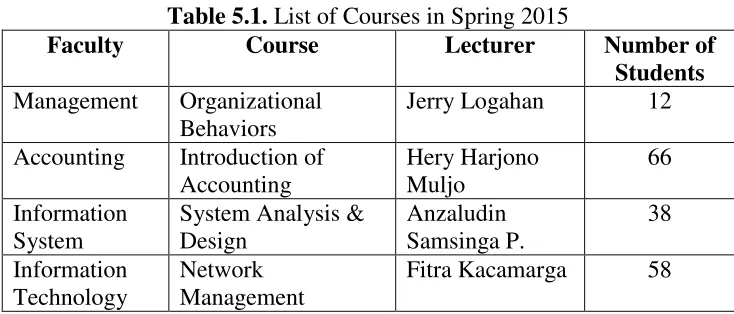
Bina Nusantara University collected data from classes that implemented TBL method in Spring 2015 and Fall 2015 semesters. Data were collected from 4 courses in Spring 2015 semester and 3 courses in Fall 2015 semester. Table 5.1 and Table 5.2 show the list of courses in Spring 2015 and Fall 2015. The collected data are TBL process record, Readiness Assurance Test (RAT) result, midterm test result, final test result, and course questionnaire. Appendix 1 shows the raw data collected from the classes.
Table 5.1. List of Courses in Spring 2015
Faculty Course Lecturer Number of
Table 5.2. List of Courses in Fall 2015
Faculty Course Lecturer Number of
Students
Accounting Basic Accounting Hery Harjono Muljo
140
Hotel
Management
Tourism Geography Wendy P Tarigan
11
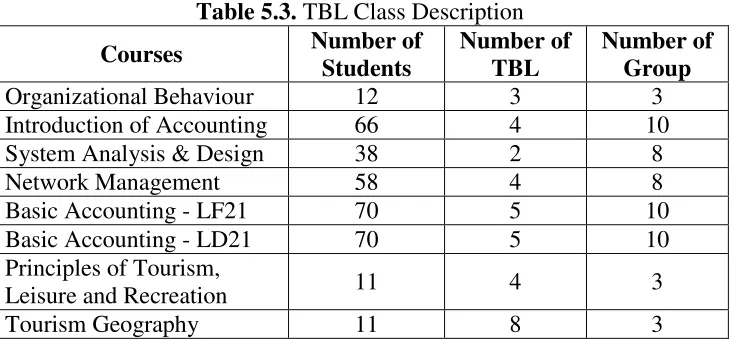
Data collected from the 7 courses consisted of 8 classes. Basic accounting course consisted of two classes with 70 students for each class. The description of classes that implement TBL is shown in Table 5.3. The table also lists the number of groups in TBL. Each group consists of 3 to 4 students. The Tourism Geography course conducted TBL method for eight times.
Table 5.3. TBL Class Description
Courses Number of
Organizational Behaviour 12 3 3
Accounting course. Table 5.4 shows the mean and SD score of Individual Readiness Test (IRAT) and final.
Table 5.4. Mean and SD of IRAT’s and Final Score
B. At Swinburne University of Technology
The result was based on the analysis of RAT (Readiness Assurance Test) data, which were part of TBL process and final exam. It took 52 students during Semester 2 Year 2013 and 44 students in Semester 1 Year 2014 for the International Business Strategy (INB30020) course unit at Swinburne University Faculty of Business and Enterprise at Hawthorn Campus, Melbourne. This course unit is one of the core course units for undergraduate students majoring in International Business. Students have to complete 200 credit points including Global Business Cultures, Global Logistics and Supply Chain Management, and Managing the Global Marketplace, prior to enrol into this class.
During the semester, all students were required to take RAT (Readiness Assurance Test). Before students came to the tutorial for RAT, they had to prepare themselves, either to read the textbooks or to listen to lectures via Camptasia. The RAT is to make sure students understand the concept of the learning materials. Initially, students took the tests individually, and then as a group of 4 or 5 students they worked
on same questions to find the correct solutions. The tests were multiple choices.
The collected data at SUT are listed in Table 5.5 and 5.6. Table 5.5 shows mean and SD of IRAT and GRAT for INB300200 in 2nd semester of 2013. Table 5.6 shows mean and SD of IRAT and GRAT for INB300200 in 1st semester of 2014. Appendix 2 shows the complete descriptive data collected from the classes.
Final Exam 65.06 13.44 AVERAGE RAP
Ind. 60.65
5.2. Comparative Analysis between BINUS and SUT
The comparison considered only two variables to measure learning effects: Individual Reading Assurance Test (IRAT) and EXAM, final exam performance (Figure 5.1). This comparative analysis used data from International Business Strategy (INB30020) unit at Swinburne University of Technology (SUT) Faculty of Business and Enterprise at Hawthorn campus, Australia; and Basic Accounting (ACCT6087) at Bina Nusantara University (BINUS), Indonesia.
Basic Accounting (ACCT6087) class at BINUS provides knowledge for students to understand the concepts and principles of accounting, and how to use financial statement information as a basis for decision making. The course includes basic accounting concepts and principles, until the financial statement analysis. This course is held in the first semester using the International Financial Reporting Standards (IFRS) conceptual framework and Team Based Learning (TBL) as learning method. TBL method requires the student to prepare before the lecture starts. TBL always starts with the test corresponding chapter to be discussed, and it is a highly significant difference compared to traditional methods. TBL method also resulted in the formation of the mindset of the students more active in learning.
International Business Strategy (INB30020) at SUT is one of the core units for undergraduate students majoring in International Business. Students have to complete 200 credit points including Global Business Cultures, Global Logistics and Supply Chain Management, and Managing the Global Marketplace, prior to enrol into this class. During the semester, all students were required to take Readiness Assurance Process (RAP). Before students came to the class for RAP, they had to prepare themselves, either read the textbooks or listened to lectures via Camptasia. The RAP test is to make sure students understand the concept of the learning materials. Initially, students took the tests individually, and then as a group of 4 or 5 students, they worked on same questions to find the correct solutions. The tests were multiple choices.
Figure 5.1. Research Model and Operationalization
Mean of Individual Reading Assurance Test (IRAT) for INB30020
In this comparative analysis, there were five rounds of TBL in each class. At each process TBL, students performed Individual Reading Assurance Test (IRAT) in 10–15 minutes in early lectures. After IRAT process, students worked in groups to work on the problems RAT, it was called Group Reading Assurance Test (GRAT). The maximum scores of IRAT and GRAT was 100. Data for INB30020 were taken from 2nd semester of 2013 (INB30020-2/2013) and 1st semester of 2014 (INB30020-1/2014). Table 5.7 shows the mean and standard deviation of the overall IRAT. While Table 5.7 shows the mean and standard deviation of the overall GRAT.
2/2013 and INB30020 – 1/2014. Meanwhile, IRAT 1 and 2 on both classes were almost in the same mean score.
Table 5.8. Mean and Standard Deviation (SD) of GRAT for INB30020 were higher than the IRAT.
Mean of Reading Assurance Test (RAT) for ACCT6087
The data for ACCT6087 were taken form class LD21 and class LF21. The class LD21 consisted of 23 students and LF21 consisted of 43 students. Table 5.9 shows the mean and standard deviation of the overall IRAT. While Table 5.10 shows the mean and standard deviation of the overall GRAT.
(6.91). The lowest in the IRAT class mean LF21 and LD21 occured in IRAT 2. Mean IRAT 5 was higher than IRAT 4 i.e. 26.63 (10.01) to 70.38 (16.77). Yet at LD21 class, the mean of IRAT 4 to 5 IRAT declined.
Table 5.10. Mean (SD) of GRAT for ACCT6087
Course N GRAT meaning all groups received the maximum value. While the lowest mean GRAT occurred in GRAT 2 LD21 class, i.e., 59.79 (22.80). Generally, mean GRAT value at all class was above 50.
Comparative Analysis Finding
Table 5.11. Mean and SD of IRAT and GRAT for Class Combination of INB300200 at SUT
Class Combination of INB30020 -SUT
MEAN
Table 5.12. Mean and SD of IRAT and GRAT for Class Combination of ACCT6087 at BINUS
Class Combination of BA - BINUS
Regression analysis was done to determine the direction of the relationship between IRAT as independent variables and Final Exam as dependent variable; and whether each independent variable associated positively or negatively, and to predict the value of the dependent variable when the independent variables increase or decrease. Table 5.13 shows the R Square and Coefficient of IRAT for Final Exam at SUT. Meanwhile, table 5.14 shows the R Square and Coefficient of IRAT for Final Exam at BINUS.
Table 5.13. R Square and Coefficient of IRAT for Final Exam at SUT
R Square 32,90% Coefficient p-value
Intercept 9,5964 0,0002* IRAT 1 1,5495 0,0055* IRAT 2 2,7798 0,0001* IRAT 3 0,9525 0,1030 * significant at p < 0.05
Table 5.14. R Square and Coefficient of IRAT for Final Exam at BINUS
R Square 22.10% Coefficient p-value
Intercept 37.532 0,001* IRAT 1 -0.057 0.668 IRAT 2 0.206 0.203 IRAT 3 -0.024 0.815 IRAT 4 0.241 0.002* IRAT 5 0.180 0.113 * significant at p < 0.05
CONCLUSIONS
The application of Team-Based Learning (TBL) can serve as a significant predictor for overall course performance. The conclusions obtained from the data in the two countries are mean value of GRAT always higher than the IRAT and final exams are positively influenced by IRAT. This means that the group work more meaningful. Learning difficulties can be solved much easier in groups. In other words, group had a significant impact in the learning process (Webb, Palincsar, & Annemarie, 1996). Students are involved in group learning activities and motivated to achieve better academic results. Based on all of the finding, it can be concluded that TBL can be used to increase student performance.
BIBLIOGRAPHY
Alebaikan, R., and S. Troudi. 2010, Blended learning in Saudi Universities: Challenges and perspectives. ALT-J, Research in Learning Technology, Vol. 18(1), pp. 49-59.
Australian Bureau of Statistics (ABS). 2008, Labour Force, Australia, Cat. No. 6291.0.55.001. Canberra.
Bates, A. W. 2000, Managing technological change. Strategies for college and university leaders. San Francisco: Jossey-Bass.
Biggs, J. 1999, What the student does: Teaching for enhanced learning, Higher Education Research & Development, Vol. 18(1), pp.57-75.
Blackwell, A. 2011, Online is not always fine for Gen Y student, Campus Review, Vol. 21 (2), 8 February.
Bleed, R. 2001, A hybrid campus for a new millennium. Educause Review, Vol. 36(1), pp. 16-24.
Boyle, T., C. Bradley, P. Chalk, R. Jones, and P. Pickard. 2003, Using blended learning to improve student success rates in learning to program. Journal of Educational Media, Vol. 28 (2-3), pp. 165-78.
Brown, A., and J. Johnson. 2003, Five advantages of using a learning management system. Retrieved December 10, 2009, from Microburst Learning: www.microburstlearning.com.
Brown, S, and P. Knight. 1997, Assessing learners in higher education, London: Kogan Page.
Collins, J. 2006, Writing multiple choice questions for continuing
medical education activities and self-assessment modules.
http://pubs.rsna.org/doi/full/10.1148/rg.262055145. Radio Graphics, 26 (2). North America. Accessed on 9 October 2014.
DEEWR. 2009, Summary of the 2009 higher education student statistics, viewed 20 May 2011, http://www.deewr.gov.au/HigherEducation/ Publications/HEStatistics/Publications/Documents/2009/09FullYearSum mary.pdf.
DeLacey, B., and D. Leonard. 2002, Case study on technology and distance in education at the Harvard Business School, Educational Technology and Society, Vol 5(2), pp.13–28.
Epstein Educational Enterprises. What is the IF-AT?. http://if-at.com/home/. Accessed on 9 October 2014.
Fink, D. 2002, Beyond Small Groups: Harnessing the Extraordinary Power of Learning Teams. In L. K. Michaelsen, B. K. Arletta, and L. D. Fink (Eds.), Team based learning: A transformative use of small groups in college teaching. Chapter 1. Stylus Publishing. USA.
Fink, L. D. 2004, Creating significant learning experiences: An integrated approach to designing college courses, San Francisco: Jossey-Bass.
Frost, R., A. T. Bianco, and L. Krewatch. 2003, Learning from our mistakes: Interactive testing that rewards real learning. 23rd Annual Lilly Conference on College Teaching.
Garrison, D. R., and T. Anderson. 2003, E-learning in the 21st century: A framework for research and practice. London: RoutledgeFalmer.
Gibbs, G. 1992, Improving the quality of student learning, Bristol: TES.