Full Terms & Conditions of access and use can be found at
http://www.tandfonline.com/action/journalInformation?journalCode=vjeb20
Download by: [Universitas Maritim Raja Ali Haji] Date: 11 January 2016, At: 20:41
Journal of Education for Business
ISSN: 0883-2323 (Print) 1940-3356 (Online) Journal homepage: http://www.tandfonline.com/loi/vjeb20
A Ranking Analysis of the Management Schools in
Greater China (2000–2010): Evidence From the SSCI
Database
Mingjun Hou, Peihua Fan & Heng Liu
To cite this article: Mingjun Hou, Peihua Fan & Heng Liu (2014) A Ranking Analysis of the Management Schools in Greater China (2000–2010): Evidence From the SSCI Database, Journal of Education for Business, 89:5, 230-240, DOI: 10.1080/08832323.2013.863750
To link to this article: http://dx.doi.org/10.1080/08832323.2013.863750
Published online: 03 Jul 2014.
Submit your article to this journal
Article views: 69
View related articles
View Crossmark data
A Ranking Analysis of the Management Schools
in Greater China (2000–2010): Evidence
From the SSCI Database
Mingjun Hou and Peihua Fan
Xi’an Jiaotong University, Xi’an, ChinaHeng Liu
Sun Yat-Sen University, Guangzhou, China
The authors rank the management schools in Greater China (including Mainland China, Hong Kong, Taiwan, and Macau) based on their academic publications in the Social Sciences Citation Index management and business journals from 2000 to 2010. Following K. Ritzberger’s (2008) and X. Yu and Z. Gao’s (2010) ranking method, the authors develop six indices to rank institutions from several aspects, including both the quantity and quality of publications. By doing so, they provide a clear viewpoint about which institutions achieve high levels of academic performance in management and business research. They also find that (a) there is still a large gap in research rankings between business schools in Mainland China and in Hong Kong; (b) some institutions perform well in quantity rankings but poorly in quality rankings; (c) the development of the general management and operation disciplines are much more mature than that of the finance and accounting disciplines in Greater China; and (d) most outstanding institutions cooperate with developed countries at a moderate level. The authors state their contributions and future directions as well.
Keywords: Greater China, management schools, ranking analysis
Universities all around the world are given two important responsibilities for society: knowledge creation and knowl-edge dissemination (Mudambi, Peng, & Weng, 2008). In Chinese universities, knowledge dissemination through teaching has received long-term attention. As China has gone through tremendous change in its education system, universities in China are increasingly focusing on knowl-edge creation through scientific research and academic pub-lication (Au, 2007). In particular, pubpub-lication in leading management journals is regarded as the main output of management research and a key indicator of a school’s overall capacity to produce knowledge, as well as of its aca-demic reputation (Peng & Zhou, 2006).
Several scholars have already ranked research institutions or scholars, both globally and within China, by their publi-cations in economic journals and management journals (Kalaitzidakis, Mamuneas, & Stengos, 2003; Mudambi et al., 2008; Yu & Gao, 2010). For instance, both Kalaitzi-dakis et al. (2003) and Coupe (2003) ranked the world’s top 100 institutions by their publications in a list of international economic journals. Yu and Gao similarly ranked economic research institutions in China based on their publications from 2000 to 2009 in the Social Sciences Citation Index (SSCI) database and found a large gap in the research capacity of institutions between Mainland China and Hong Kong, specifically in the field of economics. In the fields of business and management, Mudambi et al. (2008) ranked the top 130 Asia Pacific business schools by their publica-tion productivity. There are also some ranking studies of economics and management in other regions such as the United States (Chan & Liano, 2009), Central and Eastern Europe (Meyer & Peng, 2005), and Western Europe (Baden-Fuller, Ravazzolo, & Schweizer, 2000).
Correspondence should be addressed to Peihua Fan, Xi’an Jiaotong University, School of Management, Box. 2269, No. 28, Xianning West Road, Xi’an 710049, China. E-mail: [email protected]
Color versions of one or more of the figures in the article can be found online at www.tandfonline.com/vjeb.
ISSN: 0883-2323 print / 1940-3356 online DOI: 10.1080/08832323.2013.863750
In spite of this proliferation of research in publication ranking, there are some limitations in existing findings. First, few studies rank the management schools in China based on their research publications in recent years. Mudambi et al. (2008) ranked the research productivity of Asian Pacific business schools with the help of three data-bases: the University of Texas at Dallas’s listing of 24 lead-ing business journals (UTD-24), seven top management journals in the University of Texas at Dallas’s database, and five Asia Pacific management journals. However, their studies did not use the SSCI database, which is a more sys-tematic database to do comparative studies, and their meth-odologies were constrained by use of direct counting as a methodology.
Second, some ranking studies do not differentiate the quality of publication when counting the numbers of publi-cation. However, the quality of a publication is very impor-tant for the ranking process (Yu & Gao, 2010). For instance, from the perspective of academic standard, an article published in theAcademy of Management Journal (where the impact factor in 2010 was 5.250) may have a much greater contribution than an article published in Inter-national Journal of Technology Management (where the impact factor in 2010 was 0.519). In fact, while publication counts reflect the output quantity of universities (Xu et al., 2008), it is publication citations that reflect the output qual-ity of universities (Peng & Zhou, 2006).
Third, a fairly large number of articles are affiliated with more than one institution, which should be distributed in proportion to each institution. However, some ranking stud-ies do not make this distinction (Mudambi et al., 2008). To avoid these problems, we therefore conclude that both the quantity and quality of publications can indicate the dif-ferences between academic levels of universities, and we use the methodologies developed by Ritzberger (2008) and Yu and Gao (2010) to do an undated ranking analysis of management schools in Greater China area. To achieve this goal, we collected relevant data of articles that had been published by institutions in Greater China area (Mainland China, Hong Kong, Taiwan, and Macau) in business and management journals listed in the SSCI database over the past 11 years (2000.1–2010.12). We also provided a com-prehensive analysis based on this data by combining publi-cations counts with the impact factor of journals. Finally, we developed an updated ranking of management schools in Greater China, finding some interesting results.
This study makes three novel contributions. First, we include new data on business and management articles pub-lished in the SSCI database during the last decade (2000– 2010) and rank the research capability of institutions in the Greater China area from the publication results. Second, according to the recommendation of Ritzberger (2008) and Yu and Gao (2010), we not only rank the institutions by their total publications, but also by real publications (accounting for coauthorship) and adjusted publications
(accounting for the impact factors), allowing us to examine the quantity and the quality of publications. Third, we point out the relatively stronger or weaker areas of research by institutions in Greater China, a move that may have benefit for education reform, institutional development, and schools’ ability to publish more in top journals in the future.
DATA COLLECTION AND METHODOLOGY
We selected management or business articles published by universities in Greater China (including Hong Kong, Tai-wan, and Macau) in the past decade (2000–2010), which were derived from the SSCI database.
Why Publication of Articles?
Teaching and researching are two basic missions of the modern university. Therefore, rankings of management schools depend on their teaching and research output. There have been some rankings based on teaching, graduates’ sal-aries, and other indicators, such as the Financial Times rankings and Forbes rankings. In addition, recent research concluded that there is a strong correlation among research-ing, teachresearch-ing, school rankings, and faculty research produc-tivity (e.g., Siemens, Burton, Jensen, & Mendoza, 2005; Tracy & Waldfogel, 1997). Mudambi et al. (2008) also sug-gested that achieving research excellence is a highly desir-able aim for Asia Pacific business schools, and that excellence can be measured by their publications in scien-tific journals. As our study focuses on the measurement of the knowledge creation capabilities of institutions in the Greater China area, we thus calculated the ranking by the performance of scientific publications in the domains of management and business.
Why the SSCI Database?
SSCI is an interdisciplinary citation index produced by Thomson Reuters and includes 3,131 leading global social science journals (as of June 28, 2013) that write across 50 disciplines, including management and business. It was developed by the Institute for Scientific Information (ISI). In 2011, SSCI included 145 management journals and 98 business journals (there are 37 journals in the domains of management and business). We chose the SSCI database for our ranking research for five important reasons. First, SSCI is a mature and systematic database. Many studies have collected data from SSCI for ranking (Engemann & Wall, 2009; Yu & Gao, 2010), and the legitimacy of SSCI has been confirmed many times, meaning that it is a good foundation for conducting sound research. Second, SSCI is the most acceptable and popular index in the field of man-agement for Chinese research institutions. SSCI is available online through the Web of Science service in university libraries, so that further research can be supported by this
impressive database. Third, the impact-factors of journals included in the SSCI database, which can be used to reflect the quality of publications as well as used for the analysis of both publication counts and adjusted publication counts by journal quality, are vital to our methodological contribu-tion. Fourth, many Chinese universities tend to use SSCI criteria to judge their professors’ productivity and to set up policies to encourage the scholars to publish articles in SSCI listed journals, especially the ones with a high citation index.
Why Greater China?
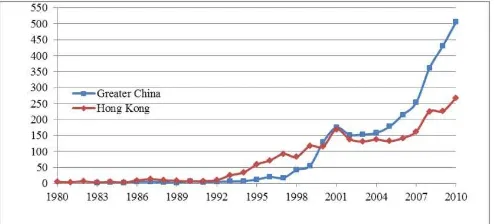
Ranking results will vary according to different periods and various regions. With the continuous reform and opening-up movement, China has made rapid progress in developing its economy. Meanwhile, China has engaged in reforming the university education system. Consequently, more and more research articles have been published in international journals by Chinese institutions especially since 2000 (see Figure 1). However, the studies that directly examine the performance of academic research for schools in the Greater China area are limited (Peng, Lu, Shenkar, & Wang, 2001), especially for the business and management disciplines. As most of the rankings, such as Wu’s ranking, only account for universities in Mainland China, we need to expand the ranking scope to take Hong Kong, Macau, and Taiwan into account. By doing so, we can compare the relative publication capabilities in different parts of the Greater China area.
From the previous analysis, our data for ranking are derived from the articles in SSCI business and management journals, which were published by institutions in Greater China from January 2000 to December 2010. We exclude meeting abstracts, proceeding articles, book reviews and editorial materials. In summary, there were a total of 2,574 articles published by faculties or students of Chinese uni-versities and scientific institutions.
Why Both Quality and Quantity?
In general, high-quality articles should be published in high-quality journals because the reputation of journals and
the rigorous peer-review process can ensure the quality. Some management schools (especially for schools in Main-land China) may obtain their reputation through publishing several articles in top tier journals. The impact factor, the average number of citations received per article published in a particular journal during the two preceding years, is widely used for measuring the quality of a journal (Jarwal, Brion, & King, 2009; Peng & Zhou, 2006). Some scholars suggested that this indicator is much more available in a certain field than in various fields (Jemec, 2001), and it is applicable for this ranking in the field of management and business.
Counting Method and Criteria
One of the standard methodologies to rank research produc-tivity is counting the number of publications in refereed academic journals (Xu, Yalcinkaya, & Seggie, 2008). How-ever, this ranking result can be biased because it is not cor-related with the impact of publications, which is often measured by citations (Peng & Zhou, 2006). So far, many approaches have been developed for correcting the biases, such as the BT-method (Bradley & Terry, 1952), the LP-method (Liebowitz & Palmer, 1984), the H-index LP-method (Hirsch, 2004), the tournament method (Koczy & Strobel, 2007), and the invariant method (Palacio-Huerta & Volij, 2004). Ritzberger (2008) conducted a review of these meth-ods and suggested that although these ranking methmeth-ods might be different, the ranking results will be largely con-sistent with each other, especially for top journals. We chose to follow Ritzberger’s method and adopt six indexes (publication counts, coauthorship-adjusted articles, impact factor–adjusted articles, average quality of articles, inde-pendent research capacity, and cooperation intensity) to reflect the research ability of institutions in Greater China area in the research domains of business and management.
Publication counts. For the basic ranking of manage-ment schools in Greater China, we believe that it is neces-sary to start with the simplest method publication counts (P), which can be directly obtained from the SSCI database. For each separate institution, when any publication is affili-ated with it, the institution will be counted once.
FIGURE 1 Publication of management and business articles in Greater China and Hong Kong (1980–2010).
Specifically, when an institution appears more than once in the affiliation information of an article, the institution should be counted only once. This basic index can be calcu-lated by the following equation:
PjD
X
niD1 Ci j
When an institutionjappears in the affiliation of articlei, the indexCi jD1 in the equation, otherwiseCi jD0.
Coauthorship-adjusted articles. If we use the first index to rank institutions in management research, it will be wrongly believed that the institution that published one article independently made the same contribution as the institution that published one article through cooperation with other institutions. That is to say, the publication counts cannot truly reflect the real number of publications by an institution. Consequently, we should consider the problem of coauthorship to adjust the aforementioned index.
We adopt the following three steps to adjust the index. First, if an articleihasaiauthors and one authorMis
affili-ated tokmiinstitutions, authorMactually contributesai1kmiof
this article for each institution. Second, if there are two or more authors affiliated with institutionj, the total contribu-tion of institucontribu-tionjto articleishould be added together as follows:
When authorMof articleiis affiliated to institutionj, the indexCimj D1 in the equation, otherwiseCimj D0. Third,
all the contribution of thesenarticles should add up. Then the coauthorship adjusted articles of institutionjare the fol-lowing:
In the process of collecting data, we found that the rela-tionship between authors and institutions in the database of the SSCI is not clear before 2007, so that we cannot use equation 2 to calculate this index. Given this reality, we tried to reduce bias on the affiliation between authors and institutions by downloading and checking the articles, obtaining author’s information via the Internet, and so on. For authors whose information was hard to obtain, we assume that each institution contributes equally to an article published before 2007. In the years from 2008 to 2010, the affiliation between authors and institutions is clear, so that
we can use equation 2 to work out the coauthorship-adjusted articles (CAP) of each institution.
Impact factor–adjusted articles. As we mentioned previously, the quality of an article is very important in reflecting the research capacity of institutions (Yu & Gao, 2010). However, neither of the two indexes we introduced before involves the quality factor of the publications. In this case, it will be unjustifiably considered that an article published in theAcademy of Management Journal(which in 2010 had an impact factor of 5.250) might have the same contribution as an article published in the International Journal of Technology Management(which had an impact factor of 0.519 in 2010). The impact factor is widely used to measure the quality of a journal by scholars in that research area (Jarwal et al., 2009; Peng & Zhou, 2006), and therefore, we should also consider article quality by taking the impact factors into account.
On the basis of the CAP index, we further readjusted by involving the impact factors of journals in the SSCI data-base. WhenIfiis the impact factor of the journal in which articlei is published, we can give an index for measuring the contribution of institution j to research development (publications in SSCI database) as follows:
IAPjD
Average quality of articles. We can get an indicator of the average impact factor of the publications developed by one institution by dividing impact factor–adjusted publi-cations (IAP) by the CAP, which reflect the average quality (AQ) of articles published by an institution in the SSCI database. The formula is as follows:
AQjD
IAPj CAPj
It is much more difficult to publish articles in high-level journals, especially when considering the difference between top tier journals and ordinary journals. Conse-quently, many institutions in China publish many articles in low-quality journals instead of a small number of articles in high-quality journals. Nevertheless, high-quality studies represent real knowledge creation and give long-term repu-tations to scholars and institutions. Therefore, this index plays an important role in ranking the research institutions in Greater China.
Independent research capacity. We also can get another indicator of independent research capacity (IRC) regarding an institution by dividing the CAP by the P
counts. This index is brought forward to reflect the capacity of an institution to independently complete publications in the SSCI database. The formula is as follows:
IRCjD
CAPj Pj
The more articles are independently published by an institution, the higher this index will be. Assuming that institutionjcompletes all the publications independently by itself, then the CAP index is equal to the P counts index, and we get the maximum of this index (IRCmaxD1). The
more cooperation an institution has with others to complete a publication, the lower this index will be.
Cooperation intensity with Europe or the United States. This index is introduced to measure the level of cooperation between Chinese scholars and scholars in Europe and the United States. With the reform of the educa-tion system, Chinese scholars are encouraged to cooperate with scholars in developed countries (especially Europe and the United States) to improve the level of their scien-tific research. Many management schools in Mainland China, Taiwan, Hong Kong, and Macau look for coopera-tion abroad to increase their number of publicacoopera-tions through hiring foreign scholars to help in writing collaborative articles.
We first introduce another index Coj as a measure of cooperation with developed countries. If an article i has affiliations to both domestic institutionjand a European or American institution,CojD1, otherwiseCojD0., and then
dividingCojby P counts, we will get the index of coopera-tion intensity (CI) with Europe or the United States, as follows:
CIjD
Coj Pj
If all the publications by an institution are completed through cooperating with scholars in developed countries (chiefly in the United States and European countries), we get the maximum of this index (CImaxD1). If all the
publi-cations by an institution are completed without the help of institutions in Europe or the United States, we get the mini-mum of this index (CIminD0).
In summary, we introduce six indexes that reflect dif-ferent aspects of the research capacity of an institution. It is difficult to combine all these six indexes together into one index to measure the overall research capacity of an institution. The index of IAP is the most comprehensive indicator, which considers both the quantity and the qual-ity of publication. Therefore, the final results of the rank-ing are based on these six indexes, especially on the IAP index.
RANKING FINDINGS
Figure 1 compares the number of publications in the disci-plines of management or business by institutions in Hong Kong and Greater China, which have been indexed by SSCI from 1980 to 2010. We can conclude that the number of research articles in Greater China has increased rapidly since 2000, averaging an increase rate of over 10% per year since 2005.
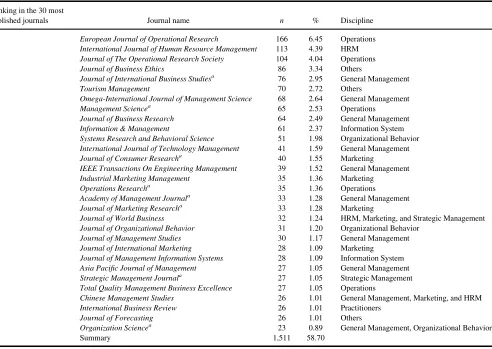
Table 1 lists the 30 most published journals, which account for more than half (58.70%) of the total publica-tions. The four most published journals areEuropean Jour-nal of Operational Research (6.45%), International Journal of Human Resource Management(4.39%),Journal of the Operational Research Society(4.04%), andJournal of Business Ethics(3.34%). Four ratios added together pro-vide the concentration of the four most published journals (C4 index) as 18.22%. However, there are no UTD-24 jour-nals, which are international top tier journals in manage-ment, in the four most published journals. In the 30 most published journals, there are only eight UTD-24 journals, indicating that the quality of publications in Greater China could be enhanced in the future. Meanwhile, we can see from Table 1 that the most published journals are chiefly in the domains of general management (nine), marketing (six), operations management (five), and others, but none in the finance and accounting domains, which indicates that the development of each discipline is varied.
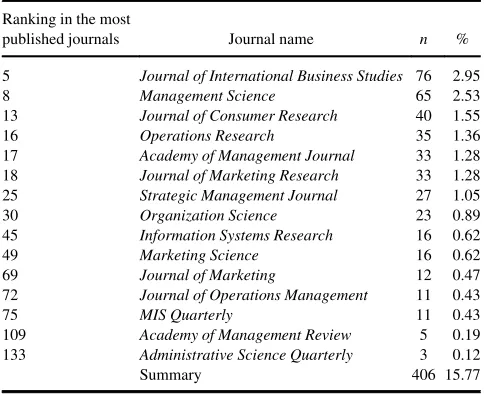
Table 2 shows the distribution of the articles in UTD-24 journals. There are 406 articles (15.77%) published in 15 of the UTD-24 journals. That may suggest again the necessity for considering the influence of publication quality on the ranking analysis. Except these fifteen UTD-24 journals, Chinese scholarship has never been published in the other nine journals, most of which are in the domains of finance and accounting (i.e.,Journal of Accounting and Economics, Journal of Accounting Research,Journal of Finance, Jour-nal of Financial Economics,The Accounting Review, and The Review of Financial Studies). This result is congruent with Table 1 in that the development of the finance and accounting discipline (in Greater China) is slow as com-pared to other disciplines. The possible reason is as follows. There were no internationally accepted accounting princi-ples in China until 2005. Therefore, the data Chinese scholars used in their research were unacknowledged in the international academic community. As a result, their research has seldom been published in international jour-nals. Therefore, Chinese scholars focus more on finance and management, but seldom on accounting.
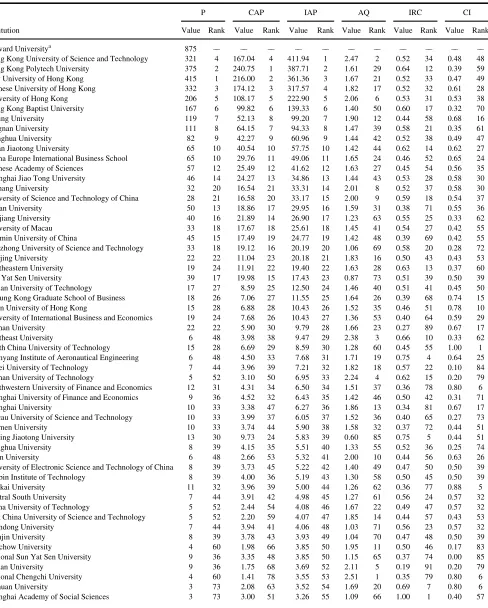
Table 3 shows the rankings of institutions in Greater China from 2000 to 2010 with more than three publications in the SSCI listed journals in the domains of business and management.
First, based on the publication counts, we find the top six institutions in Greater China are all in Hong Kong: City
University of Hong Kong (CHUK; 415), Hong Kong Poly-technic University (375), Chinese University of Hong Kong (332), Hong Kong University of Science and Tech-nology (HKUST; 321), University of Hong Kong (206), and Hong Kong Baptist University (167). They are fol-lowed by Peking University (119), Lingnan University (111), Tsinghua University (82), Xian Jiaotong University (65), and China Europe International Business School (65). There is only one institution in Mainland China (Peking University) that published more than 100 articles. The gap between City University of Hong Kong (top one in Hong Kong) and Peking University (top one in Mainland China) is so large that the former published almost four times more articles than those published by the latter. This indicates that the research capacity of institutions in Mainland China is weaker than that of Hong Kong.
Secondly, if we account for the fact that an article could be attributed to multiple institutions and use the CAP index instead of the P count, the ranking order will be changed a
little, but the top six institutions are still the six in Hong Kong. However, the seventh is no longer Peking University (52.13) but rather Lingnan University (64.15), another insti-tution in Hong Kong. This indicates that instiinsti-tutions in Hong Kong perform better before or after coauthorship adjustment.
Third, if we take both the quantity and quality of publi-cations into account and use the IAP index, the top six insti-tutions are still the same, but the ranking order is different. For instance, HKUST ranks first according to IAP index but ranks fourth according to both the P index and CAP index, suggesting that HKUST performs very well in qual-ity rankings. In contrast, CUHK ranks first according to the P index, ranks second according to CAP index, and ranks third according to IAP index, suggesting that CUHK per-forms less well in quality rankings than in quantity rankings.
Fourth, we also consider the average quality of articles by using the AQ index and the capacity of independent TABLE 1
The 30 Most Published Journals by Chinese Institutions (2000–2010)
Ranking in the 30 most
published journals Journal name n % Discipline
1 European Journal of Operational Research 166 6.45 Operations
2 International Journal of Human Resource Management 113 4.39 HRM
3 Journal of The Operational Research Society 104 4.04 Operations
4 Journal of Business Ethics 86 3.34 Others
5 Journal of International Business Studiesa 76 2.95 General Management
6 Tourism Management 70 2.72 Others
7 Omega-International Journal of Management Science 68 2.64 General Management
8 Management Sciencea 65 2.53 Operations
9 Journal of Business Research 64 2.49 General Management
10 Information & Management 61 2.37 Information System
11 Systems Research and Behavioral Science 51 1.98 Organizational Behavior
12 International Journal of Technology Management 41 1.59 General Management
13 Journal of Consumer Researcha 40 1.55 Marketing
14 IEEE Transactions On Engineering Management 39 1.52 General Management
15 Industrial Marketing Management 35 1.36 Marketing
16 Operations Researcha 35 1.36 Operations
17 Academy of Management Journala 33 1.28 General Management
18 Journal of Marketing Researcha 33 1.28 Marketing
19 Journal of World Business 32 1.24 HRM, Marketing, and Strategic Management
20 Journal of Organizational Behavior 31 1.20 Organizational Behavior
21 Journal of Management Studies 30 1.17 General Management
22 Journal of International Marketing 28 1.09 Marketing
23 Journal of Management Information Systems 28 1.09 Information System
24 Asia Pacific Journal of Management 27 1.05 General Management
25 Strategic Management Journala 27 1.05 Strategic Management
26 Total Quality Management Business Excellence 27 1.05 Operations
27 Chinese Management Studies 26 1.01 General Management, Marketing, and HRM
28 International Business Review 26 1.01 Practitioners
29 Journal of Forecasting 26 1.01 Others
30 Organization Sciencea 23 0.89 General Management, Organizational Behavior
Summary 1,511 58.70
Note:The total number of the publications is 2,574.
aJournal belongs to the University of Texas at Dallas’s listing of 24 leading business journals (UTD-24).
research by the IRC index finding no significant difference in either when considering institutions in Mainland China and Hong Kong.
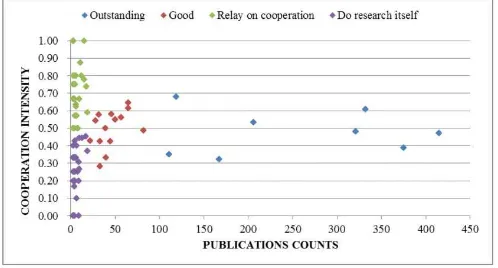
Finally, we look at the ranking of cooperation intensity with Europe and the United States (CI), the indicator used to measure the percentage of articles published by cooperat-ing with scholars in Europe and the United States. We find that there is no linear relationship between the IAP value and the CI value (see Figure 2). However, the CI values of the 23 institutions who published more than 20 articles are between 0.3 and 0.7 (except for Huazhong University of Science and Technology, whose CI value is 0.28). We divided these 91 institutions in Greater China with more than three publications in the SSCI into four clusters according to the P index and the CI index. There were eight institutions that published more than 100 articles over the last decade in the first cluster (marked in Figure 2). They could be identified as outstanding institutions with the strongest research capacity, and their CI values were all in midlevel. There were 15 institutions in the second cluster (marked in Figure 2) that published more than 20 articles, but less than 100 articles, over the last decade. Institutions in the second cluster could be considered to perform well in research, but not as well as institutions in the first cluster. Their CI values were also in midlevel. The other institu-tions, whose published less than 20 articles, can be further divided based on the CI index. Those institutions with a high CI index (no less than 0.50) can be regarded as relying more on cooperation with European and U.S. institutions
than institutions with a low CI index (less than 0.5). There are several extreme examples like South China University of Technology, Zhejiang University of Technology, Hebei University of Technology, and Macau’s Institution for Tourism Studies that all had the maximum CI index value, while National Sun Yat-Sen University, East China Normal University, Capital University of Economics and Busi-nesses, Shanghai Second Polytechnic University, China University of Mining and Technology, Chinese Academy of Social Sciences, and National Tsing Hua University all had the minimum CI index value. However, none of them published more than 20 articles in SSCI during the last decade. This may indicate either excessive reliance on cooperation with developed countries or that working alone is not good for publication outcomes.
DISCUSSION
Academic Contributions
We engage in this updated ranking of management schools in Greater China (including Mainland China, Hong Kong, Taiwan, and Macau) by using six indexes that contribute to current academic literature in the following five aspects.
First, this article contributes to the literature by giving a systematic ranking analysis of management schools in Greater China based on the academic publications of the SSCI database from 2000 to 2010. Following Ritzberger’s (2008) and Yu and Gao’s (2010) ranking method, we developed six indexes, which indicated different aspects of each institution’s research capacity (both the quantity and the quality of publications), to provide ranking results as comprehensive as possible. Therefore, this study fills an important research objective of understanding the current research capacity of institutions in Greater China by including both quantity and quality of publication indexes. This finding provides useful information for both international and Chinese scholars. In this era of globalization, where scholars and students wish to acquire more information on the reliability of those they deal with, the ranking analysis plays an important role. For instance, this ranking research can be assigned in a mas-ter of business administration course where students take a trip to Greater China to learn of its business practices and development. In addition, our finding illustrates the underdeveloped condition of financial and accounting in Greater China. International scholars should pay more attention that it would be difficult for them to cooperate with Chinese scholars in these disciplines.
Second, from the results we find out that the top six insti-tutions with both high quantity and quality of articles are all in Hong Kong, which indicates that there is still a large gap in research capacity between Mainland China and Hong Kong. This finding is similar to Mudambi et al. (2008)’s TABLE 2
The Distribution of Articles in UTD-24 Journals (2000–2010)
Ranking in the most
published journals Journal name n %
5 Journal of International Business Studies 76 2.95
8 Management Science 65 2.53
13 Journal of Consumer Research 40 1.55
16 Operations Research 35 1.36
17 Academy of Management Journal 33 1.28
18 Journal of Marketing Research 33 1.28
25 Strategic Management Journal 27 1.05
30 Organization Science 23 0.89
45 Information Systems Research 16 0.62
49 Marketing Science 16 0.62
69 Journal of Marketing 12 0.47
72 Journal of Operations Management 11 0.43
75 MIS Quarterly 11 0.43
109 Academy of Management Review 5 0.19
133 Administrative Science Quarterly 3 0.12
Summary 406 15.77
Note:The total number of the publications is 2,574. Other journals of
the University of Texas at Dallas’s listing of 24 leading business journals (UTD-24) areJournal of Accounting and Economics,Journal of
Account-ing Research,Journal of Finance,Journal of Financial Economics,
Jour-nal on Computing, Manufacturing & Service Operations Management,
Production and Operations Management, The Accounting Review, and
The Review of Financial Studies.
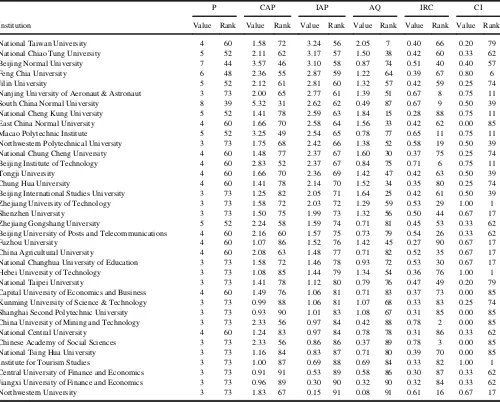
TABLE 3
Ranking by the Publications in the SSCI Database (2000–2010)
P CAP IAP AQ IRC CI
Institution Value Rank Value Rank Value Rank Value Rank Value Rank Value Rank
Harvard Universitya 875
Hong Kong University of Science and Technology 321 4 167.04 4 411.94 1 2.47 2 0.52 34 0.48 48 Hong Kong Polytech University 375 2 240.75 1 387.71 2 1.61 29 0.64 12 0.39 59 City University of Hong Kong 415 1 216.00 2 361.36 3 1.67 21 0.52 33 0.47 49 Chinese University of Hong Kong 332 3 174.12 3 317.57 4 1.82 17 0.52 32 0.61 28 University of Hong Kong 206 5 108.17 5 222.90 5 2.06 6 0.53 31 0.53 38 Hong Kong Baptist University 167 6 99.82 6 139.33 6 1.40 50 0.60 17 0.32 70 Peking University 119 7 52.13 8 99.20 7 1.90 12 0.44 58 0.68 16 Lingnan University 111 8 64.15 7 94.33 8 1.47 39 0.58 21 0.35 61 Tsinghua University 82 9 42.27 9 60.96 9 1.44 42 0.52 38 0.49 47 Xi’an Jiaotong University 65 10 40.54 10 57.75 10 1.42 44 0.62 14 0.62 27 China Europe International Business School 65 10 29.76 11 49.06 11 1.65 24 0.46 52 0.65 24 Chinese Academy of Sciences 57 12 25.49 12 41.62 12 1.63 27 0.45 54 0.56 35 Shanghai Jiao Tong University 46 14 24.27 13 34.86 13 1.44 43 0.53 28 0.58 30 Beihang University 32 20 16.54 21 33.31 14 2.01 8 0.52 37 0.58 30 University of Science and Technology of China 28 21 16.58 20 33.17 15 2.00 9 0.59 18 0.54 37 Fudan University 50 13 18.86 17 29.95 16 1.59 31 0.38 71 0.55 36 Zhejiang University 40 16 21.89 14 26.90 17 1.23 63 0.55 25 0.33 62 University of Macau 33 18 17.67 18 25.61 18 1.45 41 0.54 27 0.42 55 Renmin University of China 45 15 17.49 19 24.77 19 1.42 48 0.39 69 0.42 55 Huazhong University of Science and Technology 33 18 19.12 16 20.19 20 1.06 69 0.58 20 0.28 72 Nanjing University 22 22 11.04 23 20.18 21 1.83 16 0.50 43 0.43 53 Northeastern University 19 24 11.91 22 19.40 22 1.63 28 0.63 13 0.37 60 Sun Yat Sen University 39 17 19.98 15 17.43 23 0.87 73 0.51 39 0.50 39 Dalian University of Technology 17 27 8.59 25 12.50 24 1.46 40 0.51 41 0.45 50 Cheung Kong Graduate School of Business 18 26 7.06 27 11.55 25 1.64 26 0.39 68 0.74 15 Open University of Hong Kong 15 28 6.88 28 10.43 26 1.52 35 0.46 51 0.78 10 University of International Business and Economics 19 24 7.68 26 10.43 27 1.36 53 0.40 64 0.59 29 Wuhan University 22 22 5.90 30 9.79 28 1.66 23 0.27 89 0.67 17 Southeast University 6 48 3.98 38 9.47 29 2.38 3 0.66 10 0.33 62 South China University of Technology 15 28 6.69 29 8.59 30 1.28 60 0.45 55 1.00 1 Shenyang Institute of Aeronautical Engineering 6 48 4.50 33 7.68 31 1.71 19 0.75 4 0.64 25 Hefei University of Technology 7 44 3.96 39 7.21 32 1.82 18 0.57 22 0.10 84 Wuhan University of Technology 5 52 3.10 50 6.95 33 2.24 4 0.62 15 0.20 79 Southwestern University of Finance and Economics 12 31 4.31 34 6.50 34 1.51 37 0.36 78 0.80 6 Shanghai University of Finance and Economics 9 36 4.52 32 6.43 35 1.42 46 0.50 42 0.31 71 Shanghai University 10 33 3.38 47 6.27 36 1.86 13 0.34 81 0.67 17 Macau University of Science and Technology 10 33 3.99 37 6.05 37 1.52 36 0.40 65 0.27 73 Xiamen University 10 33 3.74 44 5.90 38 1.58 32 0.37 72 0.44 51 Beijing Jiaotong University 13 30 9.73 24 5.83 39 0.60 85 0.75 5 0.44 51 Donghua University 8 39 4.15 35 5.51 40 1.33 55 0.52 36 0.25 74 Jinan University 6 48 2.66 53 5.32 41 2.00 10 0.44 56 0.63 26 University of Electronic Science and Technology of China 8 39 3.73 45 5.22 42 1.40 49 0.47 50 0.50 39 Harbin Institute of Technology 8 39 4.00 36 5.19 43 1.30 58 0.50 45 0.50 39 Nankai University 11 32 3.96 39 5.00 44 1.26 62 0.36 77 0.88 5 Central South University 7 44 3.91 42 4.98 45 1.27 61 0.56 24 0.57 32 China University of Technology 5 52 2.44 54 4.08 46 1.67 22 0.49 47 0.57 32 East China University of Science and Technology 5 52 2.20 59 4.07 47 1.85 14 0.44 57 0.43 53 Shandong University 7 44 3.94 41 4.06 48 1.03 71 0.56 23 0.57 32 Tianjin University 8 39 3.78 43 3.93 49 1.04 70 0.47 48 0.50 39 Soochow University 4 60 1.98 66 3.85 50 1.95 11 0.50 46 0.17 83 National Sun Yat Sen University 9 36 3.35 48 3.85 50 1.15 65 0.37 74 0.00 85 Hunan University 9 36 1.75 68 3.69 52 2.11 5 0.19 91 0.20 79 National Chengchi University 4 60 1.41 78 3.55 53 2.51 1 0.35 79 0.80 6 Sichuan University 3 73 2.08 63 3.52 54 1.69 20 0.69 7 0.80 6 Shanghai Academy of Social Sciences 3 73 3.00 51 3.26 55 1.09 66 1.00 1 0.40 57
(Continued on next page)
findings in the area of economics. We speculate the follow-ing reasons for this difference. One is that scholars in Hong Kong may have better academic training and better English skills than scholars in Mainland China. Another is that the education system in Mainland China is not as mature as that in Hong Kong, which results in many of China’s top scholars moving to Hong Kong’s universities to further their research. Moreover, our ranking may be an imperfect gauge because it only considers academic publications. However, the trend in Figure 1 shows that the research capacity of Mainland China’s schools is progressing
rapidly. We forecast that big changes will take place in the ranking within the next 10 years.
Third, our findings suggest that the rankings will be dif-ferent based on the quantity and quality of articles. Some institutions perform well in quantity rankings, but not as well in quality rankings. This indicates they may focus on publishing an extensive list of articles but put less emphasis on the quality of their publications. Therefore, we suggest that institutions only paying attention to one aspect, either quality or quantity, should adjust their incentive system to balance both the quantity and quality of publications. In TABLE 3
Ranking by the Publications in the SSCI Database (2000–2010)(Continued)
P CAP IAP AQ IRC CI
Institution Value Rank Value Rank Value Rank Value Rank Value Rank Value Rank
National Taiwan University 4 60 1.58 72 3.24 56 2.05 7 0.40 66 0.20 79 National Chiao Tung University 5 52 2.11 62 3.17 57 1.50 38 0.42 60 0.33 62 Beijing Normal University 7 44 3.57 46 3.10 58 0.87 74 0.51 40 0.40 57 Feng Chia University 6 48 2.36 55 2.87 59 1.22 64 0.39 67 0.80 6 Jilin University 5 52 2.12 61 2.81 60 1.32 57 0.42 59 0.25 74 Nanjing University of Aeronaut & Astronaut 3 73 2.00 65 2.77 61 1.39 51 0.67 8 0.75 11 South China Normal University 8 39 5.32 31 2.62 62 0.49 87 0.67 9 0.50 39 National Cheng Kung University 5 52 1.41 78 2.59 63 1.84 15 0.28 88 0.75 11 East China Normal University 4 60 1.66 70 2.58 64 1.56 33 0.42 62 0.00 85 Macao Polytechnic Institute 5 52 3.25 49 2.54 65 0.78 77 0.65 11 0.75 11 Northwestern Polytechnical University 3 73 1.75 68 2.42 66 1.38 52 0.58 19 0.50 39 National Chung Cheng University 4 60 1.48 77 2.37 67 1.60 30 0.37 75 0.25 74 Beijing Institute of Technology 4 60 2.83 52 2.37 67 0.84 75 0.71 6 0.75 11 Tongji University 4 60 1.66 70 2.36 69 1.42 47 0.42 63 0.50 39 Chung Hua University 4 60 1.41 78 2.14 70 1.52 34 0.35 80 0.25 74 Beijing International Studies University 3 73 1.25 82 2.05 71 1.64 25 0.42 61 0.50 39 Zhejiang University of Technology 3 73 1.58 72 2.03 72 1.29 59 0.53 29 1.00 1 Shenzhen University 3 73 1.50 75 1.99 73 1.32 56 0.50 44 0.67 17 Zhejiang Gongshang University 5 52 2.24 58 1.59 74 0.71 81 0.45 53 0.33 62 Beijing University of Posts and Telecommunications 4 60 2.16 60 1.57 75 0.73 79 0.54 26 0.33 62 Fuzhou University 4 60 1.07 86 1.52 76 1.42 45 0.27 90 0.67 17 China Agricultural University 4 60 2.08 63 1.48 77 0.71 82 0.52 35 0.67 17 National Changhua University of Education 3 73 1.58 72 1.46 78 0.93 72 0.53 30 0.67 17 Hebei University of Technology 3 73 1.08 85 1.44 79 1.34 54 0.36 76 1.00 1 National Taipei University 3 73 1.41 78 1.12 80 0.79 76 0.47 49 0.20 79 Capital University of Economics and Business 4 60 1.49 76 1.06 81 0.71 83 0.37 73 0.00 85 Kunming University of Science & Technology 3 73 0.99 88 1.06 81 1.07 68 0.33 83 0.25 74 Shanghai Second Polytechnic University 3 73 0.93 90 1.01 83 1.08 67 0.31 85 0.00 85 China University of Mining and Technology 3 73 2.33 56 0.97 84 0.42 88 0.78 2 0.00 85 National Central University 4 60 1.24 83 0.97 84 0.78 78 0.31 86 0.33 62 Chinese Academy of Social Sciences 3 73 2.33 56 0.86 86 0.37 89 0.78 3 0.00 85 National Tsing Hua University 3 73 1.16 84 0.83 87 0.71 80 0.39 70 0.00 85 Institute for Tourism Studies 3 73 1.00 87 0.69 88 0.69 84 0.33 82 1.00 1 Central University of Finance and Economics 3 73 0.91 91 0.53 89 0.58 86 0.30 87 0.33 62 Jiangxi University of Finance and Economics 3 73 0.96 89 0.30 90 0.32 90 0.32 84 0.33 62 Northwestern University 3 73 1.83 67 0.15 91 0.08 91 0.61 16 0.67 17
Note:Only rank institutions with three or more publications in 2000–2010 were ranked. Of these 2,574 publications, in the domains of management and
business from the Social Sciences Citation Index (SSCI) database, were published between 2000 and 2010. The publication (P) index indicates the number of publications an institution participates in; the coauthorship-adjusted article (CAP) index indicates the real number of publications an institution contributes to; the impact factor–adjusted publications (IAP) index is a comprehensive index to evaluate the research capacity of an institution; the average quality (AQ) index indicates the average quality of articles published by an institution; the independent research capacity (IRC) index indicates the ability of an institution to complete a publication independently; the cooperation intensity (CI) index indicates the extent to which an institution cooperates with those of developed countries (i.e., European countries and the United States in this study). Thepvalue of Harvard University was added as a reference point for productivity.
order to publish more in top journals, institutions can strengthen cooperation with influential foreign scholars. In addition, the Chinese Ministry of Education should notice the importance of balanced development and propose improvement measures.
Fourth, this study shows that the development of each discipline in management is varied. The 30 most published journals include general management and operations man-agement domains but no finance or accounting domains. Therefore, future development in China’s education reforms may need to enhance research capacity in finance and accounting domains to stimulate maturation in this underde-veloped facet of Chinese scholarship.
Finally, we divide all the institutions in our ranking into four clusters according to the P count and CI with devel-oped countries. We find that most institutions that published more than 20 articles over the past 10 years have a CI index between 0.3 and 0.7. That may indicate that either exces-sive reliance on cooperation with developed countries or complete independence for doing research is not the most effective strategy for the development of an institution’s research capability. Institutions should balance indepen-dence and cooperation to improve the institution’s research outcomes. As we know, Mainland institutions establish their reputations through different approaches. For instance, Peking University and Tsinghua University have regional advantages to attract more talented scholars and develop research cooperation with foreign agencies; China Europe International Business School is well known for its rich connections overseas, and Xi’an Jiao Tong University enhances its research capacity by recruiting and retaining productive scholars. All of them demonstrate possible strat-egies for other institutions to find a balance between inter-national cooperation and independent research.
Limitations and Future Research Directions
Despite its major contributions, this ranking research also has some limitations. First, this study used English-lan-guage publications in SSCI to rank management schools in Greater China, but Chinese-language publications were not
counted. Consequently, language bias may exist in this ranking method, which cannot reflect the complete research capacity of a research institution (Yu & Gao, 2010). As a consequence, future researchers should use Chinese publi-cations and English publipubli-cations to rank management schools in Greater China to extend this study.
Second, there are various ways to build a strong institu-tional reputation. Institutions may be committed to publish-ing books, participatpublish-ing in academic conferences, or publishing on nonacademic journals; however, the rankings of this article only take academic publications into account. Therefore, future scholars are encouraged to consider vari-ous scientific research outputs, such as participation in aca-demic conferences, when they conduct similar ranking research.
Third, our study describes the quantity and quality of articles published by these 91 institutions in Greater China, but the dynamic changes in quantity and quality of articles published by each institution are not revealed. The question of why and how some institutions rapidly developed research capacity over the past 10 years may be a promising research question for future studies. In addition, these underdeveloped disciplines, such as finance and accounting, need to be paid more attention in the future. It is an unprec-edented challenge, but also an opportunity at the same time.
CONCLUSION
We collected data of management or business articles pub-lished by institutions in Greater China (including Mainland China, Hong Kong, Taiwan, and Macau) in the SSCI data-base during the past decade (2000–2010). Based on a total of 2574 publications, this study provides the first ranking of management schools in Greater China based on Ritzberger’s (2008) and Yu and Gao’s (2010) ranking method. The ranking indicates that HKUST is the top research university in Greater China when considering both the quantity and quality of publications, CUHK ranks first according to only publication numbers, and Peking Univer-sity ranks number one among institutions in Mainland FIGURE 2 Publication count index and cooperation intensity index distribution of 91 management schools in Greater China.
China. The results of our study also suggest that while more and more research articles have been published in interna-tional journals by institutions in Mainland China, there is still a large gap between institutions in Mainland China and Hong Kong, which indicates that reform of the education system in Mainland China still has a long way to go. We also found that that some institutions performed well in quantity rankings, but not as well in quality rankings, thus some alterations should be applied to the incentive systems of these institutions to encourage higher quality publica-tions. In addition, we find that the Greater China’s develop-ments in general and operations management are much more mature than in the disciplines of finance and account-ing. Thus, in the future, China’s Ministry of Education and other relevant departments should pay more attention to the development of research related to financial and accounting disciplines. Finally, we also showed that institutions in Greater China should establish and maintain a balance between doing research independently and cooperating with developed countries to increase institutions’ research capacity.
REFERENCES
Au, K. (2007). Self-confidence does not come isolated from the environ-ment.Asia Pacific Journal of Management,24, 491–496.
Baden-Fuller, C., Ravazzolo, F., & Schweizer, T. (2000). Making and mea-suring reputations: The research rankings of European business schools.
Long Range Planning,33, 621–650.
Bradley, R. A., & Terry, M. E. (1952). Rank analysis of incomplete block designs: I. The method of paired comparisons.Biometrika,39, 324–345. Chan, K. C., & Liano, K. (2008). Threshold citation analysis of influential articles, journals, institutions and researchers in accounting.Accounting
and Finance,49, 59–74.
Coupe, T. (2003). Revealed performances: Worldwide rankings of econo-mists and economics departments, 1990–2000.Journal of the European
Economic Association,1, 1309–1345.
Engemann, K. M., & Wall, H. J. (2009). A journal ranking for the ambitious economist.Federal Reserve Bank of St. Louis Review,91(3), 127–139.
Hirsch, J. E. (2004). An index to quantify an individual’s scientific research output.Proceedings of the National Academy of Sciences,102, 16569–16572.
Jarwal, S. D., Brion, A. M., & King, M. L. (2009). Measuring research quality using the journal impact factor, citations and ranked journals: Blunt instruments or inspired metrics?.Journal of Higher Education
Policy and Management,31, 289–300.
Jemec, G. B. (2001). Impact Factor to Access Academic Output.The Lancet,358, 1373.
Kalaitzidakis, P., Mamuneas, T. P., & Stengos, T. (2003). Rankings of aca-demic journals and institutions in economics.Journal of the European
Economic Association,1, 1346–1366.
Koczy, L. A., & Strobel, M. (2007).The ranking of economics journals by
a tournament method. No. 1018, IEHAS Discussion Papers, Institute of
Economics, Centre for Economic and Regional Studies, Hungarian Academy of Sciences.
Liebowitz, S. J., & Palmer, J. C. (1984). Assessing the relative impacts of economics journals.Journal of Economic Literature,22, 77–88. Meyer, K. E., & Peng, M. W. (2005). Probing theoretically into Central
and Eastern Europe: Transactions, resources, and institutions.Journal of
International Business Studies,35, 600–621.
Mudambi, R., Peng, M. W., & Weng, D. H. (2008). Research rankings of Asia Pacific business schools: Global versus local knowledge strategies.
Asia Pacific Journal of Management,25, 171–188.
Palacio-Huerta, I., & Volij, O. (2004). The measurement of intellectual influence.Econometrica,72, 963–977.
Peng, M. W., Lu, Y., Shenkar, O., & Wang, D. Y. L. (2001). Treasures in the China house: A review of management and organizational research on Greater China.Journal of Business Research,52, 95–110.
Peng, M. W., & Zhou, J. Q. (2006). Most cited articles and authors in global strategy research. Journal of International Management, 12, 490–508.
Ritzberger, K. (2008). A ranking of journals in economics and related fields.German Economic Review,9, 402–430.
Siemens, J., Burton, S., Jensen, T., & Mendoza, N. (2005). An examination of the relationship between research productivity in prestigious business journals and popular press business school rankings.Journal of Business
Research,58, 467–476.
Tracy, J., & Waldfogel, J. (1997). The best business schools: A market-based approach.Journal of Business,70(1), 1–31.
Xu, S., Yalcinkaya, G., & Seggie, S. (2008). Prolific authors and institu-tions in leading international business journals.Asia Pacific Journal of
Management,25, 187–207.
Yu, X., & Gao, Z. (2010). An updated ranking of the economic research institutions in China (2000–2009). China Economic Review, 21, 571–581.