The economic impact of
loods and waterlogging on
low-income households
Lessons from Indore, India
About the authors
Pritee Sharma is Assistant Professor in the School of Humanities and Social Sciences, and Dean of Administration at the Indian Institute of Technology, Indore. She has a PhD from the Indian Institute of Technology, Bombay. She undertakes research and teaching in the areas of agricultural policy, climate change, energy and labour regulations in India. Dr Sharma is a life member of the International Society of Ecological Economics (ISEE) and the Indian Econometrics Society (TIES). She is also a core member of ImPRINT – Water , an initiative of the Government of India’s ministry of Human Resource Development and Namami Gange ministry of Water Resources.
Anup Karanth is Associate Director of TARU Leading Edge Pvt. Ltd. His core interest is in public safety and risk management. For more than a decade, mr Karanth has worked on understanding and developing risk management frameworks and solutions at various scales. His work focuses on connecting the dots between science institutions and society, mainly from the perspectives of urban risk reduction, urban climate change resilience building and risk governance.
megha Burvey is Senior Associate at TARU Leading Edge Private Ltd. She works in the areas of climate change resilience and adaptation, vulnerability assessment, urban water and resource management. ms Burvey also specialises in institutionalisation through community participation and strengthening stakeholders by capacity building and training, community-driven program design and implementation.
Amit Dubey is Senior Field Supervisor at TARU Leading Edge Private Ltd. He specialises in design, planning and assessment and implementation of ield-based studies in the areas of water, health (disease surveillance), sanitation and waste management systems (SLWm) in urban and rural areas.
Acknowledgements
Abstract
Contents
About the authors 2
Acknowledgements 2
Abstract 3
1 Introduction and objectives 5
1.1 Urbanisation and informal settlements 5 1.2 vulnerability to climate-related risks in urban informal settlements 5 1.3 Climate vulnerability and loss and damage interlinkages 6
1.4 objectives of the study 7
2 Complexity of the urban context 8
2.1 Climate vulnerability and the urban poor in India 8
2.2 Indore City 9
3 Estimating economic losses: exploring approaches 11
3.1 Role of institutions and policy 11 3.2 Economic loss and damage estimation 11 3.3 Factors inluencing loss and damage 14 3.4 Approach and methodology used 15 3.5 Analysis and steps in research design 15 3.6 Questionnaire design and survey 16
4 Empirical results 18
4.1 Socio-economic and risk proile of communities 18 4.2 Households’ income, assets and infrastructure 19 4.3 Impact of waterlogging and loods 21 4.4 Role of municipal corporations (local governments) 25
5 Conclusions 27
References 29
1 Introduction and objectives
1.1 Urbanisation and informal settlements
Economic growth contributes to urbanisation, and urbanisation feeds back into economic growth. But the scale and pace at which economies in Asia have experienced urbanisation has caught the planners in a state of deregulation and ambiguity (mukhopadhyay and Revi 2009; Roy, 2009). This fast-paced urbanisation is hampered by inadequate infrastructure, which turns Indian cities into landscapes of ‘bourgeois enclaves and slums’ that point towards sharp social divisions (Roy, 2009). In India, such economic growth has not been matched by job creation but it has increased the contractualisation,
casualisation and informalisation of labour (mehrotra et al., 2012). The 2011 Census shows that while the average
economic growth rate was 7.7 per cent per annum, the growth rate of employment was only 1.8 per cent. more than half of the employment growth in India’s organised sector remained informal (mehrotra et al., 2012). Informalisation in India
is understood as informal (ie. casual and contractual) employment in the organised (formal) sector; and employment in the unorganised (informal) sector, as described under the System of National Accounts 1993 (Datt, 2007). The primary determinants of informalisation in organised manufacturing are labour market regulations, and competition from exports and education, among other factors (Goldar and Aggarwal, 2010). However, informal employment opportunities in processing and service industries have increased tremendously at household and small-sector levels, resulting in a complex pattern of growth in informal settlements to house informal workers (Chakrabarti, 2001).
These informal settlements of low- and moderate-income groups lack suficient access to land, land development programs and the associated infrastructure necessary for providing basic amenities (Durand-Lasserve, 2006). The urban poor, in the absence of land tenure and a social safety net, are rendered more vulnerable by the ‘non-inclusive’ infrastructure development plans that create formal land and housing markets and large-scale land ownership programmes at the cost of those in informal settlements. In India, informal settlements can be registered, legal or illegal, or promised (Banerjee, 2002 In: Durand-Lasserve and Payne 2002), without amenities such as clean drinking water, sanitation (sewerage, drainage and solid waste disposal) facilities, which reinforce poverty, inequality and vulnerability to human-made and natural disasters.
1.2 vulnerability to climate-related risks in urban
informal settlements
This brings forth the crucial role of adequately planning for urban development. Urban centres need to anticipate and plan for urbanisation arising from rural-urban population shifts, the emergence of employment opportunities in the service sector, and the merging of city boundaries with peri-urban areas. many migrant workers and their families work in the informal economy, facing challenges in terms of inclusion in the city. It is also a challenge to provide basic amenities such as water, shelter and sanitation to existing and immigrant populations with already limited economic and natural resources. This is particularly so when there are additional pressures from climate change impacts. But these basic services play an essential risk-reducing role and contribute to the resilience of the vulnerable and marginalised populations living in informal settlements against natural and human-made calamities.
Urban policy interventions should consider building climate change resilience as a part of an environmental green governance agenda and inclusive urban development. Urban resilience is deined as the capacity of ‘cities to function, so that the people living and working in cities – particularly the poor and vulnerable – survive and thrive no matter what stresses or shocks they encounter’ (Arup, 2014). Thus, to build the resilience of cities and their populations, measures to reduce exposure to hazards and to build adaptive capacity of the residents are required.
1.3 Climate vulnerability and loss and damage
interlinkages
To address the risks posed by climate change, Satterthwaite et al. (2007) emphasise the need to identify pre- and
post-disaster vulnerabilities and prepare for future risks. Data on post-disaster induced-loss and damage can provide estimates of the costs faced by vulnerable groups and households. Such data on loss and damage can also help identify entry points for building climate resilience. Estimations of loss and damage in urban contexts can include impacts on infrastructure facilities such as water, electricity, sanitation and drainage, transport and communication, and services (IIED 2014). Hallegatte et al. (2008) classiies impacts of climate change into two broad categories: the market impacts (asset losses)
and non-market impacts (affecting human health and biodiversity, for example). market impacts are those for which an uncontroversial assessment of monetary value is possible. These impacts can be direct, such as a cost or loss due to physical damage, and indirect, such as loss in production activity, or loss of employment opportunities.
Non-market impacts of climatic effects cannot be easily quantiied in monetary terms due to the dificulties associated with estimating them. For example, when assessing the impact on health, the loss of working days and associated loss in income, plus the cost of medical treatment, may give us an estimate of economic loss to an individual, but valuations of long-term health impacts and quality of life due to ailments are dificult to quantify. Several methods for quantiication of the value of human life – such as value of Statistical Life, vSL; or Disability-Adjusted-Life years, DALys – have been developed but are controversial. Further, it can be hard to quantify the losses faced by those in the informal sector for whom a home may also serve as a place of work and place to store assets – damage to a home can therefore have multiple impacts, both economic and non-economic.
Assessments of climate-induced loss and damage exist to a certain extent in the policies of states in their adaptation, coping and impact assessment plans and reports. However, irrespective of adaptation and coping mechanisms applied, there are likely to be economic and non-economic losses due to climate change (Warner, Huq and Loster., 2012).
1.4 objectives of the study
This study seeks to assess the loss and damage suffered by urban poor residents due to extreme and slow onset climate variability events, and the effects of this loss and damage on their well-being. It conines itself to direct and indirect economic loss and damages due to waterlogging and loods. It does not involve answering the ethical questions of valuation of human life, biodiversity of urban ecosystems, and loss of quality of life due to ill health.
This study has been undertaken to answer some key questions, which will contribute to the understanding of climate-induced loss and damage in rapidly growing urban areas from the perspective of the urban poor. The speciic research questions are:
(i) In what ways do low-income households in Indore experience the effects of loods and waterlogging, with speciic reference to economic losses and household losses; and
(ii) What measures are being taken by low-income households to cope with the loss and damage suffered as a result of loods and waterlogging?
2 Complexity of the urban
context
2.1 Climate vulnerability and the urban poor in India
The urban population in India has increased from 37.8 per cent as per the 2001 Census to 42.6 per cent in 2011 (Government of India Census, 2011). This rapid urbanisation has created challenges in the provision of basic amenities to all urban residents. The employment opportunities for unskilled workers has contributed to the growth of informal settlements as people move to cities for employment, but these settlements are highly exposed to natural and human-made hazards (Parikh et. al., 2014). more than 90 per cent of the populations exposed to loods live in Asia (UN, 2004). The
lack of capacity and resources within government institutions and their policies to address this remain a challenge. The poverty and inequality faced by the urban poor drives their vulnerability to natural hazards.
Satterthwaite et al. (2007) identify three main drivers that can increase vulnerability: (i) urbanisation and urban change,
(ii) weaknesses and incapacities of governments, and (iii) expansion of cities into high-risk areas. Economic and urban development should be ideally framed in policies and governance structures that reduce and remove differentials in risks to loss and damages between high- and low-income populations (Satterthwaite et al. 2007). This implies that a holistic
approach needs to be developed for mapping hazard-prone areas, and developing and implementing land use plans based on such maps. moreover, the working poor in low- and middle-income countries remain excluded from decision making and planning procedures, mainly due to exclusionary policies and procedures (Brown et al, 2014).
Low-income urban residents are usually vulnerable because the informal settlements in which they live lack basic infrastructure (Banerjee, 2002). Their informal tenure situation also restricts their access to housing loans, shelter improvement or compensation for relocation. However, there are cases where informal communities have successfully secured tenure, with the support of civil society and social movements, or through a state-driven approach. The types of land tenure in different cities in India can take various forms: legal tenure; a guarantee to continued occupation; informal assurances from local leaders; regularisation; and declaration as a notiied slum. Ensuring secure tenure can remove one of the underlying drivers of vulnerability which inhibits investment in risk-reducing infrastructure in informal settlements. Unplanned urbanisation and urban development can enhance the vulnerabililty of low-income urban residents to climate-related and human-made hazards in urban areas (Reed et al., 2013; Nasrin, 2013). In their study covering 10 cities across
Asia, Reed et al. (2013) found a clear linkage between waterlogging and poor lood water management to inadequate
systems of solid waste management, sewerage and in-illing lakes and streams. Studies focused on Dhaka city (Alam
et al., 2006; mowla, 2013) reveal that inadequate solid waste disposal services, lack of adequate public water supply
Box 1. Features of urban centres linked to
vulnerability to climate change-induced events
■
■ Concentrated populations due to concentrated labour markets/income-earning opportunities;
■
■ Land markets in which land costs often exclude most or all low-income groups from “oficial” land-for-housing markets;
■
■ Large sections of the population living in housing constructed informally – with no attention to health and safety standards and no regulatory framework to protect tenants;
■
■ High-density populations plus concentrations of their solid and liquid wastes;
■
■ Large, impermeable surfaces which disrupt natural drainage channels and accelerate run-off;
■
■ Patterns of urban form and buildings that do not take current and future hazards into account, which generate increased scales and levels of risk from loods, landslides, ires and industrial accidents; and
■
■ Inadequate planning and poor design generating secondary risks. Source: Adapted from Satterthwaite et al., 2007.
2.2 Indore City
Indore is a densely populated city in western madhya Pradesh: its population of 2,170,000 lives in an area of 526 square kilometres (PRIA, 2014). The Indore metropolitan area has a population of 3,277,000. In part of the city’s centre, the population density is as high as 3,727 persons per square kilometre. Like many other middle-level cities in India, Indore’s population is growing at a rapid rate of four to ive per cent per annum, which is higher than the national growth rate (Taru, 2012). The Census of India records that more than 65 per cent of all statutory towns in the country have squatter settlements or slums, and they form about 18 per cent of the households. of Indore’s 590,000 households, there are 114,000 households living in slums – this is 27 per cent of the population, which is the highest rate in informal settlements in the state of madhya Pradesh (National Informatics Centre, madhya Pradesh, 2016). Almost half (42 per cent) of the slum population of madhya Pradesh live in meagre or dilapidated houses (PRIA, 2014).
Indore is strategically located as a centre for education, healthcare and commercial trade and manufacturing services. It is surrounded by industrial areas, so it attracts a large loating population. Its principal economy is based on trade in cotton textiles, chemicals, machinery, iron and steel, food and edible oil, paper and straw board, pharmaceuticals, machine tools and accessories and educational services. Indore also happens to be the largest city and biggest commercial centre of the state, thus drawing a huge loating population from neighbouring areas for employment. In Indore most of the informal settlements are located on the watercourses of the city (UN-HSP, 2012). The construction of a new underground sewerage system in some parts of the informal settlements have beneitted residents and the rest of the city, but many parts still remain without proper drainage and sewerage systems.
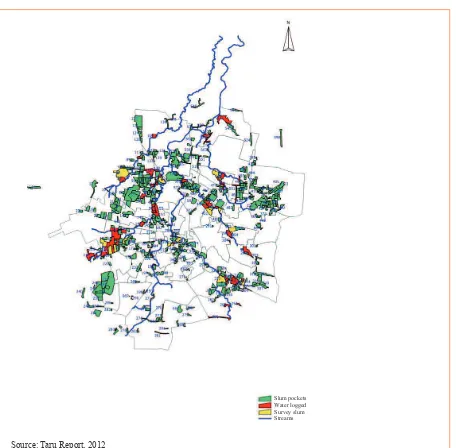
Additionally, solid waste generated in the city is dumped in low-lying areas, inhibiting and clogging storm water drains, which become a breeding ground for mosquitoes, insects and other disease-carrying organisms. As is often the case, these low-lying areas are also the sites of informal settlements. As Figure 1 shows, these settlements are largely in the low-lying river catchment and land prone to waterlogging and loods.
Indore is largely known for its water scarcity and arid climate, but in the past few years the city has faced the dual challenge of water scarcity in summer and waterlogging and looding during extended and unpredictable rainy seasons. This places the communities and households at more risk. Those communities that face loods more frequently are better prepared to cope with such events, having learned from past experience. on the other hand, the communities that have not previously experienced looding or waterlogging often neglect risk reduction measures, and hence may develop higher vulnerability (Kreibich and Thieken, 2009).
Figure 1: map of Indore city showing the slums and
river Khan’s catchment
Slum pockets Water logged Survey slum Streams
3 Estimating economic losses:
exploring approaches
3.1 Role of institutions and policy
The loss and damage arising from climate-induced events and hazards depend not only on physical conditions and the intensity of the disaster, but also on the wide range of institutional arrangements, policies and economic development present. This is demonstrated by the differential impacts of the 2010 earthquakes in Chile and Haiti. The death toll in Chile was 200,000; in Haiti it was less than 1,000. The economic damage to Haiti was as high as 100 per cent of the country’s GDP, but in Chile it was far less (Cavallo and Noy, 2010). The differences in susceptibility to loss and damage from a disaster lies in the resources on risk reduction efforts – including inancial, technical, and legal resources and capacities. Institutional coordination mechanisms play a signiicant role, including for climate-sensitive land use and urban planning and capacity building (Brown, Dayal and Del Rio, 2012; Karanth and Archer, 2014). City-level experiences of climate resilience building initiatives can be mainstreamed in the urban development plans at national level.
3.2 Economic loss and damage estimation
In addition to the inluence of institutional arrangements, the assessment of loss and damage arising from natural hazards provides important information for policy development and adaptation planning to build resilience against weather and climate variability. To understand the costs and beneits of ex-ante risk reduction, it is important to evaluate ex-post coping mechanisms and estimate the actual costs associated with these (Skouias, 2012; Satterthwaite et al., 2007). Therefore, in
Indore, an assessment of loss and damages due to loods and waterlogging is essential. Serious attention to the ‘loss and damage’ agenda grew from the United Nations Framework Convention on Climate Change Conference of Parties at Doha in 2012, which emphasised equity concerns for those who contributed little to climate change but were subjected to the heaviest impacts (morgan and Waskow, 2014).
most economic assessment studies have conventionally focused on lood design methods, including risk-oriented methods. These analyses require lood impact estimations in addition to meteorological, hydrological and hydraulic investigations. However, most have estimated impact through direct economic loss based on damage functions, which relate property damage to damage-causing factors (merz et al., 2004). Flood damage estimations inherently have large uncertainties
since the damage caused is due to various parameters other than water depth, as is done in the damage function analysis. Deining the spatial and temporal limits plays a signiicant role in damage assessment (merz et al., 2010). Additionally, in
the context of assessing lood damage suffered by those living in informal settlements, property damage would usually not be registered or recorded in oficial igures due to the informal nature of housing.
Damage analysis should not only depend upon the spatial scale. The lood damage estimation can be based at the local scale, estimating damage of individual buildings or parcels; and at the aggregate level-through statistical information about population, added values, business statistics or capital assets for land use units. Another challenge faced in economic loss assessments is in the selection of replacement costs or depreciated values (merz et al., 2010; Kousky, 2012). The
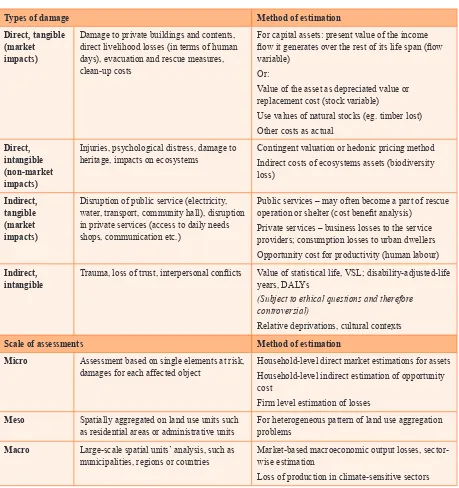
types of damage analysis and the scales relevant to this study are presented in Table 1.
Physical vulnerability to climate change, of both animate beings and inanimate objects, leads to both direct and indirect impacts. The direct impacts can be divided into two categories: tangible impacts and intangible impacts. The direct, tangible impacts are the market impacts, the costs for which can be directly estimated from the market values of the physical assets lost. However, there are still concerns regarding whether to use the replacements costs (ie. the cost required to replace the lost asset) or the depreciated value (the cost at which it would have been sold if it were still there). The direct, intangible losses are those private, public or ecosystem assets which cannot be measured through direct market prices – such as the value of lost cultural heritage, or of the natural regulating role played by ecosystem services. For direct non-market impacts, the methods of contingent valuation (hypothetical market-based analysis) or hedonic pricing values or travel cost principles can be used (Hanley et al., 2006).
The indirect impacts are dificult to measure in physical units and also because indirect losses appear as disruption in the low of services and can appear much later after the natural disaster event has occurred. The indirect impacts can also be tangible (market impacts) and intangible (non-market impacts). The indirect market impacts can be estimated through market-based values such as per unit of service charges, wages or salaries lost. But this can create dificulties when seeking to assess such losses in the informal sector. The indirect-intangible impacts are dificult to estimate because these estimations are subject to value judgements. For example, loss of human life, trauma relating to the death of a relative or discomfort due to a physical injury cannot be quantiied in terms of loss in economic output (merz et al., 2010; ECLAC,
2003; Hallegatte, 2008; Homer-Dixon, 1994).
Table 1. Types and scales of damage (loods, also
Damage to private buildings and contents, direct livelihood losses (in terms of human days), evacuation and rescue measures, clean-up costs
For capital assets: present value of the income low it generates over the rest of its life span (low variable)
or:
value of the asset as depreciated value or replacement cost (stock variable)
Use values of natural stocks (eg. timber lost) other costs as actual
heritage, impacts on ecosystems Contingent valuation or hedonic pricing methodIndirect costs of ecosystems assets (biodiversity loss) in private services (access to daily needs shops, communication etc.)
Public services – may often become a part of rescue operation or shelter (cost beneit analysis)
Private services – business losses to the service providers; consumption losses to urban dwellers opportunity cost for productivity (human labour)
Indirect, intangible
Trauma, loss of trust, interpersonal conlicts value of statistical life, vSL; disability-adjusted-life years, DALys
(Subject to ethical questions and therefore controversial)
Relative deprivations, cultural contexts
Scale of assessments Method of estimation
Micro Assessment based on single elements at risk,
damages for each affected object Household-level direct market estimations for assetsHousehold-level indirect estimation of opportunity cost
Firm level estimation of losses
Meso Spatially aggregated on land use units such
as residential areas or administrative units For heterogeneous pattern of land use aggregation problems
Macro Large-scale spatial units’ analysis, such as
municipalities, regions or countries market-based macroeconomic output losses, sector-wise estimation Loss of production in climate-sensitive sectors Source: Based on merz et al., 2010; ECLAC, 2003; Hallegatte, 2008; Homer-Dixon, 1994; Hanley et al., 2008
Flood and waterlogging damages are assessed differently in different contexts and for speciic purposes. These are required for assessing the vulnerability of households or communities, risk mapping, cost-effective lood mitigation measures, comparative risk analysis, and inancial appraisal for insurance and re-insurance sectors (merz et al., 2010).
3.3 Factors inluencing loss and damage
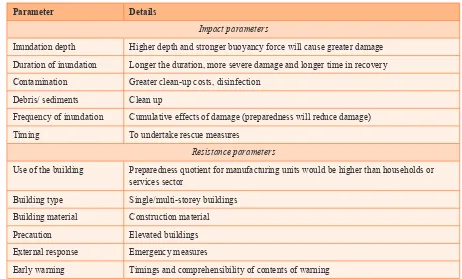
The factors inluencing damage are identiied as impact and resistance parameters, as given by Thieken et al. (2005).
Impact parameters indicate the characteristics of a lood event – for example, the water depth, low velocity and contamination – whereas the resistance parameters specify the capability (or incapability) of an object to resist the lood impact. Resistance parameters can include the size, type and structure of a building. It includes risk mitigation measures, former lood experience and early warning. Important components of impact and resistance parameters that are utilised in this study are presented in Table 2.
Table 2. Components of impact parameters and
resistance parameters
Parameter Details
Impact parameters
Inundation depth Higher depth and stronger buoyancy force will cause greater damage Duration of inundation Longer the duration, more severe damage and longer time in recovery Contamination Greater clean-up costs, disinfection
Debris/ sediments Clean up
Frequency of inundation Cumulative effects of damage (preparedness will reduce damage) Timing To undertake rescue measures
Resistance parameters
Use of the building Preparedness quotient for manufacturing units would be higher than households or services sector
Building type Single/multi-storey buildings Building material Construction material Precaution Elevated buildings External response Emergency measures
Early warning Timings and comprehensibility of contents of warning
Source: Adopted from merz et al., 2010
In addition to identifying and quantifying parameters, assessments have also been based on measuring risks and vulnerability to natural hazards using indicators and indices. There are three global approaches for disaster risk identiication. In one study, Birkmann (2007) juxtaposed these global approaches with one local approach to test the differences in the functions and purposes of assessment. This study compared three basic approaches: (i) disaster risk
index, based on mortality data indicating relative vulnerability; (ii) comprehensive index encompassing disaster deicit index (DDI), local disaster index (LDI), the prevalent vulnerability index (PvI), and risk management index (RmI); and (iii) community-based risk index given in Bollin and Hidajat (2006), which quantiies risks within a community in terms of exposure, vulnerability and management capacities. There are several indexes and parametric estimation methods to estimate vulnerability to natural hazards. The hazards-infrastructure-governance-socioeconomic variables (HIGS) method, given by Parikh et al. (2014), is another comprehensive approach for planners and policy makers. A HIGS framework
3.4 Approach and methodology used
The estimation of loss and damage for urban populations can be undertaken to better indicate the speciic vulnerabilities of local populations to risks from external shocks. This can start with the identiication of vulnerable population through GIS mapping, census data, secondary survey records and key informants. This requires direct interactions with key informants (Sharma, 2013; muller et al., 2011). Such interaction and data collection can help to inform adaptation policies that take
into account the needs of vulnerable urban poor populations, including women, children and apprentices working in the informal sector who may face extreme situations in time of natural disasters (Nwaka, 2005).
In this paper, a case study in Indore was undertaken to estimate the economic losses due to disaster events (loods) and hazards (waterlogging) faced by the vulnerable poor urban populations living in informal settlements. The main objective was to provide for well informed public policymaking by highlighting the impacts of disasters and hazards on often marginalised population groups. In this study we also use the replacement costs (in contrast to the depreciated values) as the loss incurred due to waterlogging, because for poor populations any assets lost have to replaced as soon as possible because they are directly related to everyday survival or livelihoods.
In this study direct monetary loss assessments have been made for every sample household. Direct monetary loss is assessed by aggregating the sum of money incurred in adopting the coping mechanism plus the monetary value (replacement cost) of the items lost and damaged. This is also known as absolute damage approach. The most frequently used procedure for the assessment of direct monetary lood damage comprises three steps: (i) classiication of elements into homogenous classes; (ii) exposure analysis and asset assessment; and (iii) relative damage assessment.
3.5 Analysis and steps in research design
The framework used in this study largely draws from the methodology proposed by Action Aid, along with the Asian Disaster Reduction and Response Network (ADRRN) and the Climate Action Network South Asia (CANSA) merging scientiic data with community knowledge (APN, 2014). To assess the life and livelihood losses and damages for the most vulnerable, this study restricts its scope to the informal settlements and poorest sections of the city of Indore.
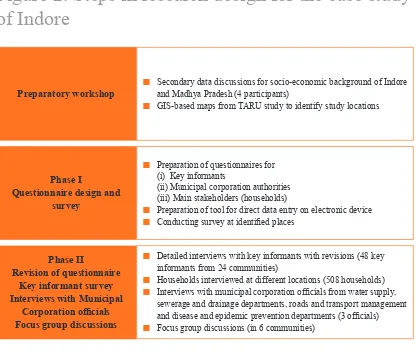
A preparatory workshop of the team members was organised at Indore to understand the secondary data available. The Final Report on the City Resilience Strategy (TARU, 2012) was the basic premise for identifying the concerns of poor
urban populations living in informal settlements. The identiied locations are shown in Figure 1, which also shows that several of the locations were in low-lying and lood-prone watercourses near the river Kahn. The socio-economic characteristics of the populations were also known from the TARU report (2012) based on a survey conducted in 2009. To achieve the main objectives, the analytical framework required three kinds of information. First, the vulnerability of city, which was ascertained through GIS-based maps (TARU, 2012).
Second, this GIS-based information was merged with in-depth understanding of context at the sites of waterlogging and loods. A semi-structured theme-oriented questionnaire was designed and interviews were conducted with 48 key informants and three municipal corporation oficials. This also provided the role of existing (or non-existent) institutional mechanisms. The key informants were identiied based on their association and long-term involvement with the community in that area. The key informants were mainly senior people living in the community, but there were also teachers from local schools, teachers from the community, and young men and women who are active in community issues and know about developments in the area. Two key informants were interviewed from each community across a total of 24 communities.
waterlogging and lood-prone low-lying areas were chosen purposively and then from within every strata the households were selected randomly.
The questionnaires for all three kinds of interviews were revised based on the feedback received from ield surveys and the researchers who conducted interviews with key informants, community leaders and municipal corporation authorities. In Phase II of the survey, the revised questionnaires were canvassed. Subsequently, Focus Group Discussions (FGDs) were conducted in six communities to assess the community level understanding of the role of institutional arrangements, viz., community, government and non-government, with reference to reducing vulnerability to the hazard of waterlogging and loods. The participants included both men and women and were chosen from the groups of households prone to waterlogging and looding more often. The discussions in the community also included participatory resource mapping, which was themed around the availability of infrastructure resources and services required to cope with the disasters.
Figure 2. Steps in research design for the case study
of Indore
Preparatory workshop
■■ Secondary data discussions for socio-economic background of Indore and madhya Pradesh (4 participants)■
■ GIS-based maps from TARU study to identify study locations
■
■ Preparation of tool for direct data entry on electronic device
■
■ Detailed interviews with key informants with revisions (48 key informants from 24 communities)
■
■ Households interviewed at different locations (508 households)
■
■ Interviews with municipal corporation oficials from water supply, sewerage and drainage departments, roads and transport management and disease and epidemic prevention departments (3 oficials)
■
■ Focus group discussions (in 6 communities)
Phase II
waterlogging and/or loods during the past 10 years. The remaining 40 households were selected as a control group; they were from the same 24 communities but had not been affected by either waterlogging or loods because their dwellings were not near watercourses.
(i) City proile, hazard exposure, infrastructure, services, institutions, investment capacity
(ii) Quality of housing, road, transportation (public), electricity, drainage, sewerage, location in the city/distance from city centre, health centre/ hospital/private clinic, public/private/government school, broad income classes, employment type, migration status, existence of informal and formal production and sales activities
(i) Does local government consider climate risk as important? Is waterlogging and climate variation a part of its planning?
(ii) Community dynamics, livelihoods dependence on external and internal factors and linkages, livelihoods dependence on local/public/private resources (natural and man-made capital), ownership and areas
(iii) Is there any perceived change in seasonal calendar, observations from past 10 years
(iv) vulnerability matrix and assessment: hazard intensity, duration, livelihood vulnerability, coping strategy, constraints in adopting new technology or mechanism
Socio-economic proile of households
(Household questionnaire)
(i) Demographic age, gender, health, education (ii) Quality of housing, location, roof, loor
(iii) Household assets: mobile, radio, Tv, fridge, mixer grinder, etc.
(iv) occupation assets: cart, cycle, motorised vehicle, machine, equipment, auto rickshaw
(v) Quality of service provision to the household due to external factors and internal factors, electricity, drainage, seepage, commercial shop, ration shop, fuel kerosene/LPG availability
(vi) vulnerability assessment: loss of life/livelihood/working days/human days family labour, paid labour, erosion of assets, medical expenditure, non-climatic drivers for vulnerability
Impact of waterlogging and loods (Household questionnaire - part B)
(i) Waterlogging: frequency, duration, inundation levels, when/season Floods: frequency, duration, inundation levels, when/season (ii) occupation impacts: site related (for construction workers/casual
labourers), procurement roadblocks (for small businesses raw material etc.), distribution roadblocks (sale activity), informal employment affected by rains/waterlogging/loods, house maids
4 Empirical results
4.1 Socio-economic and risk proile of communities
Among the waterlogging-prone communities selected for the investigation, more than 50 per cent of households were categorised as slums in seven of those communities. This was according to information gained from key informants interviewed from registered slum locations. The registered slums have secure land tenure, but they have high population densities and poor basic amenities, including electricity supply, water supply, sewerage and drainage systems. more than half the houses in these communities were single storey, and more than 50 per cent of their population were illiterate. more than 50 per cent of the roads in these communities were kutcha roads, which are not laid with concrete/bricks/ stones and get washed away with rains/loods. Further more, more than half the households had no private or government healthcare facility in the vicinity.
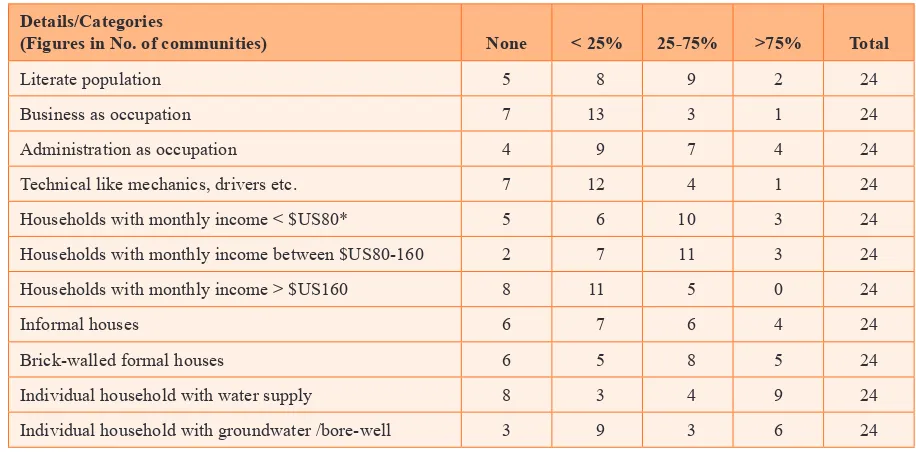
Table 4 provides details of the demographic, occupational structure, household income/economic group types, community groups and self-help groups and infrastructure facilities of the surveyed settlements/communities. more than 65 per cent of the settlements surveyed had at least a private health clinic, but 77 per cent of the community respondents felt that the clinics either did not or were not able to provide support during the lood event. All communities had a primary school, while 93 per cent had a secondary school — these schools would remain closed during loods but not during other waterlogging days.
Table 4. Socio-economic proile of the sample
communities
Details/Categories
(Figures in No. of communities) None < 25% 25-75% >75% Total
Literate population 5 8 9 2 24
Business as occupation 7 13 3 1 24 Administration as occupation 4 9 7 4 24 Technical like mechanics, drivers etc. 7 12 4 1 24 Households with monthly income < $US80* 5 6 10 3 24 Households with monthly income between $US80-160 2 7 11 3 24 Households with monthly income > $US160 8 11 5 0 24
Informal houses 6 7 6 4 24
Brick-walled formal houses 6 5 8 5 24 Individual household with water supply 8 3 4 9 24 Individual household with groundwater /bore-well 3 9 3 6 24 * Currency Conversion rate 1 USD =67.15 INR
4.2 Households’ income, assets and infrastructure
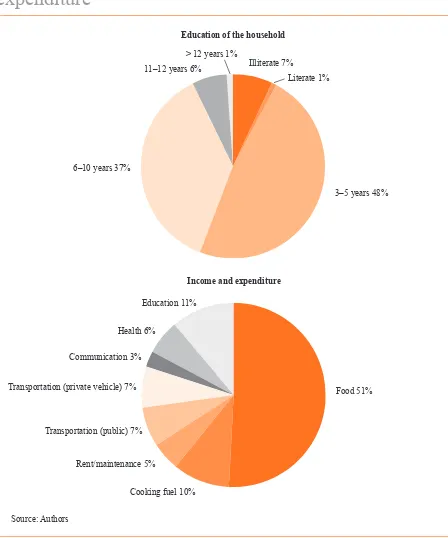
The household survey was conducted for a sample of 508 households. Due to one household not completing the survey, the set of descriptive analysis presented here refers to 507 households. The average household size is 5.29, the sample population is equal to 2,689 persons and the gender ratio is 908 women to 1,000 men. The sample population demographics also indicate a clear gender bias, with only 13.5 per cent of women being in paid employment. In terms of age breakdown, 32.5 per cent were under 17 years of age, 63 per cent were aged between 17-60 years and 4.5 per cent were older than 60. of the total sample population, more than 55 per cent had less than three years of formal schooling (Figure 3).
Figure 3. Education status and average share in monthly
expenditure
Source: Authors
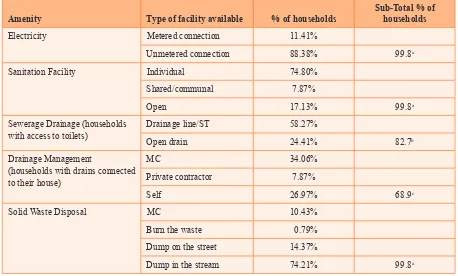
About 80 per cent of the households lived in small cement houses with an average loor area of 450 square feet. Access to basic amenities including electricity, sanitation, sewerage systems, drainage management and solid waste disposal are presented in Table 5. The table reveals that only 11.41 per cent of households have metered electricity connections (registered under power supply corporation). The average monthly electricity bill is about $US10.36. For unmetered connections the payment is made at a ixed rate based on possession of a refrigerator, Tv, food processor, and the number of fans and light bulbs. Three-quarters of the sample households had individual toilets at home, but only 58.27 per cent of these homes had toilets connected to a proper sewerage system. The remaining 24.41 per cent of households with
Income and expenditure
Food 51%
Cooking fuel 10% Rent/maintenance 5%
Transportation (public) 7% Transportation (private vehicle) 7%
Communication 3% Health 6%
Education 11%
Education of the household
Illiterate 7%
Literate 1%
3–5 years 48% 6–10 years 37%
11–12 years 6%
individual toilets released their sewerage into open drains, whilst 17.13 per cent of households still defecate in the open. Just 34.06 per cent of households could connect their wastewater drainage to the municipal corporation’s drainage lines and only 10.43 per cent of households were connected to the municipal corporation’s solid waste disposal system.
Table 5. Basic amenities of the sample households
Amenity Type of facility available % of households Sub-Total % of households
Electricity metered connection 11.41%
with access to toilets) Drainage line/STopen drain 58.27%24.41% 82.7b
Drainage management
Dump in the stream 74.21% 99.8a a 0.2% households did not want to respond to this question
b this total covers only the 82.7% of households which had access to toilets (individual or shared)
c this total covers only the proportion of households with drains connected to their houses
4.3 Impact of waterlogging and loods
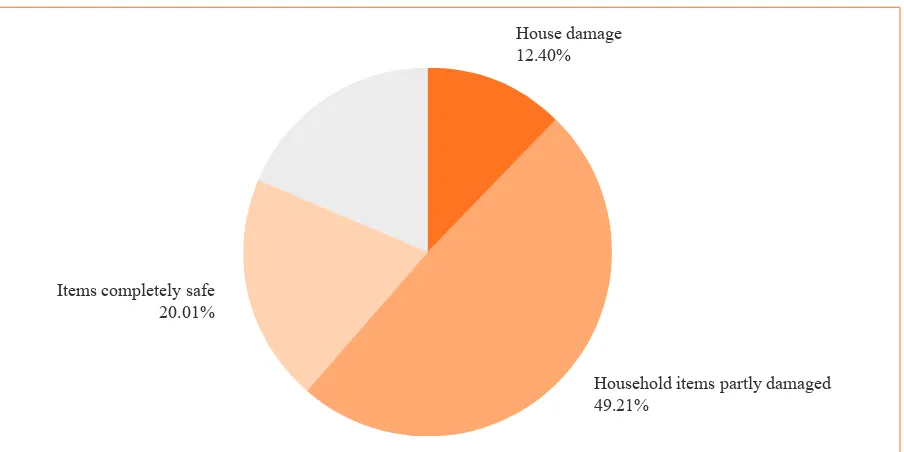
Figure 4. Damage due to waterlogging on house and
household items
House damage 12.40%
Items completely safe 20.01%
Household items partly damaged 49.21%
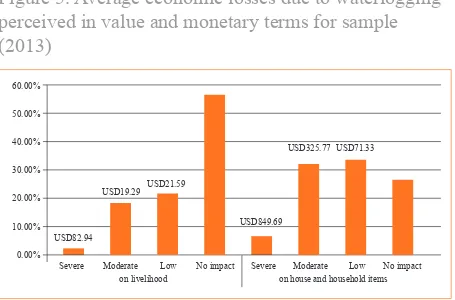
From the damage reported in Figure 4, the loss in monetary and value terms was estimated by each household. They were asked to rate the damage to their household and loss of livelihoods according to whether they thought it had a low, moderate, severe or no impact. Based on the quantity and quality of assets lost and the number of working days lost, the monetary values of these losses was estimated (see Figure 5). Few households (2.36 per cent) reported to have incurred business losses, which were on average $US63 during 2013.
In terms of disease occurrence in households during the rainy season, 37.5 per cent of households reported at least one member had fallen ill during the years when the loods and/or waterlogging was experienced (see Table 6). The total economic losses for the entire sample – due to loss of livelihood days, house and household items, business assets and medical costs – was estimated to be $US106,932.60 for one year (Table 7). The losses are estimated for the speciic rainy season in which the household suffered the loss. The average losses incurred by sample households due to (i) loss of livelihood ($US82.94 as severe and $US21.59 as low), and (ii) damages to house and household items ($US849.69 as severe and $US71.33 as low). The average losses are illustrated in Figure 5.
Table 6. Incidence of disease occurrence during the
rainy season (2013)
Particulars Disease occurrence
Diseases Fever (50%), malaria (24.80%), cough (19.88%), diarrhoea (11.22%), dengue (6.1%), cold (4.53%), typhoid (0.98%), chikungunya (0.6%), jaundice (0.39%)
Duration of occurrence July to September (37.40% households reported illnesses) No. of persons fallen ill members in household (22.69%)
Table 7. Total economic losses due to waterlogging
perceived in value and monetary terms for sample
(2013)
Type of loss Amount in USD
Livelihood 5,324.16
Household assets 9,6211.40
Business assets 1,269.79
medical costs 4,127.27
Total 106,932.60
* Currency conversion rate 1 USD = 67.15 INR
Figure 5. Average economic losses due to waterlogging
perceived in value and monetary terms for sample
(2013)
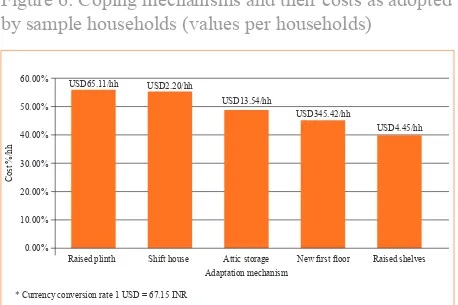
Waterlogging and loods have been more common since the year 2000 in Indore, so the population is expected to prepare before the rainy season to reduce losses where possible. As a consequence, households have adopted various kinds of coping mechanisms (see Figure 6), some of them multiple. For example, about 55 per cent of households have raised the plinth in the front of their house to prevent inundation, and similarly 55 per cent of households have chosen to shift to another house. Fewer households have opted for construction of a new irst loor, probably because it is the most expensive coping mechanism ($US345.42 per household). Shifting house has, on average, been a cheaper option since most of the households shift from rented/owned house to a rented house.
USD19.29 USD21.59
USD849.69
USD325.77 USD71.33 60.00%
50.00%
40.00%
30.00%
20.00%
10.00%
0.00%
In addition to seeking perceived and economic losses, this study also explored the understanding and willingness of households to receive and contribute to resilience building and adaptation. It found that institutional support was sought in the forms of access to credit, easy insurance, livelihood support, provisioning of clean water during the rainy season, clean drainage to prevent diseases and discomfort, medical support, temporary shelter, access to information in advance, and food and other daily needs. The households were also asked how willing they were to contribute to resilience building (see Figure 7). This exercise was designed to evaluate their willingness to pay for resilience building, but because most of the surveyed households belonged to poor or very poor categories, their willingness to pay was modiied to willingness to contribute. Such contributions would include labour, skilled labour, food or essential requirements in kind instead of cash.
Figure 6: Coping mechanisms and their costs as adopted
by sample households (values per households)
60.00%
50.00%
40.00%
30.00%
20.00%
10.00%
0.00%
Raised plinth Shift house Attic storage New irst loor Raised shelves Adaptation mechanism
USD65.11/hh USD2.20/hh
USD13.54/hh
USD345.42/hh
USD4.45/hh
Cos
t %/
hh
Figure 7. Willingness to contribute towards
resilience building
Labour 13%
Food 47%
Cash 25% Trained help 15%
4.4 Role of municipal corporations (local
governments)
The District Disaster management Plan (DDmP) Indore is prepared as stipulated under the Disaster management Act 2005. Its primary aim is to mitigate and manage disasters. The DDmP document principally covers institutional arrangements, hazard vulnerability, risk and capacity analysis, and district-level disaster management planning. The institutional arrangements for disaster management include district-level disaster management committees and block-level disaster management committees. The plan includes preparedness for both climatic and human-made hazards.
As part of the study, three oficials of the municipal Corporation were interviewed: the principal chief engineer directly working for the municipal commissioner, the city engineer, and the chief medical and health oficer. The oficials said they were aware of the mandates and provisions under the DDmP, but due to a paucity of funds/budgetary allocations and human resources, they follow the ‘response plans’ as listed under the DDmP and are unable to be proactive. For some areas of the city, the preparation for storm water diversion and clearances is based on frequency, experience and vulnerability, and undertaken in the regular ‘Service Level Benchmarking System of the municipal Corporation’. This stipulates that the civil, electrical and maintenance works are undertaken and reported every year before monsoon season. In terms of preventing the spread of disease, measures such as pest control, insecticidal spray and garbage clearance from areas prone to malaria, jaundice, dengue and so on are taken by the medical and public health department of the municipal Corporation based on reports from communities, non-government organisations and hospitals.
Historically, Indore city has been vulnerable to loods, drought, hailstorms and human-made disasters such as road accidents and industrial hazards. Within the DDmP document, mandated action plans include:
(i) risk mitigation: training and community initiatives;
(ii) preparedness plan: evacuation preparedness and mock drills;
(iii) response plan: management of shelter, communication, transport, electricity, law and order, medical, relief and ire services; and
The DDmP plan also has a provision for creating a District Disaster Response Fund and a District Disaster mitigation Fund. The coordination mechanism outlined in the DDmP includes mapping of stakeholders in Indore District from public/private/non-governmental organisations, religious institutions, academic institutions and international humanitarian organisations. The plan also outlines how to disseminate the plan.
Recently the state government published an order (madhya Pradesh Revenue Department, 2015) on the compensation amounts available for different kinds of disasters (see Table 8). The compensation is for damage of house/dwelling.
Table 8. Revised compensation packages for victims of
natural disasters (from State Government)
Particulars compensation in USDAmount of
Revised amount of compensation in USD
(new order)
5 Conclusions
This impact assessment focused on direct economic losses arising from loods in Indore. Informal settlement populations were purposively chosen, in particular those located in low-lying areas subject to water logging and loods without access to services and infrastructure which can play risk reducing roles. This absence of availability and access to urban infrastructure and services renders the slum populations vulnerable in the case of natural or man-made calamities, with knock on impacts on the city’s economy, due to the important role the informal settlers play in the city as labour and in providing services.
This study is based on the identiication of factors causing damage and the factors which are impacted. The community and household ield questionnaires included impact factors and coping (or resistance) factors. The impact factors included inundation depth, duration, contamination, incidence of diseases (both water borne and vector borne). The results are based only on descriptive analysis, but further analysis can be undertaken to analyse the relationship between these impact factors and the living and physical conditions of the settlements, and estimate the signiicance and impact coeficients in future. The economic loss and damage estimation in this study included loss to house, household items, business structure, business assets, human days lost in terms of livelihood days, human days lost due to morbidity/illness caused by waterlogging and lood situations, cost of seeking medical advice, hospitalisation and medicines. The total overall losses incurred by the sample households reached $US106,932.60 for the total sample population for one year when the calamity occurred. For a sample population of 508 families, this loss is signiicant in terms of their relative income and assets to losses ratio.
The coping or resistance parameters include type of building (indicates preparedness quotient of the structure), precautions taken, external responses and early warning. The resistance parameters indicate the coping strategy of the households at individual and community level and it also includes building resilience to climatic or non-climatic disasters. The study analysed the resistance factors by identifying the type of building, number of loors in the building, and costs incurred in preparing/ coping with the disaster, including construction of a raised plinth, shifting to another place, creating more attic storage, construction of a new loor, or more shelves. The total cost estimated to have been incurred to prepare/cope/ adapt to the waterlogging and/or lood situation for the entire sample of households is $US109,936.42. This estimated igure is close to the total losses reported, indicating the sample households are already spending similar amounts as a coping mechanism.
The municipal corporations in India, in general, and in Indore, in particular, are in a better position since 2009, in terms of building resilience, creating effective response plans, and coordinating stakeholders, communities and institutions. This is due to the enactment of the 74th amendment of the constitution in 1992, which empowers municipal governance
and independent decision making (Parikh et al., 2014). However, building climate resilience as an agenda does not
igure in the municipal corporations’ list of priorities, since their immediate concerns include basic urban infrastructure, transportation, roads, water supply, sewerage, drainage and solid waste disposal. But such improvements would contribute to the resilience of local populations, if planned and implemented with climate projections in mind. The municipal corporation and the associated authorities can be sensitised towards the importance of understanding exposure to natural hazards, vulnerability of urban areas and their capacity to adapt. The statistics presented for the sample population clearly indicate that these households are devoid of basic amenities including clean water supply, appropriate drainage, sewerage systems and solid waste disposal. Households reported they had been severely impacted during lood and waterlogging events because solid waste and waste water released in open drains enters their houses. This means their only choice is to evacuate their homes. Even after the rainy season is over the waterlogging continues on streets, leading to accidents and providing breeding grounds for mosquitoes and other disease-carrying insects.
The datasets included in this study might underestimate the indirect losses, given that the non-market impacts or costs to the informal economy are dificult to identify and estimate. Damages across households are also not borne equally, since low-income households have less capacity to absorb the shocks and impacts of hazards. The indirect losses in terms of illnesses have been dramatically high during the rainy and waterlogging periods. The study limits itself only to the estimation of economic losses in terms of damage to houses, household items, medical costs related to illness, loss of livelihood/human days due to illness or inaccessibility, and so on. The losses in terms of lost education, lost opportunities, death, and so on are not included as they require value judgements. The loss of living quality to children, women and the elderly during heavy rains and loods is not quantiied in this report.
The lack of any institutional mechanism to cope with waterlogging and lood situations is evident from the results, but the meagre amounts of compensation, food, water and temporary shelter received from the municipal corporation, nevertheless, helps. However, the distress due to inadequate sewerage, drainage, water, electricity and other amenities continues to mar the life of the inhabitants of informal settlements. The modern townships constructed (with permission from the municipal authorities) block and divert the lood and storm waters towards the slums located on these
watercourses, which implies that better infrastructure is accessible to those who have better economic and social
References
Alam, md. J.B., Alam, m.J.B., Rahman, m.H., Khan, S.K. and munna, G.m. (2006) Unplanned urbanization: Assessment through calculation of environmental degradation index. International Journal of Environmental Science and Technology,
vol. 3, No. 2, Spring 2006, pp.119-130.
Arup (2014) City Resilience Framework. Accessible at:
https://www.rockefellerfoundation.org/app/uploads/City-Resilience-Framework1.pdf
Asia-Paciic Network for Global Change Research (APN). (2014). Developing and Promoting a People-centred Approach to Assess and Address Impacts of Climate Change Induced loss and damage. Retrieved from http://www.apn-gcr.org/
resources/items/show/1978
Banerjee, B. (2002). Security of tenure in Indian cities. In: Holding their ground: Secure land tenure for the urban poor in developing countries, A. Durand-Lasserve and L. Royston (Editors). Earthscan Publications Ltd.: London.
Birkmann, J. (2007) Risk and vulnerability indicators at different scales: Applicability, usefulness and policy implications.
Environmental Hazards, vol. 7, 20-31.
Bollin, C., and R. Hidajat (2006). Community-based disaster risk index: pilot implementation in Indonesia. In: Birkman, J., (Ed.) measuring vulnerability to natural hazards- Towards disaster resilient societies. UNU-Press: Tokyo.
Brown, A., Dayal, A., and C.R. Del Rio. (2012). From practice to theory: emerging lessons from Asia for building urban climate change resilience. Environment and Urbanization. vol. 24, No. 2: 531-556.
Buchele, B., Kreibich, H., Kron, A., Thieken, A., Ihringer, J., oberle,P., merz., Z. and F. Nestmann (2006). Flood -risk mapping: contributions towards an enhanced assessemnt of extreme events and associated risks. Natural Hazards and Earth System Sciences, vol. 6, 485-503.
Cavallo, E. and I.Noy. (2010). The Economics of Natural Disasters. IDB Working Paper Series, No. IDB-WP-124,
1-49 pp.
Chakrabarti, P.G. D. (2001). Delhi’s ongoing debate on informal settlements and work places: Some issues of
environmental jurisprudence. International workshop on ‘Coping with informality and illegality in human settlements in developing cities’, held at Leuven and Brussels, Belgium, during may 23-26, 2001.
Chen, P., Zhang, J., Zhang, L., and y. Sun (2014). Evaluation of resident evacuations in urban rainstorm waterlogging disasters based on scenario simulation: Daoli district (Harbin, China) as an example. International Journal of Environmental Research and Public Health, vol. 11, 9964-9980.
Danh, v.T. (2014). Household economic losses of urban looding: Case study of Can Tho City, vietnam. Asian Cities Climate Resilience Working Paper Series vol 12, 40p.
Datt, R. (2007). Unorganized sector and informalization of the Indian economy. Indian Journal of Labour Economics, vol.
50, No. 4, pp. 775-792.
District Disaster management Plan Indore, prepared by: SEEDS Technical Services, District Administration Indore, School of Good Governance & Policy Analysis, Government of madhya Pradesh, Bhopal.
Durand-Lasserve, A. (2006) Informal Settlements and the millenniumDevelopment Goals: Global Policy Debates on Property ownership and Security of Tenure. Global Urban Development Magazine, vol. 2 (1) Accessible at :http://www.
globalurban.org/GUDmag06vol2Iss1/Durand-Lasserve.htm
ECLAC (Economic Commission for Latin America and the Caribbean) (2003). Handbook for estimating the socio-economic and environmental effects of disasters. UN, ECLAC and World Bank.
Goldar, B. and S.C. Aggarwal (2012) Informalization of Industrial Labour in India: Effects of labour market rigidities and import competition, Developing Economies, 50 (2): 141-169.
Government of India, Census (2011).Population Enumeration Data. Accessible at: http://www.censusindia.gov. in/2011census/population_enumeration.html
Hallegatte, S., Henriet, F., and J. Corfee-morlot. (2008). The economics of climate change impacts and policy beneits at city scale: A conceptual framework,” OECD Environment Working Papers, No.4, oECD Publishing
Hanley, N., Shogren, F.J., and B. White (2006) Environmental economics: In theory & practice. Second Edition. Palgrave
macmillan Publishers.
Homer-Dixon, T.F. (1994). Environmental Scarcities and violent Conlict: Evidence from Cases. International Security,
vol. 19, No. 1: 5-40.
IIED (2014) Towards an urban agenda on climate-related loss and damage. Asian Cities Climate Resilience: Policy Brief 2014. Accessible at: http://pubs.iied.org/pdfs/10718IIED.pdf
ImD Indian meteorological Department, (several years) Station-wise Rainfall Data. Government of India, accessible for recent years on data CDs.
Karanth, A., and D. Archer. (2014) 2014) Institutionalising mechanisms forbuilding urban climate resilience: experiences from India, Development in Practice, 24:4,514-526, DoI: 10.1080/09614524.2014.911246
Kousky, C. (2012). Informing climate adaptation: A review of economic costs of natural disasters, their determinants, and risk reduction options. Resources for Future Discussion Paper (RFF DP), vol. 12 (28), 1-62.
Kreibich, H., and A.H. Thieken, (2009). Coping with loods in the city of Dresden, Germany. Natural Hazards, vol. 51 (3),
423-436.
madhya Pradesh Revenue Department (2015). order No. F 6-6/2012/Seven-3, from Revenue Guidelines Booklet Section vI, No.4 Amendment. Issued on February 16, 2015, by Chief Secretary, Revenue Department, Government of madhya Pradesh.
mehrotra, S., Gandhi, A., Saha, P., and B.K. Sahoo (2012). Joblessness and Informalization: Challenges to Inclusive growth in India. IAMR Occasional Paper No. 9/2012. Institute of Applied manpower Research, Planning Commission,
Government of India, New Delhi.
merz, B., Kreibich, H., Thieken, A., and R. Schmidtke (2004). Estimation uncertainty of direct monetary lood damage to buildings. Natural Hazards and Earth System Sciences, vol.4, 153-163.
merz., B., Kreibich, H., Schwarze, R. and A. Thieken (2010). Review Article: Assessment of economic lood damage. . Natural Hazards and Earth System Sciences, vol.10, 1697-1724. www.nat--hazards-earth-syst-sci.net/10/1697/2010/
doi:10.5194/nhess- 10- 1697-2010
morgan, J. and D. Waskow. (2014). A new look at climate equity in the UNFCC, Climate Policy, vol. 14, No. 1 : 17-22,
doi: 10.1080/14693062.2014.848096096
mowla, Q.A. & Islam, m.S. 2013 Natural Drainage System and Water Logging in Dhaka measures to address the Problems, in the Journal of Bangladesh Institute of Planners, vol. 6, December 2013, pp. 23-33 _ Qazimowla - Academia. edu.htm
muller, A., Reiter, J. and U. Weiland. (2011). Assessment of urban vulnerability towards loods using an indicator-based approach- A case study for Santiago de Chile. Natural Hazards and Earth System Sciences. vol.11, 2107-2123.
Nasreen, m. (2013) Flood-Induced vulnerabilities and problems encountered by women in Northern Bangladesh.
International Journal of Risk Science, 4 (4): 190-199 doi: 10.1007/s13753-013-0020-z
National Informatics Centre (NIC) madhya Pradesh (2016) District Guideline. Accessible at: http://indore.nic.in/ Guideline/Teh_Indore.pdf
Nwaka, G.I. (2005) The urban informal sector in Nigeria: Towards economic development, environmental health, and social harmony. Global Urban Development, vol.1, Iss.1 : 1-11.
Parikh, J., Sandal, G. and P. Jindal (2014). vulnerability proiling of cities: A framework for climate-resilient urban development in India. Asian Cities Climate Resilience Working Paper Series vol 8, 38p.
PRIA (Society for Participatory Research in Asia) (2014) Indore & Bhopal Study Report. In: Government led exclusion of the urban poor: A greater contributor though a lesser recipient. pp.20. Available at: http://www.pria.org/pdf/Urban_Poor_ Economic_Contribution_Final_Report.pdf
Reed, S. o., Friend, R., Toan, v. C., Thinphanga, P., Sutarto, R., & Singh, D. (2013). “Shared learning” for building urban climate resilience: Experiences from Asian cities. Environment and Urbanization, 25(2), 393-412. doi:
10.1177/0956247813501136
Roy, A. (2009). Why India cannot plan its cities: Informality, insurgence and the idiom of urbanization. Planning Theory,
vol. 8, No. 1: 76-87
Satterthwaite, D., Huq, S., Pelling, m., Reid, H. and P.R. Lankao. (2007). Adapting to climate change in Urban Areas: The possibilities and constraints in low- and middle-income nations. Human Settlements Discussion Paper Series, Theme: Climate change and cities-1. IIED: London.
Sharma, D., Singh, R., and R. Singh. (2013) Urban Climate Resilience: A review of the methodologies adopted under the ACCCRN initiative in Indian cities. Asian Cities Climate Resilience Working paper Series 5.
Skouias, E. (2012) The poverty and welfare impacts of climate change: Quantifying the effects, identifying the adaptation strategies. The World Bank doi:10.1596/978-0-8213-9611-7
Taru Indore City Resilience Strategy Team (2012).Final report on city resilience strategy, Indore. (Eds.) Bhat, G.K., Kulshreshtha, v.P., Bhonde, U.A., Rajasekar, U. Karanth, A.K., Burvey, m.K. 60p.
Thieken, A.H., muller, m., Kreibich, H., and B. merz. (2005). Flood damage and inluencing factors: New insights from August 2002 lood in Germany. Water Resources Research, vol. 41 (2), 1817-1821.
UN. 2004. Guidelines for Reducing Flood Losses. UN Department of Economic and Social Affairs (DESA), UN Inter-Agency Secretariat of the International Strategy for Disaster Reduction (UN ISDR), and National oceanic and Atmosphere Administration (USA NoAA). Geneva: United Nations.
United Nations Human Settlements Programme (UN-HSP) (2012) The Challenge of Slums: Global Report on Human Settlements 2003, Chapter : Towards inclusive cities: reconsidering development priorities.” Routledge, p: 167. United Nations, Economic Commission for Latin America and the Caribbean (ECLAC) and International Bank for Reconstruction and Development (The World Bank). (2003). Handbook for estimating the socio-economic and environmental effects of disasters: 1-357 pp.
Appendix I: Photographs from
ield survey and FGD
Photograph 2: many live close to open drains prone to waterlogging and loods
FGD photograph 1: PRA-based map of vulnerability to loods and waterlogging
FGD Photograph 2: Losses incurred due to loods
Asian Cities Climate Resilience Working Paper Series
This working paper series aims to present research outputs around the common theme of urban climate resilience in Asia. It serves as a forum for dialogue and to encourage strong intellectual debate over concepts relating to urban resilience, results from the ground, and future directions. The series is also intended to encourage the development of local research capacity and to ensure local ownership of outputs. The series has arisen out of the Asian Cities Climate Change Resilience Network
(ACCCRN, www.acccrn.org), an initiative funded by the Rockefeller Foundation.
The series is intended to present research in a preliminary form for feedback and discussion. Readers are encouraged to provide comments to the authors whose contact details are included in each publication. Published by IIED June, 2016
IIED order no: 10789IIED http://pubs.iied.org/10789IIED.html ISBN 978-1-78431-367-8
80-86 Gray’s Inn Road, London WC1X 8NH, UK Tel: +44 (0)20 3463 7399