Full Terms & Conditions of access and use can be found at
http://www.tandfonline.com/action/journalInformation?journalCode=vjeb20
Download by: [Universitas Maritim Raja Ali Haji] Date: 11 January 2016, At: 20:56
Journal of Education for Business
ISSN: 0883-2323 (Print) 1940-3356 (Online) Journal homepage: http://www.tandfonline.com/loi/vjeb20
Accounting Student Characteristics From
2005–2010 Archival Transcript Data
Annhenrie Campbell , Freddie Choo , David H. Lindsay & Kim B. Tan
To cite this article: Annhenrie Campbell , Freddie Choo , David H. Lindsay & Kim B. Tan (2013) Accounting Student Characteristics From 2005–2010 Archival Transcript Data, Journal of Education for Business, 88:2, 70-75, DOI: 10.1080/08832323.2011.641610
To link to this article: http://dx.doi.org/10.1080/08832323.2011.641610
Published online: 04 Dec 2012.
Submit your article to this journal
Article views: 123
View related articles
CopyrightC Taylor & Francis Group, LLC ISSN: 0883-2323 print / 1940-3356 online DOI: 10.1080/08832323.2011.641610
Accounting Student Characteristics From 2005–2010
Archival Transcript Data
Annhenrie Campbell
California State University Stanislaus, Turlock, California, USA
Freddie Choo
San Francisco State University, San Francisco, California, USA
David H. Lindsay and Kim B. Tan
California State University Stanislaus, Turlock, California, USA
Prior studies have investigated the characteristics of accounting students using survey data. The authors use archival transcript data to investigate some characteristics of accounting students at one institution, such as trend in graduation rates, distribution of male versus female students, and distribution of transfer versus native students. The authors found the grade from the first intermediate accounting class to be a reliable predictor of accounting student success at graduation. Gender and transfer status were not found to be strong predictors.
Keywords: accounting education, GPA, intermediate accounting, transfers
The business press suggests that demand for accountants can be expected to remain high. Ali Velshi (2011) reported that, according to the Bureau of Labor Statistics, accounting jobs would grow 22% between 2008 and 2018 as more ac-countants are needed to keep track of international trade in a global environment. Velshi stated that “globally attractive jobs such as public accounting require four-year degree, then an advanced degree or CPA (certified public accountant) des-ignation, which takes years” (p. 42). Accounting educators and researchers have been examining the quality of account-ing education and the students it attracts for some time.
Accounting education, in fact, has been going through some turbulent times. In 1989, the Accounting Education Change Commission called for improvements in account-ing education. Accountaccount-ing education should have a broader focus on general education and business organization knowl-edge; more decision making, problem solving, communica-tion and interpersonal skills, and greater use of technology (Accounting Education Change Commission, 1990; Boyd,
Correspondence should be addressed to Kim B. Tan, California State University Stanislaus, College of Business, Department of Accounting & Finance, One University Circle, Turlock, CA 95382, USA. E-mail: KTan@ csustan.edu
Boyd, & Boyd, 2000). In 1990, the American Institute of Certified Public Accountants (AICPA) endorsed a move to-ward a 150-hr AICPA member requirement (Boyd et al.). Many professional organizations such as the AICPA, the Na-tional Association of State Boards of Accountancy, and the Federation of Schools of Accountancy (FSA) have expressed their support of the 150-hr requirement. Legislation has made the 150-hr education effective in most American states for li-censing; currently, the Uniform Accountancy Act (2011), the model for state-by-state legislation, requires 150 hr of col-lege education in order to sit for the uniform Certified Public Accountant (CPA) examination. In 2000, four major groups (i.e., the Institute of Management Accountants, the AICPA, the American Accounting Association, and the then Big 5 ac-counting professional service firms) cosponsored a study on accounting education by Albrecht and Sack (2000). Albrecht and Sack predicted that accounting education would face a grim future as fewer and less qualified students would choose accounting as a major. Business students could choose other attractive business majors, and it was feared that there would be a decline in accounting majors and first-time CPA exam candidates (Abels, 2004; Schroeder & Franz, 2004). The 150-hr requirement also resulted in changes in the account-ing curriculum (Hurt, 2007; Lin & Hunter, 1992) at a time when accounting programs are challenged by a general
ACCOUNTING STUDENT CHARACTERISTICS 71
shortage of accounting PhDs (Danko-McGhee, Duke, & Franz, 1992; Lin & Hunter; Sharman, 2007), by a lack of suitable textbooks or reading materials (Lin & Hunter), and by the continuing expansion of new accounting knowledge.
Unlike the grim predictions by Albrecht and Sack (2000) and other accounting researchers, Nelson and Vendrzyk (1996); Nelson, Vendrzyk, Quirin, and Allen (2002); and Nelson, Vendrzyk, Quirin, and Kovar (2008) examined the trend in accounting student characteristics using survey data from the FSA and concluded that student quality appears to be continuing to increase and interest in careers in public ac-counting such as high; according to Nelson et al. (2008), “it would appear that accounting is still attracting good stu-dents” (p. 385) and “clearly, with the implementation of Sarbanes-Oxley (SOX, 2002), the job market for accoun-tants has been very good in recent years” (p. 386). Since these researchers (Nelson & Vendrzyk; Nelson et al., 2002; Nelson et al., 2008) examined accounting student character-istics using survey data, Nelson et al. (2008) acknowledged that there are limitations with survey data and they called for additional research using, for example, nonsurvey data such as archival data. Given the continuing changes in accounting education, there is a need to understand the characteristics of accounting students in general and to understand which stu-dents are most likely to succeed. We answer their call for fur-ther research by using archival data to understand accounting student characteristics. We used five years (2005–2010) of archival undergraduate alumni transcript data collected from a medium-sized Association to Advance Collegiate Schools of Business (AACSB)–accredited public university. Strictly speaking, only the grade information in the archival data is objectively determined as students themselves report age, gender, and ethnicity. We did anticipate there would be some variability regarding the reporting of ethnicity but would have been surprised if self-reported age and gender were as subject to bias as self-reported grades. Our study provides further in-sights to the nature of the accounting student characteristics as accounting education undergoes changes in response to the 150-hr education requirement.
SAMPLE CHARACTERISTICS
Growth
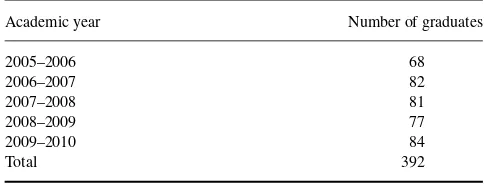
This study was undertaken at one of the several campuses of a large, state university system. Any admitted student with the required prerequisites may opt to take the accounting curriculum as there is no separate entrance exam or other requirement. Some campuses in the system, but not this one, may select on the basis of student grade point average (GPA) if the campus has been declared impacted due to excessive demand. Over time, the number of graduates from this cam-pus’s accounting program has been increasing.
Table 1 shows that there were 392 accounting undergrad-uates who graduated from Fall 2005 to Summer 2010.
TABLE 1
Number of Undergraduate Accounting Graduates
Academic year Number of graduates
2005–2006 68
As noted by the AICPA survey from 2000 to 2008, there is a continuous increase in student enrollment. The AICPA has for many years surveyed schools regarding the number of students in accounting departments. In their 2009 report, accounting enrollment continued to grow at the Bachelor’s level as follows: for 2000–2001, 134,775; for 2001–2002, 133,435; for 2002–2003, 141,175; for 2003–2004, 142,735; for 2006–2007, 173,299; and for 2007–2008, 181,075.
We examined five years of data covering academic years 2005–2006 through 2009–2010. As shown in Table 1, our university trend is similar to the surveyed AICPA national trend from 2005–2006 to 2007–2008. There was a drop in 2008–2009 but numbers recovered in 2009–2010. It may be the case that these numbers show fluctuation over the years perhaps due to perceptions of accounting job availability by students (Nelson et al., 2008). While the numbers did not increase in every year, over the period examined there was clear growth in this accounting program.
The AICPA (2009) also asked surveyed schools to predict future enrollment and found that for 2007–2008,
[P]redictions of future enrollments are, unsurprisingly, markedly different from those of a year ago. At the Bache-lor’s degree level, 41% of respondents expect lower enroll-ments going forward (only 4% were in this category a year ago).. . .Those citing “unknown” as a response are fully 50% at the Bachelor’s level (only 4% a year ago).. . .Conversely, those expecting higher enrollments for Bachelor’s candidates dropped from 60% to 4%.. . .Clearly, the economic factors and uncertainties that are affecting both schools and students are driving these findings. (p. 6)
Thus, even though the survey indicated growth in student numbers, the prediction regarding future enrollment growth was mixed. In this study, we expected the number of ac-counting majors to fluctuate beyond 2008 perhaps due to job availability because “job availability is increasingly the most influential factor in students’ decisions to major in account-ing” (Nelson et al., 2008, p. 373). Year-to-year changes in public support due to economic conditions and budgetary constraints may also contribute to fluctuating numbers.
Demographics
The survey by the AICPA (2009) reported that in 2007–2008, there were 53% women compared with 47% men. Nelson et al. (2008) reported that the gender mix at the undergraduate level has been remarkably consistent since the first survey administration in 1991 (54% women). Thus, in this study, we expected more women than men in our archival data.
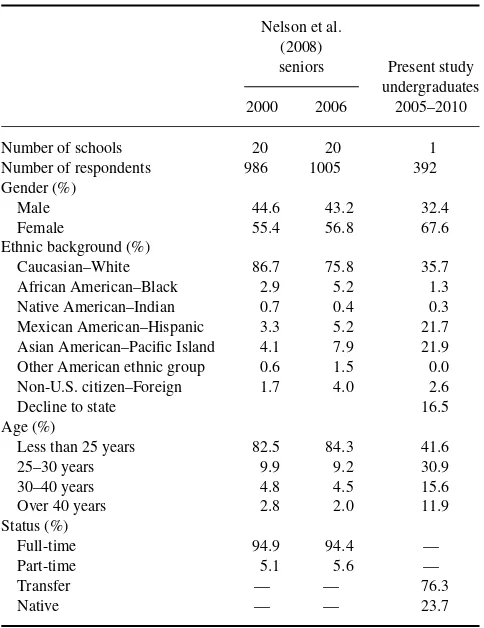
Table 2 shows a comparison of the demographics be-tween this study and the study by Nelson et al. (2008). As expected, consistent with Nelson et al. (2008), there were more female (68%) than male (32%) accounting graduates from 2005 to 2010. This is also consistent with results from other studies such as Graves, Nelson, and Deines (1993), Nelson and Vendrzyk (1996), and Nelson et al. (2002). In addition, in comparison with Nelson et al.’s (2008) FSA schools, our university had more Mexican American–Hispanic and Asian American–Pacific Island students, and fewer Caucasian–White students. About 40% of our accounting students were less than 25 years old in comparison with more than 80% of Nelson et al.’s (2008) accounting students. A majority (76.3%) of our accounting
TABLE 2
Comparison of Demographics Between Present Study and the Study by Nelson, Vendrzyk, Quirin, and Kovar
(2008)
Number of schools 20 20 1
Number of respondents 986 1005 392 Gender (%)
students were transferred students, which had no comparable data in Nelson et al.’s (2008) study.
Performance
The previous descriptive analysis indicates similarities and differences between the students in the school examined in this study and the population considered in previous work. Similar to the other studies, this student population includes a higher proportion of women than men. Different from other studies, this population reflects more diverse ethnic back-grounds and is somewhat older on average. It may be that this population consists of a higher percentage of transfer students. The comparison of GPAs with previous studies is unclear.
As we were looking both at accounting student character-istics and prospects for successful outcomes, one indicator of possible generalizability from may be performance on the CPA exam. Although far from all the students in a given program sit for the CPA exam, those who are candidates do reflect the general quality of their undergraduate preparation. CPA exam performance by school was disclosed by the Na-tional Association of State Boards of Accountancy (2009) in their annual publication,Candidate Performance on the Uni-form CPA Examination. The latest edition disclosed the re-sults for 2009, which included Table J, “Performance of Can-didates Without Advanced Degrees by Accounting School.” The table reveals that the percentage of students from the sampled campus who passed some sections of the CPA exam in 2009, 26.92% slightly exceeded the 26.34% average pass rate for the five other state university campuses in the same region. This suggests at least some limited generalizability of results from this study.
We believe that one benefit of understanding accounting student characteristics is to be able to recognize dependable indicators of positive student outcomes as early as possible. In the short term, positive outcomes are illustrated by the attainment of high grade point averages. In the medium term, positive outcomes are reflected by success on professional exams and the achievement of professional certifications in the accounting field. In the long term, successful student outcomes are reflected in successful accounting careers.
Laband, Rosenberg, and Smith (1997) reported that cumu-lative GPA is described to be the “best measure of students’ ability to perform scholastically” (p. 525). Other measures, such as Scholastic Aptitude Test scores, are often either un-available or are a noisy signal of academic performance (La-band et al.; Mohrweis, 2010). In this study, we developed regression models to provide further insights into accounting student characteristics and their performance. The indepen-dent variables were gender, admit status, and Intermediate 1 grade. Gender was included to determine if there is a gender effect.
Laband et al. (1997) found that GPAs of transfer students were higher than grades of native students, and they stated
ACCOUNTING STUDENT CHARACTERISTICS 73
that this may be an indication of grade inflation at the two-year college level. They also found the performance in the upper level accounting courses of transfer students to be similar to those of native students. We used admit status to proxy for transfer versus native students and to determine if transfer students perform differently than native students.
The intermediate accounting grade seems to be a good predictor of a student’s success in the accounting program. Frakes (1977) found the Intermediate accounting grade to be closely related to a student’s overall GPA. In addition, Hicks and Richardson (1984) also found the Intermediate accounting grade to be related to both the overall GPA and the accounting GPA.
Our question, how best to understand a student’s perfor-mance later in the accounting program, differs somewhat from the question examined by Adams, Pryor, and Adams (1994) some time ago. That study attempted to understand whether higher aptitude or higher performing students were drawn to the accounting curriculum or were attracted to other curricula once they had sampled accounting in the introduc-tory or fundamentals course. They used testing to identify higher aptitude students and came to the troubling finding that such students may not stay with accounting.
HYPOTHESES
In this study, we use the first of two “intermediate” account-ing courses, Intermediate 1, as the source of grade to be evaluated as a potential predictor. We examine three possi-ble resulting GPA outcomes, the overall GPA, the university GPA, and accounting GPA. The overall GPA is the cumula-tive GPA for all courses completed at our university as well as those courses completed elsewhere and transferred into our university. The university GPA is the cumulative GPA for courses completed at our university, and the accounting GPA is the cumulative GPA of all upper-division accounting courses.
Given the conclusions of the previous survey-based stud-ies, we expected to find a positive relationship between the Intermediate 1 grade and later student outcomes but not be-tween student gender or transfer status and later student out-comes. Therefore, the primary question examined in this study was the following:
Hypothesis 1(H1):Ceteris paribus, there would be a statis-tically significant relationship between the Intermediate 1 grade and the (overall, university, accounting) GPA.
Secondary hypotheses included in the test were the following:
H2:Ceteris paribus, there would be a significant statistical relationship between the gender of the student and the (overall, university, accounting) GPA.
H3:Ceteris paribus, there would be a significant statistical relationship between the admit status of the student and
the (overall, university, accounting) GPA, where admit status proxies for whether a student was a transfer stu-dent. The regression models were set up in the following way:
After obtaining university Institutional Review Board ap-proval, we obtained and analyzed transcript information of our undergraduate accounting students who graduated from Fall 2005 to Summer 2010.
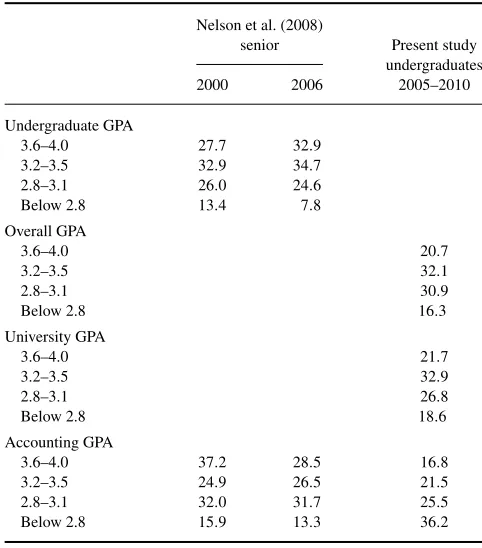
Table 3 shows that the GPA from our archival data is different from Nelson et al.’s (2008) survey (self-reported) data. Our university’s archival data contains both overall GPA and university GPA. In comparison to Nelson et al., we had a smaller proportion of students with high accounting GPA. Table 4 shows the descriptive statistics of the variables used in the regression models.
Panel A of Table 5 shows the regression output for Overall GPA =α +β1Intermediate 1 Grade+β2Gender
TABLE 3
Comparison of Student Quality With the Study by Nelson, Vendrzyk, Quirin, and Kovar (2008)
Nelson et al. (2008)
TABLE 4 Descriptive Statistics
n Minimum Maximum M SD
Overall GPA 392 2.07 4.00 3.18 0.42 University GPA 392 2.12 4.00 3.18 0.44 Accounting GPA 392 1.72 4.00 2.98 0.54 Intermediate 1 grade 375 2.00 4.00 3.09 0.70
Note.Some of the transfer students did their intermediate I course at other universities, and their intermediate I grade was not recorded on our university transcript.
+β3AdmitStatus. The model had an adjusted R2value of 39.5%,Fof 82.449, and was significant atp=.000. Inter-mediate 1 grade was a significant (p =.000) predictor of overall GPA (overall GPA was the cumulative GPA of all courses, including those transferred in). This suggests that if students do well in Intermediate 1, they may also do well in the remainder of their courses. Gender was also a significant variable (p =.023) and the negative regression coefficient indicates that male students were more likely to have lower overall GPA than female students. Admit status was not sig-nificant, which suggests that whether a student was a trans-fer student or native student had no impact on their overall GPA.
Panel B of Table 5 shows the regression output for Uni-versity GPA =α +β1Intermediate 1 Grade+ β2Gender + β3AdmitStatus. The adjusted R2 value was 51.1%, had anFof 131.323, and the regression model was significant at
p=.000. Intermediate 1 grade was a significant (atp=.000)
predictor of the cumulative GPA of courses completed at our university (i.e., university GPA). This suggests if students do well in Intermediate 1, they are most likely to do well in their other university courses. Gender was not significant, which suggests that it has no impact on university GPA. Admit sta-tus was significant atp=.042 and had a negative coefficient, which indicates that transfer students had lower university GPAs than did native students.
Panel C of Table 5 shows the regression output for Ac-counting GPA=α+β1Intermediate 1 Grade+β2Gender +β3AdmitStatus. The model had an adjusted R2 value of 58.1%,Fof 174.009, and was significant atp=.000. Inter-mediate 1 grade was a significant (p=.000) predictor of the GPA of upper division accounting courses (i.e., accounting GPA). Gender and admit status were not significant vari-ables, which indicates that they had no impact on the GPAs of upper division accounting courses. The insignificant admit status was consistent with Laband et al. (1997), who found that the performance in upper division accounting courses was not different for transfer and native students.
Overall, the three regression models in Table 5 suggest that Intermediate 1 grade was a significant determinant of the cumulative GPAs (a) for courses completed at our uni-versity as well as courses transferred in (i.e., overall GPA), (b) for courses completed only at our university (i.e., uni-versity GPA), and (c) for upper division accounting courses (i.e., accounting GPA).
The gender variable was only significant when the depen-dent variable was overall GPA, which was the cumulative GPA of all courses transferred and those completed at our university, suggesting that transferred female (male) students
TABLE 5 Regression Output
Unstandardized coefficients
Standardized coefficients
B SE β t Sig.
Panel A: Overall GPA=α+β1Intermediate 1 grade+β2Gender+β3AdmitStatus
Constant 2.220 0.104 21.332 .000
Intermediate 1 grade 0.376 0.024 .638 15.689 .000
Gender −0.080 0.035 −.092 −2.277 .023
AdmitStatus −0.049 0.039 −.051 −1.260 .208
Panel B: University GPA=α+β1Intermediate 1 grade+β2Gender+β3AdmitStatus
Constant 1.937 0.100 19.383 .000
Intermediate 1 grade 0.457 0.023 .724 19.811 .000
Gender −0.020 0.034 −.021 −0.583 .560
AdmitStatus −0.076 0.037 −.074 −2.044 .042
Panel C: Accounting GPA=α+β1Intermediate 1 grade+β2Gender+β3AdmitStatus
Constant 1.213 0.113 10.734 .000
Intermediate 1 grade 0.591 0.026 .767 22.675 .000
Gender −0.005 0.038 −.004 −0.130 .897
AdmitStatus −0.028 0.042 −.023 −0.673 .501
Note. N=375. GPAs for overall, university, accounting, and intermediate 1; Gender (1=female, 2=male), and AdmitStatus (1=native, 2=transfer). For Panel A, adjustedR2value=39.5%,F=82.449,p=.000. For Panel B, adjustedR2value=51.1%,F=131.323,p=.000. For Panel C, adjustedR2
value=58.1%,F=174.009,p=.000.
ACCOUNTING STUDENT CHARACTERISTICS 75
had higher (lower) GPAs prior to coming to our university. However, once they were enrolled in our university, the gen-der effect did not impact their university GPAs and account-ing GPAs.
LIMITATIONS AND CONCLUSION
The main limitation of this study was the reliance on archival data from only one school. While we believe the results may be generalizable at least to some other accounting programs, that is, of course, just our conjecture. The archival transcript data available to us was limited to a five-year span. Further, our data were only for those students who graduated from the accounting program during the five-year span. We do not know how many others failed to complete the program or chose another area of study as a result of their experiences in intermediate accounting.
Following Nelson et al. (2008), we examined the trend in accounting student characteristics. They used surveyed data while we used archival transcript data. We reported a detailed analysis of student performance in Intermediate ac-counting and its impact on overall, university, and acac-counting GPAs.
The archival data in this study supports the notion that the first intermediate accounting course is a good indicator of later student outcomes measured as the overall, university, and accounting GPA at the time of graduation. We anticipate that student outcomes at the baccalaureate level prefigure later career and professional certification outcomes, but we have not yet tested this idea. We believe that understanding the information content of the intermediate grade may help CPA firms to recruit student interns because intern candidates are usually identified early in the accounting program, at the intermediate account level. In addition to GPA, we recog-nize there are other measures of potential success for student interns and other accounting graduates such as prior work ex-perience, leadership skills, communication skills, and team-work are also important.
The study was limited in that we did not attempt to charac-terize the reason for a student’s grade in the first intermediate course, but simply examined the grade for clues as to the student’s future performance. In general, a poor grade is usu-ally assumed to reflect a student’s relative lack of ability or application to a course. It is also possible that able students may choose to cruise through a course and pass with minimal effort, behavior that was not identified in this study.
In future studies researchers needed to clarify how useful the intermediate account course outcomes are in understand-ing a student outcomes within and across schools. A first step would be to identify outcomes for all students who have taken the first intermediate accounting course rather than just those who stayed with the accounting curriculum through to graduation. It will be challenging to access the information necessary for future study to compare archival data across
campuses and to compare undergraduate performance with postgraduate academic and career outcomes.
REFERENCES
Abels, P. R. (2004). The 150-hour requirement and its effect on student enrollment.The CPA Journal,74(4), 56–58.
Accounting Education Change Commission. (1990). Objectives of educa-tion for accountants: Posieduca-tion Statement Number One.Issues in Account-ing Education,5, 307–312.
Adams, S. J., Pryor, L. J., & Adams, S. L. (1994). Attractions and retention of high-aptitude students in accounting: an exploratory longitudinal study.
Issues in Accounting Education,9, 45–58.
Albrecht, W. S., & Sack, R. J. (2000).Accounting education: Charting the course through a perilous future: Accounting Education Series(vol. 16). Sarasota, FL: American Accounting Association.
American Institute of Certified Public Accountants. (2009).Trends in the supply of accounting graduates and the demand for public accounting recruits. New York, NY: Author.
Boyd, D. T., Boyd, S. C., & Boyd, W. L. (2000). Changes in accounting education: Improving principles content for better understanding.Journal of Education for Business,76, 36–42.
Danko-McGhee, K., Duke, J. C., & Franz, D. P. (1992). Predicting student performance in accounting classes.Journal of Education for Business,
67, 270–277.
Frakes, A. H. (1977). Introductory accounting objectives and intermediate accounting performance.The Accounting Review,23, 200–210. Graves, O. F., Nelson, I. T., & Deines, D. S. (1993). Accounting student
characteristics: Results of the 1992 Federation of Schools of Accountancy (FSA) survey.Journal of Accounting Education,11, 211–225. Hicks, D. W., & Richardson, F. (1984). Predicting early success in
inter-mediate accounting: The influence of entry exam and GPA.Issues in Accounting Education,Spring, 61–76.
Hurt, B. (2007). Teaching what matters: A new conception of accounting education.Journal of Education for Business,82, 295–299.
Laband, D. N., Rosenberg, D. L., & Smith, K. J. (1997). An examination of the performance of transfer versus “native” students in upper-level accounting courses.Journal of Accounting Education,15, 515–529. Lin, Z. J., & Hunter, A. (1992). Accounting education for the 21st century:
A Canadian experiment.Journal of Education for Business,68, 38–43. Mohrweis, L. C. (2010). The omitted variable in accounting education
re-search: The non-traditional student.American Journal of Business Edu-cation,3(1), 1–5.
National Association of State Boards of Accountancy. (2009).CPA can-didate performance on the uniform CPA examination. New York, NY: Author.
Nelson, I. T., & Vendrzyk, V. P. (1996). Trends in accounting student char-acteristics: A longitudinal study at FSA schools, 1991–1995.Journal of Accounting Education,11, 453–475.
Nelson, I. T., Vendrzyk, V. P., Quirin, J. J., & Allen, R. D. (2002). Trends in accounting student characteristics: Results from a 15-year longitudinal study at FSA schools.Issues in Accounting Education,17, 269–287. Nelson, I. T., Vendrzyk, V. P., Quirin, J. J., & Kovar, S. E. (2008). Trends
in accounting student characteristics: Results from a 15-year longitudinal study at FSA schools.Issues in Accounting Education,23, 373–389. Sarbanes-Oxley Act of 2002, Pub. L. 107–204, 116 Stat. 745 (2002). Schroeder, N. W., & Franz, D. R. (2004). Explaining the decline in CPA
can-didates: Is the 150-hour requirement a factor?The CPA Journal,74(10), 62–66.
Sharman, P. A. (2007). The Ph.D. shortage.Strategic Finance,8, 55. Uniform Accountancy Act . (2011). New York, NY: AICPA.
Velshi, A. (2011, January). Today’s “it” jobs: Accounting and IT.Money Magazine,42.