Earnings Losses among
Work-Limited Disabled Workers
Kerwin Kofi Charles
a b s t r a c t
This paper asks: What are the dynamic effects of disability on earnings? Un-like most of the previous literature, it uses panel data, and fixed effects meth-ods are used to assess how the earnings of disabled workers depart from ex-pected levels over many years before and after the date of onset of their disability. The paper also examines how worker characteristics affect earn-ings losses from disability, with particular attention paid to the age at which the person suffers onset. Disabled men are found to experience sharp drops in earnings that predate the measured date of onset. Earnings recover rap-idly soon after onset, with much of the immediate reduction made up in the first two post-onset years. A modest downward trend follows, resulting in sig-nificant long-term losses in expected annual earnings of about 12 percent per year. Being older at onset, nonwhite, more chronically disabled, and less educated cause the losses from disability to be larger and the recovery smaller. A large portion of these differences across groups appear to derive from industry affiliation after onset. The Paper argues the facts are all con-sistent with a simple human capital explanation of the disability process.
I. Introduction
There is a voluminous body of literature that assesses the effect of disabling illness on earnings and labor force participation.1For the most part,
re-Kerwin Kofi Charles is a professor of economics and public policy at the University of Michigan. Comments from seminar participants at Cornell University, the University of North Carolina, Vanderbilt University, Car-negie Mellon University, the University of Michigan, and CarCar-negie Mellon University are gratefully acknowl-edged. The author thanks John Abowd, John Bound, Ronald Ehrenberg, Olivia Mitchell, Robert Gibbons, Gary Solon, Melvin Stephens, and especially two anonymous referees for their comments and advice. The data used in this article can be obtained beginning February, 2004 through January 2007 from the author, 408 Lorch Hall. 611 Tappan Street. Ann Arbor, MI.48109. phone: 734.764.8075. e-mail: kcharles//umich.edu
[Submitted August 1997; accepted February 2002]
ISSN 022-166X2003 by the Board of Regents of the University of Wisconsin System
1. See Currie and Madrian (1999) for a recent thorough review of the large literature which directly studies how disability and poor health affects earnings. Empirical researchers also routinely include measures of health and disability status as controls in wage and earnings equations, when their main interest is on another variable.
searchers have utilized cross-sectional data and methods to analyze disability’s ef-fects.2Two consequences have naturally followed from this policy. First, the empiri-cal literature on the effects of disability has not benefited from advances in the application of panel data techniques as have, for example, the literature that examines the effects of job loss or job training on wages. Second, the reliance on cross-section techniques and data has meant that questions about thedynamicor temporal effects of disability on earnings have rarely been analyzed. So, virtually no evidence has been gathered that describes the evolution of earnings subsequent to disability onset. Nor do we know whether the temporal loss patterns depend on the point in the life cycle at which the person suffers disability onset.
This paper represents an attempt to extend the previous work on disability by dealing directly with these shortcomings. It uses panel data and fixed effects methods to answer two main questions: How do the earnings of work-limited disabled men evolve over time, both before and after the onset of their disabilities? And: How do the man’s characteristics–especially the age at which he suffers onset—affect the earnings losses that he experiences?
The results indicate that disabled men experience sharp drops in expected annual earnings, caused mainly by hours reductions rather than changes in wages, around the measured date of onset. Earnings recover rapidly soon after onset, with much of the much immediate reduction made up in the first two post-onset years. A modest downward trend follows, resulting in significant long term losses in expected annual earnings of about 12 percent per year. Being older at onset, nonwhite, more chroni-cally disabled, and less educated all cause the losses from disability to be larger and the recovery smaller. We find that a large part of these differences across groups can be attributed to post-onset industry and occupation affiliation.
The paper argues that these facts are consistent with a conceptual framework in which both the losses and recovery from disability are thought of in a human capital context, wherein disability destroys accumulated human capital of a certain type and encourages investment in other types.
Differences in expected earnings losses across different groups raise the question of whether the loss patterns might indicate that the severity of disabilities differs across different groups of men. Unfortunately, the limited disability information and the total absence of detailed medical information make it very difficult to control for disability severity, partly because ‘‘severity’’ can take so many different dimensions. However, the paper exploits the longitudinal nature of the available binary disability reports to construct an intuitive index of one possible dimension of ‘‘severity’’— the extend to which a disability’s associated health effects are felt over multiple years.3This index of severity may be called a disability’s ‘‘chronicity.’’ The empiri-cal work uses these different post-onset disabilityhistoriesto measure and control
2. Richer dynamic models that include discussion of disability, or disability payments such as Benitez-Silva et al. (1998) and Rust (1987) have not focused directly on the expected labor supply losses from among working-aged disabled men.
for chronicity. Not surprisingly, earnings losses appear to be larger and recovery smaller for more chronically disabled men.
II What is Disability and Does it Matter When You
Get It? A Human Capital Explanation
Suppose that the only difference between two disabled men, currently aged 50, is that one became disabled at age 25 and the other at age 40. Which of the two would one expect to now have higher earnings? We speculate that two econo-mists might well give different answers to this hypothetical experiment, and argue that the different arguments each might raise suggests a useful framework for think-ing about disability more generally.
Someone who says that the earnings of the man who became disabled at 25 should be higher, may speculate that because that man would have spent more years as a disabled person by age 50, he would have had a longer time to adjust to his disability. One might say that he would have had a longer time over which to make human capital investments useful to him in the disabled state. A person who argues a priori that the man who became disabled at age 40 should have higher earnings at 50, probably thinks that because this man was healthy for a longer portion of his life, it was easier for him to have acquired a set of skills that would raise his earnings, irrespective of his health.
A conceptual framework that captures these different ideas assumes that the typi-cal person’s human capital stock consists of different components distinguished by their usefulness in different states of health.Healthy capital may be thought of as human capital which is only useful if the person is healthy.Generalcapital is useful in all states of health, though it may have a higher per-unit payoff when the person is healthy.Disabilitycapital is that human capital that is useful only when the person is disabled. The dynamic pattern of the earnings losses from disability can be thought of in terms of the changes in these levels of human capital.
invest-ment.4The standard model thus implies that, all else equal, younger people should invest more in human capital because they have a longer time over which to recoup the benefits of their investment. Because human capital takes time to accumulate, and because it does not immediately depreciate once acquired, the models also pre-dict that a person’s accumulated stock of human capital tends to rise with age, but at a decreasing rate.
Even if human capital investment costs are unrelated to health status (clearly an unrealistic assumption), the two points above suggest some interesting predictions about the life-cycle effects of disability onset. Given that acquired human capital grows over time, we would expect that more healthy capital will be destroyed the older a person is at disability onset. Again, consider the example of blindness. The older a machinist, the more he likely knows about handling a lathe or blowtorch. Clearly, the onset of blindness prevents most machinists from doing either thing, and earnings likely suffer an immediate reduction as a result. According to the human capital characterization of disability assumed here, this immediate reduction is likely to be larger the older the machinist is at onset. Blindness destroys the accumulated stock of healthy capital—the ability to operate a lathe—for both the person who is young and the person who is older at onset. But the young person, holding factors like ability constant, will not have been as good a lathe operator before onset because he will not have had time to accumulate skills and properly learn the trade.
The framework also suggests that once disability strikes, post-onset earnings growthshould be greatest for those persons who are young at onset. It is these newly disabled persons who have the most to gain from intense investment in the forms of human capital useful to a disabled person. They have a long time horizon over which to deal with their affliction, and thus a longer time over which to recoup any investment costs. People who are young at onset also do not have a large store of general capital on which to rely. This means that if they are to fare well in the future, it is vital that they acquire new skills, or learn to use those they have in new ways. Below, we study the general and relatively ignored question of how earnings losses from disability evolved through time among all disabled men. Then, we assess whether the effect of the age of disability onset on these temporal loss patterns is consistent with the human capital conceptualization above. The next section de-scribes the sample, how the disabled population is classified, and the disability histo-ries. Limitations and strengths of the available disability information are also dis-cussed.
III. Data Description and Classification of Disabled
Population
This paper uses data from the 1968–93 waves of the family-individ-ual file of the Panel Study of Income Dynamics (PSID). Persons at risk to be in the analysis sample are male household heads who are between 22 and 64 years of age in the survey year, and who are in the survey for at least three consecutive years.
Given the paper’s focus, it is ideal that there are potentially many years of data available for each man in the sample, on both disability and labor force information. In each survey year the PSID inquired of male heads of households whether they suffered from a physical impairment that limited the kind or amount that they could do. This is the only type of disability information continuously available in the data. Countless previous authors, using both the PSID and other data sets, have used com-parable binary self-reports of work limitation to identify disability.5Moreover, this definition of disability is nearly identical to that employed in the Americans with Disabilities Act (ADA)—the major legislation covering the treatment of the disabled in the labor market.6Nonetheless, like all attempts to classify disability,7there are clear limitations with the available binary self-reports.
One problem is that binary self-reports are not informative about the precise na-ture of the condition that is the cause of the disability. That is, the paper cannot control for specific disabilitytypeand necessarily conflates effects for disabilities that may differ in key ways. For example, some disabilities may be the result of an accident. If accidents are unanticipated, people suffering from these disabilities probably do not make human capital decisions in anticipation of them. On the other hand, some disabilities, such as those that are degenerative, may be relatively easy to predict. Unlike accident victims, these disabled people might make anticipatory human capital decisions before the actual date of onset. The temporal pattern of their earnings losses would thus be different from those of persons injured in accidents. Unfortunately, the available data do not permit a disentangling of these different effects.8
Another potential problem with the available disability information is that the binary self-reports may be systematically related to labor market outcomes of inter-est. For example, some people who report that they are suffering from a functional limitation may be merely attempting to justify poor labor force attachment or low earnings unrelated to their poor health.
The fixed effects methods applied below, which measure changes in individuals’ labor force outcomes over time, control for latent, fixed differences in earnings or labor force attachment that might be correlated with self-reports of disability status. Also, rather than use a single indicator of disability from a given time period, the analysis in this paper uses the post-onsethistoryof disability reports that an
individ-5. See, for example, Luft (1975), Haveman and Wolf (1990), Bennefield and McNeil (1989), who study the effect of disability on earnings in the cross-section. Stern (1989) and Sickles and Taubman (1986) find that a disability self-report is associated with a diminished probability of labor force participation. Chowdhury and Nickell (1985) and Chirikos and Nestel (1985), use binary disability self reports from the PSID and N.L.S. Survey of Older Men and Mature Women respectively.
6. According to the ADA, disability is ‘‘. . . a physical or mental impairment which substantially limits one or more of the major life activities’’ of an individual. A person is also disabled if he has a ‘‘. . . record of such an impairment . . .’’ or is ‘‘. . . regarded as having such an impairment.’’ [SeeAmerican with Disabilities Act of 1990, 42 U.S. Code 12101, see. 3(2). and Section 223b(1). Social Security Act as amended 42 U.S.C. 5433 (b.)].
7. Walter Oi (1990: 33) captures the frustration of disability researchers well when he says of disability that it ‘‘. . . is an elusive state that cannot be precisely defined or measured. Functional and activity limita-tions surely matter, but there is no bright line separating the disabled from the nondisabled.’’
ual gives over many years to classify his disability status. Whereas a single report of disability taken at a point in time may be unreliable for all of the reasons mentioned previously, the longer the interval over which disability is reported, the more likely it is that the person is truly the victim of a chronic functional limitation.
To track the temporal loss patterns from disability, the paper must identify the date at which disability onset occurs. A very attractive feature of the PSID data is that retrospective questions about the date of onset of work limitations were asked in all but two survey years between 1968 and 1978. The sample of men in the PSID can be separated into a ‘‘nondisabled’’ sample (people who never report a limitation), and a ‘‘disabled’’ sample (those who report a limitation at least once).
With no additional restriction, the disabled sample would consist of people who responded to a retrospective age of onset question and those who did not. Among the latter group, we include only men who report that they do not have a disability for at least two periods before the first observed positive disability report. Among disabled men who report their date of onset, individuals whose reported onset age was younger than 18 were dropped from the analysis. Only 11 people were lost from the analysis because of this restriction. For disabled people who responded to the age/date of onset question, the date of onset is taken to be the reported date. The age of onset for the remainder of the disabled sample was taken to be the first date at which a work limitation was reported.9
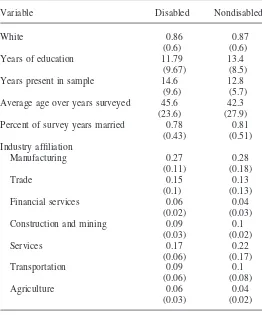
After deletions for missing data on key demographic variables, the final sample used in the analysis consists of 5,322 ‘‘nondisabled’’ and 2,461 ‘‘disabled’’ male household heads present for three consecutive years in PSID between 1968 and 1993. Table 1 describes the disabled and nondisabled samples. For the disabled sample, industry affiliation is reported in the year prior to disability onset. For the nondisabled sample, industry affiliation is reported as the mean over three randomly selected years. The results indicate that before disability onset, the industry affiliation of people who became disabled was almost identical to the ‘‘nondisabled’’ in any given year. The incidence of marriage and the racial breakdown in the two groups is also essentially the same. Members of the disabled and nondisabled samples are observed for about 15 and 13 years, respectively. And, consistent with the fact that poor health positively correlates with age and low education, the table shows that the disabled sample had completed about one and a half fewer years of schooling, and was about three years older, on average, over the time they are observed in the sample.10
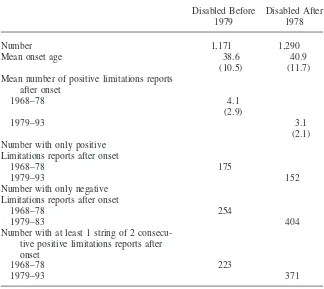
Table 2 summarizes the different dimensions of disabilities for the men who ever report a limitation. The table separates men who first report a limitation in 1978 or earlier, and men whose first report is after 1978. Recall that the former group directly responds to a retrospective onset age question, whereas onset age for the other group,
9. An alternative specification was tried in which disabled people who did not report a date of onset had to have at least three (as opposed to two) periods during which they reported not having a limitation before the first positive report. The disabled sample was smaller by 114 persons with this restriction, and the characteristics of that sample and the one used in the paper were virtually identical.
Table 1
Sample Means For Disabled and Nondisabled Samples. (Standard deviations in parentheses.)
Variable Disabled Nondisabled
White 0.86 0.87
(0.6) (0.6)
Years of education 11.79 13.4
(9.67) (8.5)
Years present in sample 14.6 12.8
(9.6) (5.7)
Average age over years surveyed 45.6 42.3
(23.6) (27.9)
Percent of survey years married 0.78 0.81
(0.43) (0.51)
Industry affiliation
Manufacturing 0.27 0.28
(0.11) (0.18)
Trade 0.15 0.13
(0.1) (0.13)
Financial services 0.06 0.04
(0.02) (0.03)
Construction and mining 0.09 0.1
(0.03) (0.02)
Services 0.17 0.22
(0.06) (0.17)
Transportation 0.09 0.1
(0.06) (0.08)
Agriculture 0.06 0.04
(0.03) (0.02)
Data from the survey years 1968–1993 of the Panel Study of Income Dynamics. Data restricted to male household heads between 22 and 64 who are present in the sample for at least 3 consecutive survey years. Disabled sample consists of men who ever report the presence of physical or mental condition that limits the type or amount of work they can do. For the disabled sample, industry affiliation is measured in the year preceding disability onset; for nondisabled sample, affiliation is the mean over three randomly selected years. See text for further explanations.
(for each of whom there were at least two observed periods reporting no limitation before the first reported disability), is taken to be the year of first observed disability. The first row of the table shows that the disabled sample is split rather evenly between the two groups; the pre-1979 group is 48 percent of the total disabled sample of the 2,461 men who ever report a limitation.
Table 2
Distribution of Positive Limitations Reports in Work Limitations Reports for PSID Male Household Heads Aged 22 to 64., Sample Years 1968–93
Disabled Before Disabled After
1979 1978
Number 1,171 1,290
Mean onset age 38.6 40.9
(10.5) (11.7)
Mean number of positive limitations reports after onset
1968–78 4.1
(2.9)
1979–93 3.1
(2.1) Number with only positive
Limitations reports after onset
1968–78 175
1979–93 152
Number with only negative Limitations reports after onset
1968–78 254
1979–83 404
Number with at least 1 string of 2 consecu-tive posiconsecu-tive limitations reports after onset
1968–78 223
1979–93 371
Note: The sample is restricted to male PSID household heads present in the survey for at least three consecutive years. The PSID limitation question is: ‘‘Do you have any physical or nervous condition that limits the type of work or the amount of work you can do?’’ Disabled samples restricted to persons who suffer onset on or before their 64th birthday, but after their 22nd. The age of onset for those experiencing onset before 1979 is determined by a retrospective question in the PSID. The date of onset for those suffering onset after 1978 is the date of the first disability report after two consecutive periods of reporting no work limitation. See text for explanation.
for men who did not respond to the retrospective onset age question. Thus, the as-sumption that onset occurs the first time a positive report follows two consecutive negative reports yields estimated onset ages almost identical to those reported among those who actually report an onset age.
groups—at least along the dimension of chronicity. Indeed, these numbers suggest that disabilities might be slightly more chronic for men disabled after 1978. This impression may be misleading though, because men disabled after 1978 are in the data set for fewer years. To account for this difference, the remaining entries in the table summarize the disability histories by showing patterns over the years 1968– 78 for the group experiencing onset prior to 1979, and for the years 1979-93 for those with onset after 1978.
The fourth set of numbers in the table show that after onset, and over the relevant time periods described above, men disabled before 1979 report another disability 4.4 more times, on average, over the 1968–78 interval. Men disabled after 1978 report a disability 3.1 additional times after onset, between 1979 and 1993, on av-erage.
The next three entries investigate the patterns of the reports of disability. First, the table shows that 14 percent of men disabled before 1979 report that they are disabled inevery subsequent yearbetween 1968 and 1979. Twelve percent of men disabled after 1978 report disability in every year after the onset year. The empirical work treats these men with 100 percent observed post-onset disability histories as the most chronically disabled men in the sample. At the other extreme, the next set of numbers in the table indicates the fraction of men whose disabilities appear least chronic—those who never again report a disability after the date of onset. Twenty percent of the men disabled before 1979 never again report being work-limited dis-abled after their onset year between 1968 and 1978. Among people experiencing onset after 1978, 30 percent never again report a disability.
For a picture of the pattern of disability histories in cases other than these extremes, the numbers in the last row of the table report the number of times after onset that the disabled person reports a disability in at least two consecutive years. The table shows that 20 percent of the people disabled before 1979 had such ‘‘strings’’ of two consecutive disabilities between 1968 and 1978. The corresponding number is 25 percent of people disabled after 1978.
As noted, the binary work limitation reports, and the histories formed from them, are the only continuously available disability information in the PSID. However, from 1977 to 1993 the PSID inquired whether a respondent received Workers’ Com-pensation benefits. And, in 1992 and 1993 respondents were asked about their diffi-culties with various activities of daily living.11 None of these variable measures ‘‘true’’ disability,12and they are absent for many of the years studied. Nonetheless, a reasonable test for whether the disability history measures indicate underlying seri-ous medical conditions would be to see how the disability history indicators are related to these different variables.
We find that, in a series of simple linear probability regression13for whether the man receives Workers’ Compensation, and whether he reports suffering from a
par-11. Among the activities inquired about were bathing, dressing, eating, getting up, and using the bathroom. Respondents were also asked whether they needed a helper.
12. For example, there is some question whether all recipients of disability benefits are truly disabled (see Haveman and Wolfe 1984 and Parsons 1982). See Bound (1989) for an alternative view.
ticular functional limitation, the different disability history indicators vary in a statis-tically significant way with these other measures in the direction we would expect. For example, among persons present in the sample in the years when the Workers’ Compensation question was asked, men with only one observed period of disability (no positive reports after onset) were estimated to have only a 0.003 greater probabil-ity of receiving benefits than men who never reported a disabilprobabil-ity. This effect was statistically insignificant. On the other hand, men who reported a disability in every observed post-onset year were a statistically significant five percentage points more likely than nondisabled men to receive benefits. Similar results held for each of the functional limitations measures. In sum, it seems that, as hoped, the disability history measures correspond to different levels of underlying severity or chronicity of the disability.
Table 2 shows the limitations of using a single report of disability to characterize a person as disabled, as has been common in the cross-section literature. We find that ever reporting disability does not mean that one will do so consistently afterward. Empirical work that relies upon disability information from a single time period effectively treats all of these ‘‘disabled’’ workers the same and does not utilize an important source of heterogeneity among these ‘‘disabled’’ people—the fact that their post-onset disability experiences differ. We emphasize these differences in the empirical work which follows.
IV. Empirical Model
The basic model used to measure the earnings effects of disability is:
whereyitis a measure of personi’s earnings in yeart. The empirical analysis uses three different aspects of earnings—the log of annual earnings (a good measure of economic welfare), the log of hourly earnings (an indicator of productivity), and the number of hours worked.14The variablesαiandωiare latent variables that measure the permanent, fixed differences between individuals and the differences in the per-sonal growth trend of earnings between individuals respectively; andγtis one of a set of indicator variables for the years 1968–93 that measures the economy-wide general pattern of earnings over the interval 1968–93.15As is standard in fixed effects models, the inclusion of the person-specific fixed effectαiprecludes the inclusion of time-invariant characteristics in the control vectorXit. The control vector thus includes controls for age, age-squared, region of residence, and marital status. The mean-zero errorεitis assumed random, with neither serial correlation nor correlation across cross-section units.16
14. For the hours variable, unlike the earnings measures, the models include observations with zero mea-sured hours of work.
15. The earnings data are in 1981–82 dollars.
Model 1 is estimated as follows: Least squares are performed on transformed versions of the variables given in Equation 1, where the transformed variable equals the difference between the variable and the person-specific average over time. Such fixed effect regression is a standard part of the STATA subroutine, command xtreg, fe.
The variables D1k
it,D2itk, andD3itkare a set of mutually exclusive and exhaustive binary variables that exploit the variation in disability histories among the disabled sample.D1k
it takes a value of 1 in yeart, if individualisuffers disability in yeart -k andif he does not report a disability in any other year after the onset year. The variableD2k
it equals 1 if a man reports a disability in yeart-k andhe reports a disability in every other period he is observed in the sample.D3k
it equals 1 if an individual becomes disabled in yeart-k, and if his disability history after onset is anything other than all negative reports or all positive reports. Throughout, we focus on effects ten years before onset, to ten years after, sok⫽(⫺10,⫺9,⫺8, . . ., 0, 1, 2, . . . , 10). The coefficientsdjk,j⫽1, 2, 3, measures how the earnings of disabled men with three different types of disability histories, depart from levels the data indicates these workers would have receivedkperiods after (before) the date of onset.
There are many advantages of Model 1 relative to the cross-section techniques which dominate the disability literature. One major advantage is that Model 1 exam-ines the longitudinal, or temporal, pattern of losses from disability onset that are not elsewhere presented in the disability literature.
Another advantage of Model 1 is that cross section estimates do not include unob-served determinants of earnings likeαiandωi. If the propensity to report a disability is correlated with unobserved determinants of earnings or labor supply, cross-section estimates of the effect of disability suffer from omitted variables bias. The direction of this bias is a priori indeterminate: one cannot say definitively that low or high-earnings people are more likely to report a disability. Controlling for latent labor force determinants, as is done in Model 1, should correct for this problem.
Finally, we have already noted that controlling for the underlying severity of dis-ability is quite difficult and rarely attempted. The empirical work here sorts disabled men by their different disability histories. Controlling for these histories thus par-tially accounts for disability chronicity and permits an examination of how labor market earnings losses vary with chronicity.
One concern with the approach given by Model 1 is possible selection bias. Two earnings measures used in the paper are the log of wages and annual earnings. People who do not work are not included in these regressions.17Heckman (1978) provides the most common method of dealing with this problem, which is to estimate the determinants of the participation decision and then to use those estimates to construct an Inverse Mills ratio, which is added to the earnings equation.18To construct these Mills ratios, we estimate probit equations for the probability of working positive
17. The issue of reduced (possibly to 0) hours of work is important because: (a) no restriction is placed on the sample, common in many empirical panel data studies, that persons had to report positive hours of work in each period that they appear, and (b) weak post-onset labor force attachment is an important consideration for disabled persons.
hours in any period on the following set of variables: age, age-squared, education, marital status, number of young children at home in year that year, and a variable for whether the person worked in the previous year. The Mills ratios constructed by this method are added to the regressions. Selection bias does not appear to be a significant problem in the panel models estimated here, as the results of the various models presented below are nearly identical to what is obtained when the Heckman correction is not used.
While selection bias and endogeneity caused by correlation between disability reports and unobserved, fixed determinants of labor market outcomes do not appear to be a problem, there may be a correlation between a person’s propensity to report himself as disabled and his transitory earnings,εit.19If for example, a person initially reports a disability because his earnings in the onset period are idiosyncratically low, then the estimate of the parameterδ0will be too large. The paper does not control for this type of bias, but the estimated disability effects documented below are so large that a modest upward bias does not alter the essential findings.
V. Results
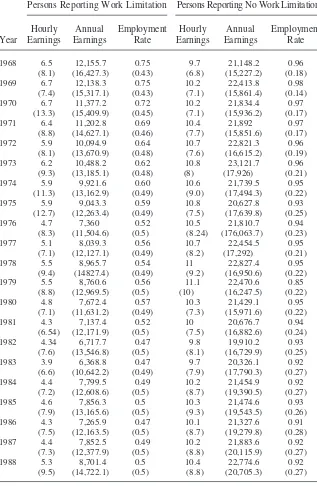
Table 3 shows the cross-sectional labor market effects associated with the report of a work-limitation across several years from 1968–93. The table shows the means of three labor market variables for persons reporting a work limita-tion in the particular year, and those not reporting a limitalimita-tion in that year. For all years, both the hourly and annual earnings of persons who report a work-limiting disability are dramatically less than those of the nondisabled. Even more striking are the differences between the groups in terms of employment status. In 1974, for example, only 64 percent of prime-aged men in the sample who report a work limita-tion are employed, compared to 96 percent among the healthy. Comparable differ-ences are evident in every year.
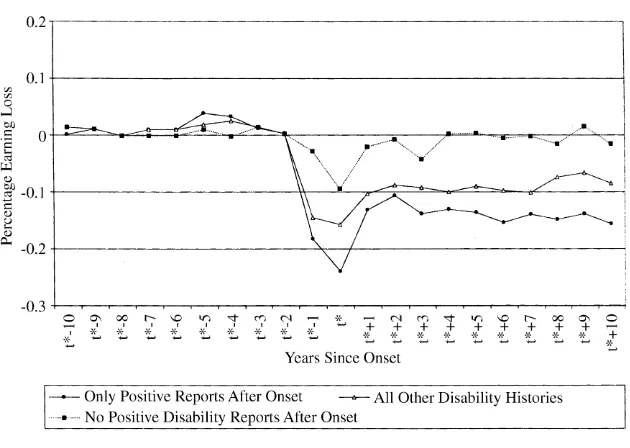
We turn next to the formal analysis of these differences with Regression 1. The results are presented diagrammatically, with the results of the regressions presented in the Appendix (Tables A1–A3).20Figures 1–3 plot the expected earnings for the average disabled worker with the three types of observed disability histories (all negative disability reports after onset, all positive disability reports after onset, and all other patterns of reports) against the number of years since onset. That is, the figures plotdjkagainstk, for j⫽1,2,3. The expected earnings loss in a particular year is given by the vertical distance between the graph and the line labeled 0.
Figure 1 shows that annual earnings of disabled men are very slightly above ex-pected levels four years before onset, but return to exex-pected levels by the third pre-onset year. This modest ‘‘jump’’ is most pronounced for people whose disabilities are most chronic (those with continuous positive disability reports after onset), and is least evident for men whose disability histories contain no post-onset positive disability reports.
Year. (Standard deviations in parentheses.)
Persons Reporting Work Limitation Persons Reporting No Work Limitation
Hourly Annual Employment Hourly Annual Employment
Year Earnings Earnings Rate Earnings Earnings Rate
1968 6.5 12,155.7 0.75 9.7 21,148.2 0.96 (8.1) (16,427.3) (0.43) (6.8) (15,227.2) (0.18) 1969 6.7 12,138.3 0.75 10.2 22,413.8 0.98
(7.4) (15,317.1) (0.43) (7.1) (15,861.4) (0.14) 1970 6.7 11,377.2 0.72 10.2 21,834.4 0.97
(13.3) (15,409.9) (0.45) (7.1) (15,936.2) (0.17) 1971 6.4 11,202.8 0.69 10.4 21,892 0.97
(8.8) (14,627.1) (0.46) (7.7) (15,851.6) (0.17) 1972 5.9 10,094.9 0.64 10.7 22,821.3 0.96
(8.1) (13,670.9) (0.48) (7.6) (16,615.2) (0.19) 1973 6.2 10,488.2 0.62 10.8 23,121.7 0.96
(9.3) (13,185.1) (0.48) (8) (17,926) (0.21) 1974 5.9 9,921.6 0.60 10.6 21,739.5 0.95
(11.3) (13,162.9) (0.49) (9.0) (17,494.3) (0.22) 1975 5.9 9,043.3 0.59 10.8 20,627.8 0.93
(12.7) (12,263.4) (0.49) (7.5) (17,639.8) (0.25) 1976 4.7 7,360 0.52 10.5 21,810.7 0.94
(8.3) (11,504.6) (0.5) (8.24) (176,063.7) (0.23) 1977 5.1 8,039.3 0.56 10.7 22,454.5 0.95
(7.1) (12,127.1) (0.49) (8.2) (17,292) (0.21) 1978 5.5 8,965.7 0.54 11 22,827.4 0.95
(9.4) (14827.4) (0.49) (9.2) (16,950.6) (0.22) 1979 5.5 8,760.6 0.56 11.1 22,470.6 0.85
(8.8) (12,969.5) (0.5) (10) (16,247.5) (0.22) 1980 4.8 7,672.4 0.57 10.3 21,429.1 0.95
(7.1) (11,631.2) (0.49) (7.3) (15,971.6) (0.22) 1981 4.3 7,137.4 0.52 10 20,676.7 0.94
(6.54) (12,171.9) (0.5) (7.5) (16,882.6) (0.24) 1982 4.34 6,717.7 0.47 9.8 19,910.2 0.93
(7.6) (13,546.8) (0.5) (8.1) (16,729.9) (0.25) 1983 3.9 6,368.8 0.47 9.7 20,326.1 0.92
(6.6) (10,642.2) (0.49) (7.9) (17,790.3) (0.27) 1984 4.4 7,799.5 0.49 10.2 21,454.9 0.92
(7.2) (12,608.6) (0.5) (8.7) (19,390.5) (0.27) 1985 4.6 7,856.3 0.5 10.3 21,474.6 0.93
(7.9) (13,165.6) (0.5) (9.3) (19,543.5) (0.26) 1986 4.3 7,265.9 0.47 10.1 21,327.6 0.91
(7.5) (12,163.5) (0.5) (8.7) (19,279.8) (0.28) 1987 4.4 7,852.5 0.49 10.2 21,883.6 0.92
(7.3) (12,377.9) (0.5) (8.8) (20,115.9) (0.27) 1988 5.3 8,701.4 0.5 10.4 22,774.6 0.92
(9.5) (14,722.1) (0.5) (8.8) (20,705.3) (0.27)
Figure 1
Departure of Log (Annual Earnings) for Disabled Men with Different Observed Disability Histories
Disabled men experience a precipitous drop in expected annual earnings around the measured date of onset. Consistent with the idea that disability histories with more post-onset reports of disability indicate greater chronicity, the graph indicates that this immediate ‘‘drop’’ as we shall henceforth call it, is larger the more chroni-cally disabled the man happens to be. Men who always report disability after onset have annual earnings 23 percent lower than expected levels in the year of onset. At the other extreme, men who are only disabled in the onset year have annual earnings less than expected levels by about 10 percent. Among all other disabled men, whose levels of disability chronicity range between these two extremes, there is an annual earnings shortfall in the year of onset of about 17 percent.
After the annual earnings ‘‘drop,’’ there is a period of recovery over the next two years. This ‘‘recovery’’ differs across the different disability histories also. For the least seriously disabled men (only those with no post-onset reported disabilities) the earnings recovery is large enough to make annual earnings only about 1 percent less than expected. The most seriously disabled men have earnings 11 percent lower than expected two years after onset, and all other disabled men have an annual earnings shortfall of 8 percent at the same time.
Figure 2
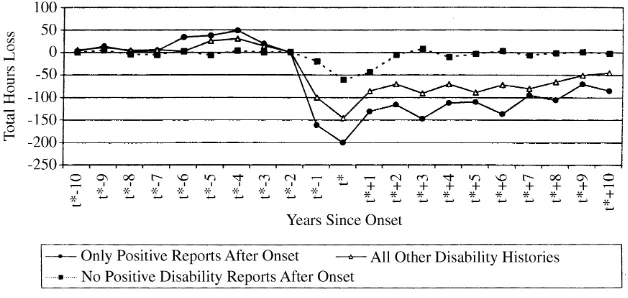
Departure of Annual Hours of Work from Expected Levels for Disabled Men
earnings trend modestly upward, so that they are only 8 percent less than expected ten years after onset.
Figure 2 shows that annual hours losses account for most of the changes in annual earnings from disability. The patterns of the slight ‘‘jump,’’ the precipitous ‘‘drop,’’ the short-term ‘‘recovery,’’ and then the long-run trend are all evident in the behavior of annual hours of work. The figure shows that hours losses are dramatic; the most seriously disabled men work more than 200 hours a year less than expected in the onset year, and even the least seriously disabled men have an annual hours shortfall of about 60 hours. If a standard 40-hour pre-onset work week is assumed, these results indicate that the most seriously disabled man will work about 1.25months less than expected in the onset year, while his much less chronically disabled counter-part works about one and a half fewer weeks.
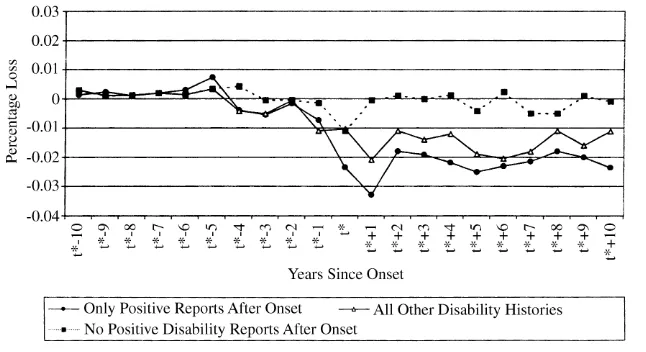
Figure 3 depicts estimated losses in average hourly wages. The figure indicates the relatively unimportant role played by wage losses in explaining losses in an-nual earnings. For no type of disabled man are hourly earnings less than expected levels by as much as 4 percent in any post-onset year. For the least seriously dis-abled men in the sample, there is no obvious pattern in hourly earnings at all. For other disabled men, the patterns of the ‘‘drop’’ and ‘‘recovery’’ earlier discussed for annual earnings and for hours are evident for wages as well, though on a much smaller scale than for the other two earnings measures. Also, for these two groups of disabled men there appears to be a downward trend in wages after the recovery period.
Figure 3
Departure of Log(Hourly Earnings) from Expected Levels
VI. Worker Characteristics and the Effects of
Disability
The previous section suggests that earnings losses for disabled men appear to occur in three discrete portions: A ‘‘jump’’ from four to two years before onset; a ‘‘drop’’ spanning the interval from one year before onset to one year after; and a sharp ‘‘recovery’’ that occurs over the two years after onset. A simple way to summarize the effect of a particular characteristic (such as onset age) on earnings losses is to interact the characteristics in question with variables denoting these ‘‘jump,’’ ‘‘drop,’’ and ‘‘recovery’’ time periods. To account for the fact that tempo-ral losses vary with the chronicity of a man’s condition, controls for disability history are included among the interactions.
Using the same estimation technique as with Equation 1, we estimate
(2) Yit ⫽αi⫹wit⫹gt⫹Xitb⫹q1Fjumpit ⫹q2Fdropit ⫹q3Frecit ⫹q4Ftrendit
⫹a˚jh1j(Fjumpit ∗Eji)⫹a˚jh2j(Fdropit ∗Eji)⫹a˚jh3j(Frecit ∗Eji)
⫹a˚jh4j(Ftrend∗Eji)⫹eit
In Equation 2,Fjump
it is an indicator variable that equals 1 if the yeartis any of the years four to two periods before a disabled man’s date of onset.Fdrop
it equals 1 iftis either the year of onset or one year before onset.Frec
it equals 1 iftis either one year after onset or two years after onset. The variableFtrend
it is continuous; it equals 1 three years after onset, 2 four years after onset, and so forth. The coefficientsqmeasure divide temporal earnings losses from disability into three discrete portions plus a trend term.
in the regression: The age of onset, race, education, and the disabled man’s post-onset disability history. For age of post-onset—the only continuous variable among the characteristics—Ej
itequals the disabled man’s age of onset minus the mean over all disabled men. For the other characteristics,Ej
itare indicator variables which denote whether a man: (a) is white or nonwhite; (b) has more than 13 years of schooling or not; and (c) has a post-onset disability history of no reports after onset, only positive reports after onset, or some other history. Because the regression controls for all the effects of all of these characteristics simultaneously, the estimated effect for a characteristic such as onset age accounts for any relationship between disability chronicity and onset age.
The regression imposes the restriction that
(3) a˚jijnj,i⫽1,2,3,4
wherenjis the number of disabled persons in groupj. The variableϕij,i⫽1,2,3,4,5 are therefore coefficients which measure the relative size of the pre-onset jump, the drop, recovery and trend effects for persons in groupj.21
Table 4 presents the results of estimation of Equation 2. The first row shows that whereas the ‘‘jump’’ term is not statistically significant, the ‘‘drop,’’ ‘‘recovery,’’ and ‘‘trend’’ terms are all strongly so for each of the earnings measures. That is, earnings losses from disability appear to be well summarized by Equation 2: (i) earnings drop dramatically around the time of onset, recover about half that loss in the first two years after onset; then trend slowly upward to expected levels over the next eight years; and (ii) hours losses rather than wages account for most of the earnings losses. The table’s second row indicates that the results for disability history are also consistent with results from the previous section. For example, what we have termed the least chronically disabled men (those with no reports of disability after onset) have an annual earnings ‘‘drop’’ 8 percentage points smaller than the average drop. On the other hand, the most chronically disabled men (those who always report a disability every year after onset) have a drop that is 6 percentage points larger than the percentage drop of 15 percent.
A. The Effect of Onset Age
The numbers in bold are the key results in this table. They are the estimated effects of onset age on expected annual earnings losses. Notice that because the regression controls for disability chronicity, these estimates adjust to a significant degree for any correlation between onset age and disability chronicity. The results indicate that for each of the earnings measures, and consistent with the human capital disability framework discussed earlier, the immediate ‘‘drop’’ a disabled man suffers at the time of onset is smaller the younger he is at onset. We estimate that if a man is ten years older than the mean onset age of 39, the immediate drop in his annual earnings at the time of onset is 5 percentage points larger than the average ‘‘drop’’ of 15 percent. His hours losses are 59 hours more than the sample average, and his wage loss is one percentage point larger than the sample average of 2 percent.
Charles
635
Log (Annual Earnings) Annual Hours Log(Hourly-Earnings)
Jump Drop Recovery Trend Jump Drop Recovery Trend Jump Drop Recovery Trend
Level Effects 0.003 ⫺0.15 0.08 0.003 4.3 ⫺121.4 75.2 4.5 0.001 ⫺0.02 0.01 0.0003 (0.04) (0.05) (0.03) (0.001) (7.4) (27.4) (20.4) (0.9) (0.6) (0.01) (0.01) (0.001) Interactions
Disability history
No Post-onset reports 0.002 0.08 0.01 0.001 1.3 85.2 1.3 2.1 0.002 0.03 0.01 0.0004 (0.04) (0.02) (0.01) (0.001) (2.4) (19.4) (0.4) (0.001) (0.04) (0.01) (0.01) (0.0001) Only positive reports ⫺0.003 ⫺0.06 ⫺0.004 ⫺0.0004 ⫺4.4 ⫺68.4 ⫺25.1 ⫺5.2 ⫺0.001 ⫺0.02 ⫺0.01 ⫺0.0003
(0.001) (0.02) (0.02) (0.001) (1.4) (13.5) (9.4) (1.7) (0.001) (0.01) (0.02) (0.0001) Other disability histories ⫺0.001 0.03 ⫺0.03 ⫺0.001 3.4 39.1 ⫺8.3 ⫺4.1 ⫺0.001 0.02 0.02 0.0001
(0.001) (0.01) (0.01) (0.001) (4.4) (11.1) (2.5) (1.1) (0.001) (0.01) (0.01) (0.0001) Onset age ⫺0.01 ⫺0.005 ⫺0.003 ⫺0.0003 0.3 ⫺5.88 ⫺1.2 ⫺0.5 ⫺0.01 ⫺0.002 ⫺0.004 ⫺0.0001
(0.3) (0.001) (0.002) (0.00001) (4.1) (0.6) (0.4) (0.001) (0.3) (0.003) (0.004) (0.0001) Race
White 0.04 0.05 0.02 0.001 2.1 26.3 ⫺10.1 3.3 0.03 0.01 0.01 0.002 (0.1) (0.01) (0.01) (0.0004) (3.9) (9.1) (3.02) (0.1) (1.2) (0.01) (0.01) (0.01) Nonwhite ⫺0.03 ⫺0.03 ⫺0.01 ⫺0.002 ⫺1.9 ⫺31.4 8.13 ⫺5.08 ⫺0.02 ⫺0.01 ⫺0.01 ⫺0.003
(0.02) (0.01) (0.005) (0.001) (4) (14.5) (4.9) (0.03) (1.4) (0.005) (0.005) (0.02) Education (in years)
13 or more 0.001 0.04 0.03 0.0001 0.1 43.4 18.5 3.3 0.01 0.02 0.03 0.002 (0.1) (0.01) (0.01) (0.0001) (3.4) (10.1) (3.6) (0.1) (0.8) (0.005) (0.01) (0.01) 12 or less ⫺0.03 ⫺0.03 ⫺0.02 ⫺0.0001 ⫺0.4 ⫺37.3 ⫺21.1 ⫺2.4 ⫺0.01 ⫺0.04 ⫺0.02 ⫺0.002
(0.05) (0.01) (0.005) (0.02) (2.1) (14.5) (5.2) (0.3) (1.3) (0.005) (0.005) (0.02)
Adj–R2 0.22 0.23 0.15
The behavior of earnings after the drop is also consistent with the human capital disability framework. Just as being older at onset causes the drop to be larger, it causes the short-run recovery to be smaller. Being ten years older at onset than the sample mean translates into a recovery that is three percentage points smaller than the average recovery of 8 percent. Finally, the long-run trend in earnings after the short-run recovery suggest that whereas the average disabled man can expect to see his annual earnings trend upward 0.3 percent each year after his second post-onset year, being ten years older than the average onset age results in there being no upward long-run trend in annual earnings whatever, after the short-run recovery. The results indicate that for all ages of onset, changes in annual hours drive the results for changes in annual earnings, which confirm the predictions of the human capital framework.22
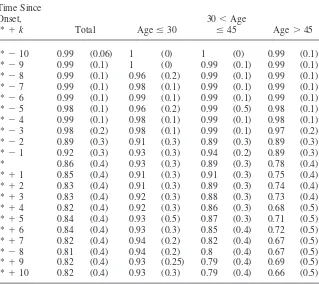
An interesting question is whether post-onset changes in annual hours stem from changes in per person labor supply, holding the employment rate constant, or from changes in the employment rates, holding constant average hours of work among those who work. Table 5 presents employment rates for years,k⫽ ⫺10, . . . , 10, for disabled men. The four columns are employment rates in the years around the date of onset,t*, for the entire disabled sample and for three age-disaggregated segments of the disabled sample. The first column reveals that overall there is no deviation from full employment before the second period before onset. Then, there appears to be level reduction in employment rates after the second post-onset period. The last three columns show that men youngest at onset have employment rates that never fall below 91 percent. For these men, annual hours changes after onset appear to be the result of changing intensity of labor supply: employment rates are constant, average hours of work first fall then rise. Among the two older age of onset groups employment rates fall dramatically after onset. For these men, short-term post-onset annual hours losses seem to come mainly from reduced probability of labor participation. But the fact that there is evidence of an upward trend in earnings for some of these men suggests that hours of work among those who continue to work rise gradually in the long run.
B. The Effects of Race and Education
Table 4 also depicts the results for race and education. Like results in the other rows, the pre-onset ‘‘jump’’ is not statistically different from zero. Losses after onset do differ by race, however. Overall, it appears that work-limiting disability is worse for nonwhites. The annual earnings ‘‘drop’’ experienced by whites is smaller, and the recovery in annual earnings larger. There is also a significant racial difference in the long-run trend in expected earnings after the period of short-term recovery. For both annual earnings and hours, earnings trend upward toward expected levels
Table 5
Employment Rates Among Disabled Workers k Periods After Onset, by Age of Onset. (Standard deviation in parentheses.)
Time Since
Onset, 30⬍Age
t*⫹k Total Ageⱕ30 ⱕ45 Age⬎45
t*⫺10 0.99 (0.06) 1 (0) 1 (0) 0.99 (0.1)
t*⫺9 0.99 (0.1) 1 (0) 0.99 (0.1) 0.99 (0.1)
t*⫺8 0.99 (0.1) 0.96 (0.2) 0.99 (0.1) 0.99 (0.1)
t*⫺7 0.99 (0.1) 0.98 (0.1) 0.99 (0.1) 0.99 (0.1)
t*⫺6 0.99 (0.1) 0.99 (0.1) 0.99 (0.1) 0.99 (0.1)
t*⫺5 0.98 (0.1) 0.96 (0.2) 0.99 (0.5) 0.98 (0.1)
t*⫺4 0.99 (0.1) 0.98 (0.1) 0.99 (0.1) 0.98 (0.1)
t*⫺3 0.98 (0.2) 0.98 (0.1) 0.99 (0.1) 0.97 (0.2)
t*⫺2 0.89 (0.3) 0.91 (0.3) 0.89 (0.3) 0.89 (0.3)
t*⫺1 0.92 (0.3) 0.93 (0.3) 0.94 (0.2) 0.89 (0.3)
t* 0.86 (0.4) 0.93 (0.3) 0.89 (0.3) 0.78 (0.4)
t*⫹1 0.85 (0.4) 0.91 (0.3) 0.91 (0.3) 0.75 (0.4)
t*⫹2 0.83 (0.4) 0.91 (0.3) 0.89 (0.3) 0.74 (0.4)
t*⫹3 0.83 (0.4) 0.92 (0.3) 0.88 (0.3) 0.73 (0.4)
t*⫹4 0.82 (0.4) 0.92 (0.3) 0.86 (0.3) 0.68 (0.5)
t*⫹5 0.84 (0.4) 0.93 (0.5) 0.87 (0.3) 0.71 (0.5)
t*⫹6 0.84 (0.4) 0.93 (0.3) 0.85 (0.4) 0.72 (0.5)
t*⫹7 0.82 (0.4) 0.94 (0.2) 0.82 (0.4) 0.67 (0.5)
t*⫺8 0.81 (0.4) 0.94 (0.2) 0.8 (0.4) 0.67 (0.5)
t*⫹9 0.82 (0.4) 0.93 (0.25) 0.79 (0.4) 0.69 (0.5)
t*⫹10 0.82 (0.4) 0.93 (0.3) 0.79 (0.4) 0.66 (0.5)
Data from Panel Study of Income Dynamics.
in the years more than two years after onset, but trend away from expected levels for nonwhites. Because of this difference in the trends in earnings losses by race, work-limiting disability appears to exact a larger long-term toll on nonwhites.
C. Industry, Occupation Switching as Source of Adjustment?
The regressions presented in Table 4 do not control for a man’s industry or occupa-tion. Because people can change these affiliations, neither is a ‘‘characteristic’’ in the sense of onset age, race, or education. Rather, a man’s industry or occupation seems an obvious example of how people might adjust to the onset of their disability; changes in these affiliations after onset may represent a type of disability capital. What role does industry affiliation play in explaining the overall loss patterns from disability and for different types of disabled men?
To account for the effect of industry, we add a series of dummy variables for industry and occupation to Regression 2. If switching industry and occupation has an effect on average loss patterns—jump, drop, recovery, and trend—then the inclu-sion of these dummies should change the estimated coefficientsq. Moreover, to the extent that differences between different groups of workers (say, whites and non-whites) derive from differences in the propensity to switch industries, the coefficients jshould change accordingly. For example, in the case whereallof the differences between whites and nonwhites in the ‘‘recovery’’ is from a differential racial propen-sity to switch, then the coefficient on the race interaction terms for the ‘‘recovery’’ should be statistically indistinguishable from 0.
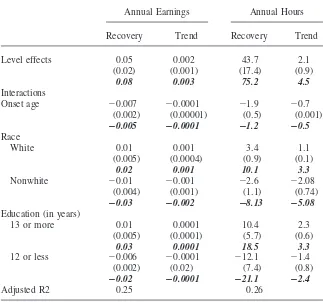
Table 6 summarizes the salient features of the regressions, after industry and occu-pation are controlled for. Because the results for wages appear to be relatively unim-portant for the post-onset temporal pattern of annual earnings changes, we study only annual earnings and hours. Also, controlling for industry and occupation changes neither the ‘‘jump,’’ nor the ‘‘drop’’ level terms, nor any of their interac-tions. The table therefore presents the results for the estimated ‘‘recovery’’ and ‘‘trend’’ terms only. For ease of comparison, the table includes (in bold and italics) the coefficient for the same term from Table 4.
The table’s first row shows that the short-term recovery is smaller, once we ac-count for industry and occupation are. For example, rather than the recovery in an-nual earnings of 8 percent, these regressions find a recovery of 5 percent. The results for annual hours are similar. These results show, in effect, that almost one half of the recovery men are estimated to make in the two years after onset seems to be the result of changes in industry and occupation. The results for the long-term trend growth in earnings are similar: annual increases in expected earnings growth in the years more than two years after onset are about half as large once we control for industry and occupation.
The remaining entries in the table present the results for the various interactions. We find that the estimated effect of onset age on recovery and trend are larger once industry and occupation are accounted for. In other words, these results show that the larger recovery and trend growth documented for men who are younger at onset stems from the greater propensity of these men to switch their industries in the time after onset. Notice that this is perfectly consistent with the human capital framework for disability described above.
Table 6
Losses From Disability for Various types of Disabled Men, Controlling for Industry and Occupation. (Robust standard errors in parentheses, estimated coefficients from Table 4 in bold italics.)
Annual Earnings Annual Hours
Recovery Trend Recovery Trend
Level effects 0.05 0.002 43.7 2.1
(0.02) (0.001) (17.4) (0.9)
0.08 0.003 75.2 4.5 Interactions
Onset age ⫺0.007 ⫺0.0001 ⫺1.9 ⫺0.7
(0.002) (0.00001) (0.5) (0.001)
ⴚ0.005 ⴚ0.0001 ⴚ1.2 ⴚ0.5 Race
White 0.01 0.001 3.4 1.1
(0.005) (0.0004) (0.9) (0.1)
0.02 0.001 10.1 3.3
Nonwhite ⫺0.01 ⫺0.001 ⫺2.6 ⫺2.08
(0.004) (0.001) (1.1) (0.74)
ⴚ0.03 ⴚ0.002 ⴚ8.13 ⴚ5.08 Education (in years)
13 or more 0.01 0.0001 10.4 2.3
(0.005) (0.0001) (5.7) (0.6)
0.03 0.0001 18.5 3.3
12 or less ⫺0.006 ⫺0.0001 ⫺12.1 ⫺1.4
(0.002) (0.02) (7.4) (0.8)
ⴚ0.02 ⴚ0.0001 ⴚ21.1 ⴚ2.4
Adjusted R2 0.25 0.26
Regressions are identical to those presented in Table 4, except for the addition of controls for industry affiliation in every year. The coefficient in bold is the regression coefficient, and the entry in parenthesis is the standard error of the estimate. The last entry in each cell (in bold and italics) is the estimated coefficients from Table 4, which is presented here for ease of comparison. The table does not show results for the ‘‘jump’’ and ‘‘drop’’ terms, which are indistinguisable from results in Table 4. See text for explana-tion. Data from Panel Study of Income Dynamics.
VII. Conclusion
This paper answers two main questions: How do the earnings losses suffered by work-limited disabled men evolve over time? And: How do a man’s characteristics, especially the age at which he suffers onset, affect these expected earnings losses? Apart from the fact that it studies earnings losses over time rather than the point-in-time estimates that have been predominate in the literature, the paper’s other main innovation is its use of the panel structure of available binary disability reports to exploit an important source of heterogeneity among men who ever report a disability: The fact that their post-onset histories of such reports differ markedly. Controlling for these disability histories means that the analysis controls for at least one dimension of disability ‘‘severity’’—that of chronicity.
The results indicate that disabled men suffer a sharp drop in annual earnings around the date of onset. There is then a dramatic recovery in the first two years after onset. Next follows a period during which earnings trend very modestly upward toward expected levels, but this upward trend is insufficient to prevent rather significant earnings losses ten years after onset. Most of the changes in annual earnings seem to derive from changes in annual hours of work, rather than from changes in wages. We find that being older at onset, nonwhite, and less educated exacerbate earnings losses, and diminish the degree to which earnings recover in both the short and long term.
The paper argues that these patterns are consistent with a conceptual framework in which both the losses and recovery from disability are thought of in a human capital context, wherein disability destroys accumulated human capital of a certain type and encourages investment in other types. Consistent with this view, we find that much of this difference across different groups of workers appears to derive from differing industry and occupational affiliation after onset. We note that absent very detailed medical information, it is impossible to reject the idea that the post-onset loss patterns actually derive from ‘‘recovery’’ in a strictly medical sense of the term. However, if the human capital argument presented in this paper is correct, then these findings may have implications for disability policy. Government assis-tance that is targeted at this brief, crucial period may prevent, or substantially lessen the large long-term earnings losses brought on by disability.
Table A1
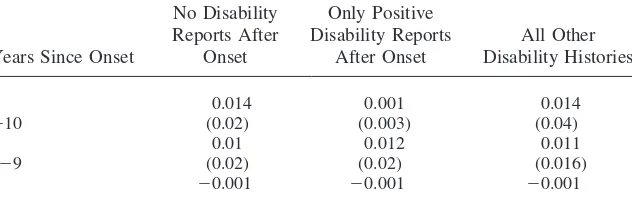
Results For Regression 1. Three Series of Sets of ‘‘Years Since Onset Dummy Variables for Different Disability Histories. Outcome: Log (annual earnings). (Standard errors in parentheses.)
No Disability Only Positive
Reports After Disability Reports All Other
Years Since Onset Onset After Onset Disability Histories
0.014 0.001 0.014
⫺10 (0.02) (0.003) (0.04)
0.01 0.012 0.011
⫺9 (0.02) (0.02) (0.016)
Table A1(continued)
No Disability Only Positive
Reports After Disability Reports All Other
Years Since Onset Onset After Onset Disability Histories
⫺8 (⫺0.001) (0.004) (0.002)
⫺0.001 0.01 0.01
⫺7 (0.001) (0.006) (0.006)
⫺0.001 0.01 0.01
⫺6 (0.001) (0.006) (0.005)
0.01 0.038 0.019
⫺5 (0.006) (0.02) (0.012)
⫺0.002 0.034 0.025
⫺4 (0.001) (0.019) (0.018)
⫺0.002 0.013 0.014
⫺3 (0.002) (0.01) (0.012)
0.003 0.004 0.003
⫺2 (0.002) (0.005) (0.002)
⫺0.028 ⫺0.182 ⫺0.145
⫺1 (0.01) (0.04) (0.04)
⫺0.095 ⫺0.24 ⫺0.158
0 (0.04) (0.08) (0.06)
⫺0.02 ⫺0.132 ⫺0.104
1 (0.01) (0.037) (0.039)
⫺0.007 ⫺0.108 ⫺0.088
2 (0.003) (0.04) (0.034)
⫺0.042 ⫺0.138 ⫺0.092
3 (0.054) (0.055) (0.04)
0.003 ⫺0.132 ⫺0.1
4 (0.005) (0.051) (0.04)
0.004 ⫺0.136 ⫺0.09
5 (0.003) (0.048) (0.037)
⫺0.004 ⫺0.154 ⫺0.098
6 (0.006) (0.06) (0.048)
⫺0.002 ⫺0.14 ⫺0.102
7 (0.02) (0.05) (0.055)
⫺0.014 ⫺0.149 ⫺0.074
8 (0.023) (0.068) (0.036)
0.016 ⫺0.138 ⫺0.066
9 (0.02) (0.049) (0.04)
⫺0.015 ⫺0.157 ⫺0.085
10 (0.04) (0.07) (0.048)
Inverse Mills Ratio 0.178 (0.27) R-Squared 0.24
Table A2
Results For Regression 1. Three Series of Sets of ‘‘Years Since Onset Dummy Variables for Different Disability Histories. Outcome: annual hours. (Standard errors in parentheses.)
No Disability Only Positive
Reports After Disability Reports All Other
Years Since Onset Onset After Onset Disability Histories
0.49 3.11 5.49
⫺10 (1.34) (7.32) (8.42)
4.62 13.75 10.63
⫺9 (7.36) (15.82) (9.12)
⫺3.55 2.85 4.35
⫺8 (5.3) (12.01) (2.83)
⫺5.18 3.74 6.01
⫺7 (6.2) (4.42) (4.23)
2.26 34.35 2.26
⫺6 (5.16) (31.71) (3.82)
⫺6.16 37.56 25.96
⫺5 (8.72) (44.82) (13.01)
4.23 48.49 30.23
⫺4 (5.5) (38.11) (18.93)
0.54 19.05 14.54
⫺3 (1.83) (25.84) (18.28)
0.85 ⫺0.64 0.85
⫺2 (1.95) (2.73) (6.92)
⫺20.07 ⫺161.09 ⫺100.07
⫺1 (4.79) (33.73) (39.72)
⫺60.57 ⫺200.05 ⫺145.57
0 (25.72) (48.94) (48.86)
⫺43.91 ⫺130.43 ⫺85.91
1 (18.67) (49.14) (39.73)
⫺5.47 ⫺115.83 ⫺70.46
2 (8.53) (73.45) (28.11)
8.06 ⫺147.21 ⫺90.79
3 (10.72) (74.24) (39.62)
⫺10.19 ⫺111.68 ⫺70.19
4 (9.82) (47.83) (27.48)
⫺3.02 ⫺109.50 ⫺89.02
5 (4.8) (52.94) (36.99)
2.96 ⫺136.31 ⫺71.96
6 (4.6) (77.18) (40.04)
⫺6.07 ⫺94.24 ⫺80.07
7 (6.11) (57.77) (39.42)
Table A2(continued)
No Disability Only Positive
Reports After Disability Reports All Other
Years Since Onset Onset After Onset Disability Histories
8 (4.73) (54.83) (27.73)
1.01 ⫺70.17 ⫺50.63
9 (6.2) (40.06) (22.93)
⫺2.34 ⫺85.29 ⫺45.34
10 (2.83) (52.49) (21.73)
Inverse Mills Ratio 0.21 (0.14)
R-Squared 0.24
This table presents the results of a single regression. The entries are the estimated coefficients for the ‘‘years since onset’’ dummy variables associated with the different types of disability histories. The regres-sion controls for age, age squared, region and marital status. Data from Panel Study of Income Dynamics. See text for explanation.
Table A3
Results For Regression 1. Three Series of Sets of ‘‘Years Since Onset Dummy Variables for Different Disability Histories. Outcome: Log (hourly earnings). (Standard errors in parentheses.)
No Disability Only Positive
Reports After Disability Reports All Other
Years Since Onset Onset After Onset Disability Histories
0.003 0.001 0.003
⫺10 (0.03) (0.002) (0.04)
0.001 0.002 0.001
⫺9 (0.007) (0.002) (0.003)
0.001 0.001 0.001
⫺8 (0.032) (0.002) (0.02)
0.002 0.002 0.002
⫺7 (0.025) (0.003) (0.003)
0.001 0.003 0.001
⫺6 (0.001) (0.002) (0.002)
0.003 0.007 0.003
⫺5 (0.003) (0.003) (0.001)
0.004 ⫺0.004 ⫺0.004
⫺4 (0.003) (0.004) (0.003)
Table A3(continued)
No Disability Only Positive
Reports After Disability Reports All Other
Years Since Onset Onset After Onset Disability Histories
⫺3 (0.003) (0.004) (0.003)
⫺0.001 ⫺0.002 ⫺0.001
⫺2 (0.004) (0.001) (0.004)
⫺0.002 ⫺0.007 ⫺0.011
⫺1 (0.001) (0.005) (0.006)
⫺0.011 ⫺0.023 ⫺0.01
0 (0.005) (0.01) (0.005)
⫺0.001 ⫺0.032 ⫺0.021
1 (0.0004) (0.01) (0.006)
0.001 ⫺0.02 ⫺0.01
2 (0.001) (0.02) (0.005)
⫺0.0001 ⫺0.02 ⫺0.014
3 (0.001) (0.02) (0.006)
0.001 ⫺0.02 ⫺0.012
4 (0.02) (0.02) (0.011)
⫺0.004 ⫺0.025 ⫺0.019
5 (0.006) (0.021) (0.009)
0.002 ⫺0.023 ⫺0.02
6 (0.004) (0.018) (0.02)
⫺0.005 ⫺0.021 ⫺0.018
7 (0.003) (0.015) (0.009)
⫺0.005 ⫺0.018 ⫺0.011
8 (0.006) (0.01) (0.01)
0.001 ⫺0.02 ⫺0.016
9 (0.002) (0.016) (0.004)
⫺0.001 ⫺0.023 ⫺0.01
10 (0.001) (0.017) (0.004)
Inverse Mills Ratio 0.1504 (0.95)
R-Squared 0.18
References
Abowd, John M., and David Card. 1989. ‘‘On the Covariance Structure of Earnings and
Hours Changes.’’Econometrica57:411–45.
Ashenfelter, Orley, and David Card. 1985. ‘‘Using the Longitudinal Structure of Earnings
to Estimate the Effect of Training Programs.’’Review of Economics and Statistics67:
648–60.
Baldwin, Marjorie, and William G Johnson. 1994. ‘‘Labor Market Discrimination against
Men with Disabilities.’’Journal of Human Resources29(1):1–19.
Bennefield, Robert L. and John M Mcneil, ‘‘Labor Force States and Other Characteristics
of Persons with Work Disabilities 1981–1988.’’Current Population Reports, Special
Se-ries No. 160. p. 23. Washington, D.C.: United States Department of Commerce, Bureau of the Census.
Ben-Porath, Yoram. 1967. ‘‘The Production of Human Capital and the Life-Cycle of
Earn-ings.’’Journal of Political Economy75(4):352–65.
Benitez-Silva, Hugo, Moshe Buchinsky, Hiu-Man Chan, John Rust, and Sofia Sheivasser. 1998. ‘‘An Empirical Analysis of the Social Security Disability Application, Appeal, and Award Process.’’ Mimeo.
Berkowitz, Monroe, and Anne M Hill, 1986.Disability Policy and the Labor Market.
Ith-aca, NY: ILR Press.
Bils, Mark. 1985. ‘‘Real Wages Over the Business Cycle: Evidence from Panel Data.’’
Journal of Political Economy94(4):666–98.
Borjas, George J. 1982. ‘‘The Earnings of Male Hispanic Immigrants in the United
States.’’Industrial and Labor Relations Review35:343–53.
———.1985. ‘‘Assimilation, Changes in Cohort Quality, and the Earnings of
Immi-grants.’’Journal of Labor Economics3:463–89.
Bound, John. 1989. ‘‘The Health and Earnings of Rejected Disability Insurance
Appli-cants.’’American Economic Review79:482–503.
Bound, John, and Timothy Waidman. 1992. ‘‘Disability Transfers and Self-Reported Health and the Labor Force Attachment of Older Men: Evidence from the Historical
Rec-ord.’’Quarterly Journal of Economics4:1393–1419.
Burkhauser, Richard V. 1990. ‘‘Morality on the Cheap: The Americans with Disabilities
Act.’’Regulation13 (Spring):47–56.
Burkhauser, Richard V., and Mary C. Daly 1993. ‘‘Work and Economic Well-Being: A National Comparison of German and American People with Disabilites.’’ Cross-National Studies in Aging Program Project Paper No. 5., The Gerontology Center, Syra-cuse University.
Card, David, and Daniel Sullivan. 1988. ‘‘Measuring the Effect of Subsidized Training
Pro-grams on Movements in and Out of Employment.’’Econometrica56:497–530.
Chirikos, Thomas N., and Gilbert Nestel, 1985. ‘‘Further Evidence on the Economic
Ef-fects of Poor Health.’’Review of Economics and Statistics65:61–69.
Chowdhury, Gopa, and Stephen Nickell, 1985. ‘‘Hourly Earnings in the United States: An-other Look at Unionization, Schooling, Sickness and Unemployment Using P.S.I.D.
Data.’’Journal of Labor Economics3:38–69.
Currie, Janet, and Brigitte Madrian. 1999. ‘‘Health, Health Insurance, and the Labor
Mar-ket.’’ InHandbook of Labor Economics, vol 3c, ed. Orley Ashenfelter and David Card.
Amsterdam: North Holland.
Frisch, R., and F. Waugh, 1933. ‘‘Partial Time Regressors as Compared with Individual
Trends.’’Econometrica1:387–401.
Greene, William H.Econometric Analysis. 1990. New York: MacMillan Publishing
Haveman, Robert H., and Barbara L. Wolfe. 1984. ‘‘Disability Transfers and Early
Retire-ment: A Causal Relationship.’’Journal of Public Economics22 (June):47–66.
———.1990. ‘‘The Economic Well-Being of the Disabled 1962-84.’’Journal of Human
Resources24(1):32–54.
Heckman, James J., and Richard Robb. 1985. ‘‘Alternative Methods for Evaluating the
Im-pact of Interventions.’’ InLongitudinal Analysis of Labor Market Data, ed. James J.
Heckman and Burton Singer, 156–245. Cambridge: Cambridge University Press.
Hill, Martha. 1992.The Panel Study of Income Dynamics: A Users’ Guide. Beverly Hills,
Calif.: Sage Publications.
Hsiao, Cheng. 1986.Analysis of Panel Data. New York: Cambridge University Press.
Jacobson, Louis S., Robert J. Lalonde, and Daniel Sullivan. 1993. ‘‘Earnings Losses of
Dis-placed Workers.’’American Economic Review83:685–709.
Johnson, William G., and James Lambrinos. 1985. ‘‘Wage Discrimination against
Handi-capped Men and Women.’’Journal of Human Resources25(1):32–54.
Krueger, Alan, and Douglas Kruse. 1995. ‘‘Labor Market Effects of Spinal Cord Injuries in the Dawn of the Computer Age.’’ Princeton University. Mimeo.
Luft, Harold S. 1975. ‘‘The Impact of Poor Health on Earnings.’’Review of Economics
and Statistics57:43–57
Murphy, Kevin M., and Finis Welch. 1990. ‘‘Empirical Age-Earnings Profiles.’’Journal of
Labor Economics8:202–22.
Parsons, Donald O. 1982. ‘‘The Male Labor Force Participation Decision: Health,
Re-ported Health, and Economic Incentives.’’Econometrica49:81–91.
———.1980. ‘‘The Decline in Male Labor Force Participation.’’Journal of Political
Econ-omy88(1):117–34.
Rosen, Sherwin 1991. ‘‘Disability Accommodations and the Labor Market.’’ InDisability
&Work, ed. Carolyn Weaver, 18-30. Washington, D.C.:A.E.I. Press.
Rust, John. 1987. ‘‘A Dynamic Programming Model of Retirement Behavior.’’ National Bureau of Economic Research Working Paper: 2470.
Sickles, Robin and P. Taubman, 1986. ‘‘An Analysis of the Health and Retirement Status
of the Elderly.’’Econometrica54:1339–56.
Stern, Steven. 1989. ‘‘Measuring the Effects of Disability on Labor Force Participation.’’
Journal of Human Resources24(3):361–95.
Weaver, Carolyn. 1991. ‘‘Incentives versus Controls in Federal Disability Policy.’’ In
Dis-ability&Work, ed. Carolyn Weaver, 3–17. Washington, D.C.: A.E.I. Press.
Weaver, Carolyn, ed. 1991.Disability and Work. Washington, D.C.: A.E.I. Press.
Yelin, Edward H. 1989.Disability and the Displaced Worker. New Brunswick, N.J.:
Rut-gers University Press.
U.S. Senate. 1989.The American with Disabilities Act of 1989, 101st Congress, 1st