and Mathematics Faculty of SWCU in
In-donesia
Hanna Arini Parhusip
∗Abstract. Optimization problems in Science and Mathematics Faculty of SWCU are recalled here. The underlying theories are least square method, the properties of Hessian matrix of the residual functions and convexity of the objective functions and Karush Kuhn Tucker conditions. One observed that the given data may not support the used theories. Functions of Lagrange are analysed on the optimizers. The gradients of the obtained system are possible not zero.
Tke studied problems contain optimization of the used yeast on beans, stevioside and Mocorin (Modification Of Bisi 2 Variety Yellow Corn (Zea Mays L.) - Rice Brand Flour), food classification and optimization on rice harvesting. The possible update approaches on these topics are proposed in the final discussion of this paper.
Mathematics Subject Classification (2010). 90.58, 90.59, 90C20.
Keywords. least square, Hessian, Karush Kuhn Tucker condition, convex and concave
1. Introduction
Mathematical techniques in optimization are not easily known in food science though some problems in food production are oftenly dealing with optimization. One normally use his experience for doing an optimization. On the other hand, some efforts may be reduced due to additional knowledge in mathematics for solv-ing an optimization problem. This paper shows some examples ussolv-ing mathematical techniques (including some mathematical keywords) that must be satisfied to have an optimal solution. This paper is focus on optimization methods in food produc-tion.
One should aware that before an optimization theory is applied, one needs to analyze whether the given data support enough to achieve an optimal solution (a maximum or a minimum). There are several necessary conditions must be satisfied. An objective function should be convex in a convex domain for searching a minimum solution. A concavity of an objective function is required for setting up a maximization problem. Additionally, a Hessian matrix of its Lagrangian function must also be taken into account. This paper addresses this consideration based on
some optimization problems from Science and Mathematics Faculty of SWCU in Indonesia in 2011-2013.
There are two objective functions required to set up optimization problem based on the given data,i.e the first objective function is due to parameter determination and the second one is due to optimal values of the obtained objective function after the parameters are found.
2. Nonlinear Optimization of parameters and its
Hessian matrix
Parameters of an objective function must be determined by minimizing errors. In general case, one has a vector y ∈ D ⊂ ℜn and its approximation is modelled
by a continuous ey as its model where the sum squared distances are minimized, i.e min R(a) = P{yi−yei(x,a)}
2
with x ∈ ℜn and the vector of parameters
a∈ ℜm, m << n.
Singularity oftenly occurs for m≥ n. Sincey is assumed to be a dependent variable ofx, the critical condition is designed by satisfying ∇aR =0∈ ℜm. As
a result, a nonlinear system occurs and its solution a∗ must be the optimizer of
R. Since numerical approaches might be oftenly used to get a∗, this vector a∗
must be analyzed its optimality before the optimization of the objective function is proceeded. This is done by evaluating the Hessian ofRata∗.
Let us denote R=gT ·gwhere g= [g1, g2, ..., gn]T andgi =yi−eyi{x,a}fori=
1, .., n. Therefore ∇aR= [∂Ra1, ∂Ra2, ..., ∂Ram]
T. One yields∂R
aj = 2g· ∇ajg. The diagonal components of the Hessian of R contain ∂2R
∂aj2 and its off diagonal
Nonlinear least squares frequently fail to have optimizers since nonconvexity ofR may occurs. A hybrid global optimization algorithm has been developed to handle such problems [11]. The functionRconvex if and only if ∀a,b∈⊂ ℜm
R(a) +∇aR·(a−b)≤R(b),∀a,b∈S ⊂ ℜ m
. (3)
This definition is difficult for a practical purpose since one has no information of S in general. Instead, the condition of Hessian matrix of R is considered for an initial analysis of the obtained parametersa.
Hessian matrix must be positive definite (nonnegative definite) to get minimum (locally) ofR, i.e the eigenvalues of Hessian matrix ofRmust be positive (nonneg-ative). Note that we seek the optimal a∗
∇aR=0which is mostly solved numerically. Clever initial guess of a may reach
a convergent solution. i.e its Hessian of R is positive definite. Additionally, the obtained parameterashould practically reasonable. Otherwise, one has to proceed an other least square by choosing an other assumption of an objective model before a further optimization. Thus, one may use Hessian matrix to select data such that optimization procedures fit to the used theories [9].
Example 1.
Using (x−a1)2+ (y−a2)2=w(x, y) to model stevioside as a function of time
and mass [8], this function achieves convexity ofR,i.e its Hessian ofR is positive definite for a∗
= [0.4295,0.8194]T ∈ S ⊂ R2
. However, this optimal value is meaningless for the practical purpose since the optimal of [x∗
, y∗
= [0.4201,0.8696,−0.0688]T leads to reasonable [x∗
, y∗
]T.
Other examples will be listed here to show to the reader that designing an objective function must be paid attention firstly and carefully.
2.1. Notes on programming.
Knowing a programming language is nowvery important and urgent. MATLAB in any up to date version is good pro-graming for food scientists. Additionally, there are many available functions easily used for a user. Functions that should be known for solving optimization prob-lems are fsolve.m for solving nonlinear system derived by gradient of the objective or Lagrangian function, lsqnonlin.m for minimizing residual due to parameter de-termination, fminsearch.m, fmincon.m are functions to minimize for some given constraints. Genetic algorithm is one of modern algorithms and this is also avail-able in MATLAB.
3. Optimization on Food Production
3.1. Optimality of rice harvest.
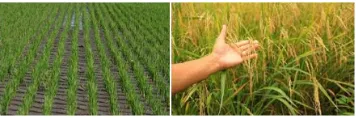
Naturally, September-December is aperiod of months to plan rice in Surakarta city Indonesia. This statement is taken due to the fact that in the raining season is the best period in Indonesia naturally. The research here will determine the best period of planting rice. There are 3 periods for planting,i.e January-April, May-August, September-December in 1992-2012. Additionaly, one must define 3 variables here that relate to rice production, i.e planting area (x), harvesting area (y) as shown in Figure 1 and rice production (S). Observe that the harvesting area may have greater area than the planting area shown Fig.1.
The first research based on an assumption thatS depends onxandy with S is a quadratic function [1],i.e
Figure 1. From left to right :planting area (left) and harvesting area (right) (taken from Web)
Table 1. Result of rice production due to optimization [2]
Period I Period II Period III Planting area (x) (ha) 132.9505 54.6966 120.4908 Harvesting area (y) (ha) 120.4864 105.2448 76.1586 Rice Production 61.7237 55.8306 60.4087
Ratio (y/S) 1.95 1.71 1.23
the components of matrixAand the vectorwcan be obtained easily by employing least square procedure. Note that the computed invers ofAis not exact. Actually, one has (A+E)−1
whereE is an error matrix with each component is nearly zero. By assumingAE−1
is small, the error relative for computing invers ofAis found to be bounded due to small enough condition number [2] [4].
According to the result in Table 1, the first period gives the optimal rice production. However, the rice production in period III is nearly the same as period I. The harvesting are in period I is greater than period III with less rice production. This condition occurs for several reasons, e.g the planting area contain the harvesting area and the area where unproducable and period I contains less water than period III due to the dry season in periodI. Additionally, the ratio shown in Table 1 is the largest one which describes the productivity of the planting area. This research has shown scientifically that the period III (September-December) is the optimal period for planting rice which is known naturally.
Singular Value Decomposition (SVD) has also been employed to have better approach of parameters in the quadratic function as the objective one,i.e solve
Av= S,A∈ ℜn×m
.
Note that thei-th row differs from theAobtained by the least square method, i.e
Ai= [xi2 yi2 xi yi xi yi 1].
The idea of SVD is that decomposing A to beA=UΣVT withAhas rankr
whereU ∈ ℜn×n,Σ∈ ℜn×m, the matrixU is a diagonal matrix and an orthogonal
matrix (U =UT) with its components are the eigenvalues ofAAT andV ∈ ℜm×m
Table 2. Error and conditional number of parameters in Eq. 4 due optimization result [2]
The used method Period I Period II Period III
error Least square 9.4% 13.8342% 18.5405%
error SVD 7.27% 11.89% 8.43%
conditional number Least square 23568 37013 22201
conditional number SVD 162.86 221.188 160.35
each period is also reduced. This observation is shown in Table 2. Each Hessian matrix ofRis positive semi definite which is sufficient condition to guarantee that the parameters have been optimal (minimizing the residuals).
The Ant Colony Algorithm (ACO) which is considered to be higher level than before was also used here for further technique of optimization,i.e optimizing the objective function on each period of . Unfortunately the ACO gives worse optimal points. However all approaches have lead to the same result that the period III is the best period to have maximum rice production [2].
3.2. Mocorin (Modification Of Bisi 2 Variety Yellow Corn
(Zea Mays L.)-Rice Brand Flour).
Five sets of data are taken from ob-servation of nutritional values of MOCORIN (Modification Of Bisi 2 Variety Yellow Corn (Zea Mays L.) - Rice Brand Flour) done in Chemistry Department of SWCU 2012 where some experiments were set up to study moisture content, mineral con-tent, protein content by biuret method, fat concon-tent, carbohydrate content by an-throne method, fiber content and making of tongue-cookies [6]. Assuming protein (P) as a biharmonic function of carbohydrate (K) and mass (M),i.eP(K,M),and hence one has 5 continuous objective functions. The functionP(K, M) is presented asP(K, M) =X(k)cos(nM) +X(k)sin(nM),(n= 2)
X(k) =c1enK+c2KenK +c3e−nK+c4Ke−nK.
Illustration of this function is depicted in Figure 2. The optimal parameters are
Figure 3. Left to right :Convexity of biharmonic function from the set of data with proportion of yellow corn and rice brand are 87.5%:12.5% (left) and 50%:50% (right) . The symbol o: denotes the right hand side of convex condition,*: denotes the left hand side of % convex condition. [6]
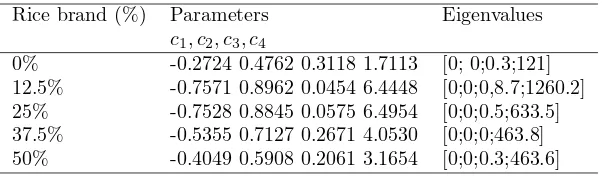
Table 3. Analysis of Residual (R) between harmonic function and data due to the eigen-values of Hessian of Residual (R)[6]
Rice brand (%) Parameters Eigenvalues
c1, c2, c3, c4
0% -0.2724 0.4762 0.3118 1.7113 [0; 0;0.3;121] 12.5% -0.7571 0.8962 0.0454 6.4448 [0;0;0,8.7;1260.2] 25% -0.7528 0.8845 0.0575 6.4954 [0;0;0.5;633.5] 37.5% -0.5355 0.7127 0.2671 4.0530 [0;0;0;463.8] 50% -0.4049 0.5908 0.2061 3.1654 [0;0;0.3;463.6]
determined by least square. From 5 data sets, we have the biharmonic functions are possible to be convex and concave. This is shown Fig. 3. Thus, one can not always pose only a minimization problem or vise versa. The practical application based on this result is that if the proportion of yellow corn and rice brand in the type of 87.5% : 12.5% and 50% : 50% then maximum protein will not be obtained. This research suggests that one may use 62.5% : 37.5% for gaining maximum protein where mass and carbohydrate contents have been taken into account.
The research has shown that all sets of optimal parameters c1, c2, c3, c4 have
(protein and carbohydrate) independently [10]. Multiobjective functions are de-signed for improving this result. Additionally, the food obtained by this research will be designed as a supplement of food to patients with high colesterol. Therefore one needs to minimize protein, fat and carbohydrate simultaneously. The research shows that the best proportion of rice brand is 25% for maximizing fiber content and minimizing protein, fat and carbohydrate contents simultaneously.
3.3. Colour reduction of Stevioside syrup.
Three sets of data ofcolour reduction and stevioside content were measured and percentage of maximum color reduction was expected in the research for producing stevioside syrup [5]. The column chromatography of 7 types of absorbance under theλ1= 291 nm and
λ2= 215 nm were employed. Bentonite (B), Caoline (C), Active carbon (A) and
Silica gel, and the mixture of two types of absorbance were the used absorbances. The experiment used water for initial extraction and then using ethanol 50% for further extraction . The color reduction was assumed to be a logistic function with the stevioside content as the independent variable. The least square method leads to determining of 2 parametersK andk,i.e minimize
R(K, k) =X yi,data−
Ky1,data
Ky1,data+ (K−y1,data)e−kxi
(5)
The optimal parameters were considerable good enough since the errors less than 15 % shown in Table 4. The Hessian matrices of R in these parameters were positive definite that indicated their optimality. One may compare each value of logistic function and its approximation by a histogram as shown in Fig. 4.
Figure 4. Comparison color reduction given by data (darker histogram) and approxima-tion [5].
Table 4. Optimal parameters (Kandk),[5]
Data K k Error (%)
Sample I 1.1549 1.6226 6.7232 Sample II 1.1549 1.6226 14.5822 Sample III 1.1549 1.6226 7.7947
Table 5. Observed by. Y.Martono at Lab. Chemistry, SWCU,2011,[7]
Ratio (bean :yeast) 1-st-day 2-nd day 3-rd day 4-th day
1:5 0.714 0.75 1.76 3.22
1:7.5 1.33 1.88 0.21 1.33
1 : 12.5 0.88 1.38 0.93 2.38
3.4. Difficulty in optimization of protein in beans.
Somere-searches in optimization were not success due to a wrong chosen of objective func-tion. Studying for some functions of optimization provided by MATLAB was the first objective in this part of the research. The case study was optimizing protein in beans and one needed the best percentage of yeast for fabrication. Some data are shown in Table 5
The first approach is to present the percentage protein as a smooth function and then we introduce the optimization procedures. Let us introduce dimensionless variables,i.e t : time ; B : percentage of beans ;Y: percentage of yeast, P : percentage of protein. We assume that the given data will be a continuous function as
The unknown parameters αand β were obtained to be 0.4325 and 1.277 respec-tively with the error error 0.9008 %. Now, one may proceed the optimization goal ,i.e subject to the defined constraints . Since MATLAB provides functions to minimization problems, then the problem to maximize protein is designed as
min−
minimizer [12]. The idea of improvement is redesigning the objective function by pertubation method which is solved by Penalty method , i.e the objective function becomes
fǫ(~x) = min− Y B
0.4325
t1.277
+ǫ|~x|2
!
where~x= [Y(t) B(t)]T. (9)
The solution is not a real vector after 747 iterations though the method works well by showing that the norm of gradient Lagrangian function tends to zero depicted in Fig.˜refIteration.
Figure 5. The norms of∇Lǫ
(~x) due to iteration whereLǫ
(~x) is the Lagrangian function offǫ
(~x) related to the given constraints [7].
Thus the Newton method fails which agrees with analytic result. However this research is an exercise for a new researcher for working on optimization of food science. The Newton method is a standard way for solving a nonlinear system. Broyden method can be an other method for solving nonlinear system [12]. A modern fashion of optimization is given by genetic algorithm [3] is also available for solving nonlinear system which has been applied to one of the given problems above.
3.5. Further Research.
On each topic shown above, there exists errors due to the used algorithms. In order to reduce some errors, one needs to employ other algorithms and analyze with the same procedures by analyzing its Hessian, its convexity and its residual. An improvement can be a hybrid global nonlinear least square [11] instead of standard least square on each case since we have used the standard one. Other possibility is fitting of an objective function by other tech-nique of interpolation. Modern optimization procedures have good advantages for improving a knowledge in optimization such as ant colony algorithm and particle swarm optimization [13].4. Conclusion
corn and rice brand, color reduction of stevioside syrup and protein production of Saga. Not all optimization procedures lead to the expected results since the given data do not support necessary conditions on the used theories. However, one may have some knowledge on each problem to proceed further research on each topic.
5. References
References
[1] Dewi, V.P., Parhusip, H.A., Linawati, L., Analisa Hasil Panen Padi menggunakan Pemodelan Kuadratik,prosiding(201 3), Seminar Nasional Matematika VII UNNES, ISBN 978-602-14724-7-7, (in Indonesian).
[2] Dewi, V.P, Parhusip,H.A., Linawati, L., Optimasi Hasil Panen Padi menggunakan Singular Value Decomposition (SVD) dan Ant Colony Algorithm (ACO),prosiding
(2013), (in process) Seminar Nasional Matematika UNS, Surakarta,(in Indonesian). [3] El-Emary,I.M.M., El-Kareem,M.M.,Towards Using Genetic Algorithm for Solving Nonlinear Equation Systems,World Applied Sciences Journal,(2008),(5)(3): 282-289, IDOSI Publication.
[4] Horn, R.A., Johnson C.A., Matrix Analysis, (1985), USA: Cambrige University Press.
[5] Parhusip, H.A., Martono, Y., Optimization Of Colour Reduction For Produc-ing Stevioside Syrup UsProduc-ing Ant Colony Algorithm Of Logistic Function,proceeding
of The Fifth International Symposium on Computational Science, ISSN:2252-7761,(2012),(1), pp 91-101, GMU.
[6] Parhusip, H.A., Hartini, Biharmonic Protein Function in MOCORIN and Its Opti-mization , presented on International Conference on Applied Technology, Science, and Arts,(2013), ITS, Surabaya.
[7] Parhusip, H.A., Difficulty In Optimization Functions Of Matlab And How To An-alyze, Prosiding Seminar Nasional Penelitian, Pendidikan dan Penerapan MIPA, Fakultas MIPA, Universitas Negeri Yogyakarta,(2012) , ISBN : 978-979-99314-6-7,M109-M114.
[8] Parhusip, H. A., Martono, Y., Kadar Steviosida Maksimum pada Waktu dan Massa yang Minimum,prosiding, Sem. Nas FSM UKSW,ISSN:2087-0922, (2011),(2),pp.645-650 (in Indonesian).
[9] Parhusip H. A., Data Selection with Hessian Matrix,Proceedingof IndoMS Interna-tional Conference on Mathematics and Its Applications (IICMA),(2009), ISBN:978-602-96426-0-5, 0341-0352.
[10] Kristianingsih, R., Parhusip,H.A., Mahatma, T.,Penggunaan Algoritma Genetik dalam Mengoptimalkan Kandungan Karbohidrat dan Protein Pada Mocorin,
Prosiding,(2013), Seminar Nasional Matematika dan Pendidikan Matematika UNY,ISBN:978-979-16353-9-4,MT 207-214 (in Indonesian).
[12] Peressini, A.L., Sullivan, F.E., Uhl, J.,The Mathematics of Nonlinear Programing, (1987), Springer Verlag, New York,Inc.
[13] Rao, S.S., Engineering Optimization, Theory and Practice,(2009), John Wiley and Sons, Inc., Hoboken, New Jersey.
[14] Watkins, D.S.,Fundamentals of Matrix Computations, (1991), John Wiley and Sons, New York.
Mathematics Department, Science and Mathematics Faculty SWCU-Jl.Diponegoro 52-60 Salatiga, Indonesia
![Table 2. Error and conditional number of parameters in Eq. 4 due optimization result [2]](https://thumb-ap.123doks.com/thumbv2/123dok/1112813.648209/5.612.199.373.549.624/table-error-conditional-number-parameters-eq-optimization-result.webp)
![Figure 4. Comparison color reduction given by data (darker histogram) and approxima-tion [5].](https://thumb-ap.123doks.com/thumbv2/123dok/1112813.648209/7.612.196.373.437.547/figure-comparison-color-reduction-given-darker-histogram-approxima.webp)
![Table 5. Observed by. Y.Martono at Lab. Chemistry, SWCU,2011,[7]](https://thumb-ap.123doks.com/thumbv2/123dok/1112813.648209/8.612.194.484.254.305/table-observed-y-martono-lab-chemistry-swcu.webp)
![Figure 5. The norms of ∇Lǫ(⃗x) due to iteration where Lǫ(⃗x) is the Lagrangian functionof f ǫ(⃗x) related to the given constraints [7].](https://thumb-ap.123doks.com/thumbv2/123dok/1112813.648209/9.612.196.366.248.323/figure-norms-iteration-lagrangian-functionof-related-given-constraints.webp)
