106
Analyze of the planning, layout and logistics in garment manufacturing
Abstract: The industrial mode of production of clothing requires thorough preparation of the production process, because several factors are to be connected: people, time, machines, production facilities, organization and material in a coordinated and rational system. The technological system of production of clothing must provide the required product quality, the production volume needed, the delivery of finished garments within the stipulated time and the maximum utilization of capacities with minimal costs.
Keywords: computers, production preparation, planning, layout, logistics.
5.1 Analyze of the planning, layout and logistics in garment manufacturing
The dynamics of international strategy of the fashion industry is speeding up with the development of new business concepts and requirements of the increasing changes in the market. The world itself is viewed as a potential source of production, being at the same time a unique market of clothes. The base of the economic system lies in the fact that the ultimate success is positive with those manufacturers whose products are cheaper and better than the competing ones. Higher productivity allows the increasing taking part in the global market. Those who can not keep pace lose their place. Final customers do not care where the product comes from, but the parameters which decide about its choice (quality and price, etc.). Nowadays, the clothes is purchased as a daily item with a short period of usage.
Production planning is a key phase of the management process and the overall development of the organization and the safety in performing tasks depend on the quality of plan. The fact is that planning saves time and enables various resources of PBS to be used in the best possible way. Planning can be defined as setting goals, and refining activities, routes and resources for their realization. After a set- up and refinement of goals, the planning process should be systematic but also flexible. Plans may be strategic and operational.
Management of PBS has a unique responsibility – one of them is making strategic (long-term, corporate) plans which, depending on the activities of the organization, are made for a period of one to five years and more. Strategic plans refer to long-term objectives of PBS and they include:
– Existence of mission and vision (the definition of work that deals with PBS).
– Definition of corporate goals (accurately determined increase in absolute amounts, percentages, etc.).
– Assessment of the external environment (economy, competition policy, market trends, etc.).
– Assessment of internal resources (analysis of strengths and weaknesses of PBS).
– Analysis of possible sequence of events.
– Turning the plan into concrete activities (refinement: priorities, the framework of deadlines, resources, responsibility for implementation and coordination of programs, etc.).
Operating (management) plans start where strategic plans end, aiming to realize them through practical and more elaborate activities and measures, and they are related to shorter periods of time (daily, weekly, monthly, quarterly and semi-annual). These plans function as strategic plans and they are all about performing the scheduled work on time without using more resources than anticipated, in order to avoid crisis situations and additional costs they carry.
Operating plans can contain other plans:
– investment plan, – plan of staff,
– plan for education and innovation skills, – marketing plan,
– procurement plan, – sales plan, – production plan, – holiday plan, etc.
The task of preparing the production is to determine all the circumstances of production so the process could carry out normally, with no improvisation.
Preparation of production includes: constructional, technological and operational preparation. Technological preparation includes determining the technological process, the selection of machines, tools and determination of material quality.
Operational preparations include: developing plans for individual production facilities, determining the amount of material, determining the time of manufacture, production of necessary documents and so on.
Besides the technological preparation, operational preparation has very important tasks in the overall construction output in garment industry. The operative preparation usually consists of the following tasks: determining the capacity of production, production planning, production monitoring, planning the necessary quantities of materials, launching work orders, scheduling of production and assembly of data for plan calculation.
Production capacity is the amount of product that a manufacturing section can implement for a certain period of time. The production capacity is affected by many parameters of which the next are most important:
– type and amount of funds that are available in a production facility, – number of workers and their qualification structure,
– type and quantity of items of clothing i.e. products that are produced and
– market.
If PBS has modern and highly productive means it can count on a large quantity of products and services that can be achieved for a certain period of time. Accordingly, means of work are decisive factors in the restriction of production capacity. In addition to the funds, a number of workers has a very important role as well as their qualification structure for determining the capacity of production. If there is not a sufficient number of workers, then the available funds will not be used sufficiently and planned tasks can not be achieved. Likewise, if workers are hired more than the required number, under-utilization of workers occurs. Thus, the human factor greatly affects the determining of production capacity.
The production capacity is also influenced by the objects of work, considering not only the types of garments that are produced, but also the possibilities of getting the necessary amounts of material. Every delay in production due to the lack of materials causes non-using of capacities, delivery failure, increasing production costs and worker dissatisfaction.
The market has a very important role in determining the capacity of production. If the market has no need for specific products, then it is a limiting factor of production capacity. Only the attractive products can be demanded on the market and that is why PBS should be orientated towards producing such products.
Annual production capacity is determined by the formula:
g 1
C D Td R t
= ⋅ ⋅ [5.1]
Where: D – number of working days per year, Td – daily fund of working hours,
R- number of employees and
t1- time production per unit of product.
Daily production capacity (Cd) is calculated according to the formula:
Cd =
1
Td R t
⋅
or
[5.2]
Cd = Cg
D [5.3]
If different products are planned to be made, then partial annual (Cgi) and partial daily capacities (Cdi) are calculated according to formulas:
Cgi =
1
d i 100
D T R U t
⋅ ⋅ ⋅ ⋅ [5.4]
Where: Ui – the participation of certain products as a percentage of the total quantity
1
d i 100
di
T R U
C t
= ⋅ ⋅ ⋅
or
[5.5]
gi di
C C
= D [5.6]
The sum of all partial capacities gives the total annual, i.e. daily capacity:
Cg = Cg1+Cg2 +Cg3 +…+ Cgn
Cd= Cd1 +Cd2 +Cd3 +…+ Cdn [5.7]
However, capacity can be given in temporal indicators, or through the annual fund of working time and daily fund of working time.
The annual fund of working time can be calculated by the formula:
Tg= D · Td · R [5.8]
The daily fund of working time is calculated according to the formula:
Td = Td · R
or
[5.9]
Td = +Tg
D [5.10]
Where: Tg – annual fund of working time, Td – daily fund of working hours.
If the data on a partial number of workers engaged by the items are well- known, then the partial annual fund of working time (Tgi) is calculated by formula:
Tgi =D · Td · Ri [5.11]
There are usually three types of capacities in garment industry, and they are: borderline (installed, built-in), planned and actual.
Borderline capacity (Cg) includes the potentials of some production unit to produce a certain quantity of clothing products in a certain period of time without paying attention to any losses.
Planned capacity (Cp) is a capacity that is determined by taking into account the losses of machines and workers (losses at overhaul, repair, etc.). Thus, for example, when planning the losses in the work of machines eight percents can be taken and the coefficient of losses is 0.92, whereas talking about workers it is four percents, i.e. the loss coefficient is 0.96.
Actual capacity is the achieved quantity of product for the planned period of time. If the actual capacity (Cs) is within the limits of borderline and planned capacities, the production is expected to take place normally. However, if the actual capacity is less than planned, some organizational steps should be taken in order to increase production.
In case when the actual capacity is larger than the borderline one, then the latter is either set incorrectly, or there was a violation in the quality of production. If there was a violation in the quality of production, some organizational steps must be taken in order to ensure the planned quality of apparel products.
When the volume of production which needs to be achieved in a certain period of time is determined, then such a volume burdens available capacities so these things may occur:
– bottlenecks in production and – free capacities.
It often happens that the customer service agrees upon larger quantity of products and that a working unit in some workplace is not capable of realizing a certain quantity of products of required quality.
5.2 Application of computers in preparing for the production of clothing
The process of forming a garment in garment industry requires comprehensive technical and technological preparation of production. The greatest number of errors, and thus the costs associated with product quality, arise in defining a garment, developing a product and planning of technological process of
making clothes. 75% of all errors that appear on the product are believed to occur during constructional preparation. Costs of avoiding errors are the lowest ones when defining and developing a new product – a garment or a collection of garments, especially if you use the CAD (Computer Aided Design) system.
Constructional preparation includes a number of jobs which largely influence the final product, its functionality and the price of product.
The jobs of a designer and a modeller in constructional preparation are, mostly, highly professional and demanding, because the quality of clothing includes, among aesthetic and functional requirements, the stability of shape, simple maintenance, feeling nice while wearing, the beauty of fall, etc.
Physical and mechanical characteristics of textile materials which are used to make clothes have a big influence on all that, as well as on the construction of clothes. Giving forms must be systematical and continuous, which means that within the framework of industrial production, there must be a program of work that includes:
– The basic definition of the problem of design.
– Specification of a problem.
– The concept of designing within all current features and specific factors, such as:
(a) function of a garment,
(b) body measures, dimensions of garment, standards and tolerances, (c) structure and functional complexity of garment and
(d) structure of materials and production technology.
Construction preparation for industrial production covers activities which can be divided into several groups: collecting ideas for new products, designing and sketching models, a description of the model, the basic construction, standardization of new cutting parts, modelling the basic structure on given creation, completion cutting parts, grading of cutting parts, cutting the pattern for tagging, making cutting layout and prototype of production models.
The examples of developing systems which are present on the world market (Gerber, Lectra, Investronika, Optitex, Assyst) allow taking all variations of future garment into consideration. Their behaviour is simulated, their impact on the environment is analyzed, simultaneous design is used aiming to obtain the best solution in the given conditions which reduce subsequent changes (correction model design, adjustments to fit in cutting layout for basic and supplementary material) to a minimum. Creating a prototype model for industrial production in the formation of products in the clothing industry involves the development of CAD methods for the preparation of construction segments. The number of possible variations in
colour, shape and design, modelling and re-modelling of garment is almost unlimited (Paunovic, 2009), Figure 5.1.
Computer simulated clothing is a truly designed textile material redesigned from two-dimensional form into three-dimensional one. The progress of research about the behaviour of textile surface products affected by various forces while wearing provided a computer simulation of fall and fabric crimping, so called draping and visualization of finished garments. Knowing the type of material a garment is made of and its construction can lead to a fairly realistic picture of a garment and its graphic presentation on a virtual model of man. By simulating the fall of the fabric and its dynamic changes some possible deficiencies before cutting and sewing can be noticed and corrected, Figure 5.2.
CAD systems in garment industry help to improve development, analysis, redesigning models and making decisions about solutions for clothing products.
True solutions are optimal solutions which satisfy the requirement of getting maximum quality for minimum price. Designing products is a critical activity of the manufacturing process because it is estimated that its share is 70% to 80% of the cost of development and production.
5.1 Control and positioning of 3D objects and adjusting cutting parts with parameters of prototype.
Geometric design cloth pattern is a complex procedure with many reps and interdisciplinary programs whose priority is reflected in:
– flexibility of dimension, – increasing accuracy, – increasing productivity,
– possibilities of real visualization, – optimization of construction,
– optimization of deadlines of production preparation, – security and quality management,
– planning, monitoring and efficiency in creating products.
In computer technology, there is the notion of intelligence as a totally new attribute of a manufacturing process. Intelligent manufacturing processes are required:
– the ability of fast, cheap and productive adaptation to new requirements and situations,
– the ability to learn and use one’s own and other experiences quickly, – the ability to reason and understand causal relationships and
– disclosure and registration of production parameters and their incorporating into adapted behaviour.
Simulation process of construction preparation allows the virtual product development by: the exchange of electronic data on material, model, size and personalization of virtual model of products and customers, quality control,
5.2 Pattern making and virtual sewing.
data transfer to CAD systems, the possibility of realization of CIM (Computer Integrated Manufacturing) concept and flexible methods of production and optimization process. Computer support of small serial production by simulation on the CAD computer system provides answers to the dynamics of changes of fashion trends, optimization of product development and process and direct involvement of customers into the process of creating the final product.
Designing fashion products using CAD systems improves the development, analysis, redesigning models and making decision about true solutions. True solutions should be the optimal solutions that satisfy the requirement to get maximum quality for minimum price.
Cutting layout is a set of cutting parts of one or more types of garments, rationally put in the rectangular surface of material with endings in a right angle. Its purpose is to determine the path which will contain layers of materials and to reduce their consumption. Garment quality requires its width and direction of the base and weft. Cutting layout can be one-size and more- size. Their production also depends on the method of putting cutting layers (spreaded or folded material...), as well as on the type of material used. CAD software packages for fitting cutting parts into cutting layout were developed in order to increase productivity by reducing labour and material investment.
Using software in development cutting layout with manual, automatic and interactive creation of cutting layouts can lead to optimization with large speed and reduced consumption of materials, achieve maximum flexibility while fitting cuts, make changes in quantity, size, and number of layers, view all the parameters at any time of the process of making. In addition to that, it is possible to obtain results and save time with calculations obtained without fitting cutting layout, in order to optimize the cutting plan (Figure 5.3).
Well-known manufacturers of CAD equipment for construction preparation have produced automatic machines for putting cutting layers, which are directly connected to the CAD work units and the aggregates for cutting.
Apparel industry of developed and medium developed countries in the world is going through many crises and steady decline in production, loss of markets, dismissal of workers, closing factories and moving production to underdeveloped countries with cheap labour. Developed countries were forced to intensify the research of automated system of technological processes, which led to progress in the area of mechatronics, automation and robotics, and the invention of new so-called intelligent sewing machine. Modern sewing machines have programs and programming interface to connect to a computer, which is the reason for setting blocks adjusted to the machine for two-way communication with computer. So the instructions from computer are sent directly to the worker or the machine in case of correction, the sequence of activities and others. In the opposite direction, towards the computer, data about the state of machinery, progress of work, etc. are being transferred. Data collected from the machines
in the network are analyzed by the computer with the help of special programs and puts them in a database, where the data can be used by various users with specific application programs.
Modern fashion design requires a small amount of clothing, many colours and patterns, so the production plants daily deal with many work orders, which caused making of technical documentation to be one of the biggest problems in clothing industry. Computer for the organization of cutting technological process can be connected to a computer for making technological documentation and work order, and through CAP (Computer Aided Planning) of system the planning of clothes is carried out as well as sending information about the material on the basis of which sewing machines are programmed (material transport system, regulation thread tension, the force of pressure foot, sewing speed, etc.) intermediate transport and data about cutting parts for conducting of CNC (Computerized Numerical Control) of sewing machines.
The application of computers allows, in trimming phase, achieving the quality of ironing by selecting the optimal parameters of ironing and the saving of energy (electricity, water, steam, air). Programmed finishing machine allows maintenance and measurement of pressure, temperature, vacuum air and compressed air for ironing.
CIM includes computer integration of business, engineering, manufacturing and management information that links all the functions of the company
5.3 Making cutting layout (marker).
from marketing to distribution of products. Benefits of CIM system are: fast response to market demands, easy modification of fashion products, reducing production cycle, high quality products, low price of production, increasing flexibility of production, rational utilization of textile materials, production equipment and workers. CIM is a concept of production in which the whole flow of production, from the entry of raw materials to the exit of finished products into the market, connected, monitored and controlled by computer systems that are in conjunction with all the processes that take place in a production business system. Data which are collected and processed are: the entrance of new materials in the warehouse, the situation in the warehouse, the cost of production, data on workers, selling products, the situation in production and others. Traditional organizational structure is not adequate for the concept of CIM, so along with the development strategy of CIM the profile in the clothing industry must be changed.
CIM concept has been introduced in the garment industry for the last ten years and up to these days it has been fully integrating the construction preparation and cutting technological process of clothes. In Figure 5.4
5.4 Interactions CAD, CAM and CAE in the garment manufacturing.
Selection of materials Fashion
design
Optimization
Automatic cutting
Cutting layout Construction and modeling Determining
the size
Automatic composition Sewing
machines and equipment Material
handling Simulation
Database CAE
CAD
CAM
interactions of CAD, CAM and CAE (Computer Aided Engineering) in the garment manufacturing are shown.
Formation of integrated CAD/CAM (Computer Aided Design/Computer Aided Manufacturing) in a CIM concept achieves the increased quality of production for two to five times, the reliability of manufacturing operations from 40% to 70%, reducing costs for 20% and increasing the ability of engineers in the preparation and the analysis of process for three to 30 times.
The introduction of CIM concept leads to connecting to a common manufacturing system with common goals in a PBS:
– reduction of production costs,
– increasing flexibility of production and – increasing quality.
The advantages of computer technology in garment industry, especially those whose production is within the CIM concept, can be presented at several levels:
– Improving working conditions in garment industry is achieved through collection, processing and automatic evaluation of data, reducing the
“manual” work, better organization of labour schedule, better collection and analysis of information about customers and suppliers, easier communication between the structures of PBS, a faster and more efficient data processing, simplification of various operations, the availability of data from any point in the world with internet, as well as optimization and systematic flow of information.
– Better utilization of production capacity is achieved due to better surveillance over machines, schedule of labour, determining conditions of optimal task settings, reduction of waiting time because of better planning and faster obtaining more accurate data on the total quantity of production which is, therefore, cheaper.
– Improving productivity stems from the interactive relationship between workrooms and services of planning or making orders. Possible delays in production are currently registered, so one can respond in time and examine better ways of production in order to improve it continuously.
Production can be planned in its very progress.
– Improving the quality of clothing is due to rapid perception and elimination of errors during production, and therefore reduces the subsequent quality controls and losses of time.
Modern industrial garment production requires continuous innovation and improvement of production processes, technology and work quality. By introducing information technology, using knowledge of expert systems, artificial intelligence and simulation of partial or complete technological
process, planning and monitoring of production, new ways of designing and techniques of garment making have appeared. Although computer-integrated manufacturing of clothing which includes CAD, CAM and CAPP (Computer Aided Process Planning) connects all vital functions of technical and production systems, from storage of raw materials through the technical preparations to the finished goods warehouse, it is necessary to create a preparation for:
– unpredictable market movements, – expansion of nanotechnology,
– construction of new textile materials used in all aspects of life (medical textile, geo-textile, ambient textiles...),
– increase the frequency of introducing new products, – changing of parts of existing products,
– large and frequent changes in fashion trends in apparel products and their combinations,
– changes in the application of regulations (standards, safety, environmental, application of eco-textile...) and
– changes in the technological process itself.
One of the main reasons and objectives of introducing the concept of CIM is the expectation that equipment and facilities should be used up. The ultimate goal of CIM is a total informational and technical control and integration of logistic activities in the industrial system from the time of order to the delivery of finished products.
5.3 Risk Analysis
In order to understand these terms: risk management and risk management system, it is necessary first to define the concepts related to the risks. Risk is defined as calculation forecast emergence of negative events (hazards) that cause loss or calculation forecast emergence of positive events (opportunities/
chances), which bring us benefits.
Risk is a condition in which there is a possibility of negative deviations from the desired outcomes that we expect or hope will happen. In terms of business, risk is an unfulfillment of desired business objectives and it must include threats and opportunities from the environment that can potentially contribute to the growth and development of the PBS, but prevent development, and thus endanger the very survival of a PBS. The risk, in the broadest sense, is a particular danger, uncertainty, loss, or the uncertain future event that may have unintended consequences. The concept of risk comprises three elements:
● The perception that something might happen.
● Probability that something happens.
● The consequences of what might happen.
Risk consequences on the planned garment production are:
● exceeding the framework of the assessment of production costs,
● exceeding the requested date of making
● not acquiring the quality of clothing.
Tracking disorders and disturbances in production, their systematization and statistical methods can lead to the sizes which belong to risk and can be included in the calculation.
The risk may appear:
● because of placement of low bids in the market and
● in production compared to the size of the series that is produced.
Activities for achieving goals in the process of preparation and production:
● knowledge of market and adapting to conditions ,
● finding real costs,
● designing the organization of production for each garment,
● undertaking organizational and technological measures that will enable the production according to the planned costs,
● continuous control of production costs and
● creating a base of information for management of a PBS on the basis of production control.
Modern design at the beginning of the 21st century longs for refined lines of geometrical forms and aerodynamic surfaces burdened by the demand of assembly-line and mass production. This is not the case with fashion industry that dictates a great number of models and different styles with indefinite construction parameters of textile surfaces the garments are made of. On the other hand, there are producers who want to increase productivity and standardization of products and at the same time satisfy the consumers’ needs as far as quality and diversity of products are concerned. The fashion appears in short intervals, it lasts for some time and disappears. It is repeated in cycles, slightly changed and modified. Many countries in their fashion centres with strong designer and marketing support allow creating of fashion whims that last for a short period of time on the markets with a large offer, competition and with consumers who are able to buy.
The consumers who are under the influence of fashion whims are impulsive category of buyers. The other type of consumers cannot follow fashion whims, but in a certain period of time that comes after a fashion whim there remains a fashion trend which has a long-lasting effect and allows to be worn by consumers with lower purchasing power. Lower quality products, if in trend as far as form, colour or ornamentation are concerned, are accepted by the consumers with lower purchasing power.
Buyers of garments want to be different, but not too much, so they accept basic fashion trend determiners with constant improvisation and expression of personal image.
Garment manufacturers in fashion industry are divided into leaders and those who copy (copyists). Leaders design a new product, impose and dictate new fashion helped by powerful centres of design and modern technology together with marketing company. Manufacturers who copy are late with production, but find their place in satisfying a large garment production market. They don’t often strike back with the quality of products but there is a competition between them.
Consumers react to fashion depending on their purchasing power. Fashion trends have an economic, psychological and social influence upon consumers. Consumers will often buy a new and prestige product that is above their purchasing power, particularly special brand of garment, wanting to become equal to a special social group by wearing such clothes and trying to achieve special social status.
Designing and getting new ideas in fashion industry today should become an organised process that requires thorough, systematic approach that is given a basic direction both by a designer and a capable manager team. Such an educated and creative team ensures that designing and gaining new articles of clothing, as being the most important element in the development of garment industry, should be done as planned and continually according to current situations and priorities.
If this process is neglected, so many firms will struggle for their existence.
It is necessary to do SWOT (Strengths, Weaknesses, Opportunities and Threats) analysis in order to get marketing weapon and overcome all existing problems, which means to take all advantages and eliminate weaknesses of the PBS. It is possible to point out solutions and consequences, as well as to show how a fashion industry should get better with the help of this analysis.
SWOT analysis must be summarized, specific and to analyse key questions of each PBS but not ad-hoc suppositions that do not point out future actions.
SWOT analysis is the method of strategic planning that enables analysis of estimates and combining of internal factors with information from external sources on the market and in business environment.
Internal estimate as well as analysis of strengths and weaknesses in garment manufacturer refers to factors that can be controlled within the organisation. That concerns not only material expenses and technical- technological equipment but the reputation of the firm and existing brand, innovative activities of designers’
team and marketing service. While doing an internal estimate there are hindered factors such as subjectivity, lack of trust, running away from reality. Weaknesses cannot often be overcome in a short period of time.
External estimate implies those possibilities and dangers that will have a main influence on business results of a textile firm. New fashion trends, i.e. new designs that should be accepted, should also bring new results. The problem which exists in garment industry is that we analyse and follow trends
that have already taken place on the fashion scene so while a collection is being accepted and the preparation for production is getting completed, a new fashion demand is here, and the old one hasn’t been accustomed to yet.
External estimate deals with advantages and dangers connected with a market, technology, scientific-technological development, changes in micro and macro environment, economy, ecology…
There comes the case when one textile firm, depending on its ability to follow fashion trend “blindly”, sees the production of the very up- to- date design as advantage, whereas the other textile firm that has e.g. classical brand in clothing sees the same fashion trend and a new design as danger.
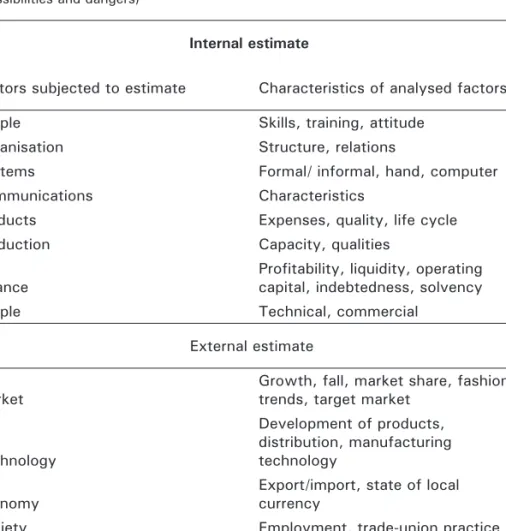
Possibilities of performing internal and external estimate in SWOT analysis are shown on the Table 5.1.
Table 5.1 Internal estimate (strengths and weaknesses) and external estimate (possibilities and dangers)
Internal estimate
Factors subjected to estimate Characteristics of analysed factors
People Skills, training, attitude
Organisation Structure, relations
Systems Formal/ informal, hand, computer
Communications Characteristics
Products Expenses, quality, life cycle
Production Capacity, qualities
Finance
Profitability, liquidity, operating capital, indebtedness, solvency
People Technical, commercial
External estimate
Market
Growth, fall, market share, fashion trends, target market
Technology
Development of products, distribution, manufacturing technology
Economy Export/import, state of local
currency
Society Employment, trade-union practice
Legal regulation Consumers' protection, pollution
Ecology Energy, raw materials, recycling,
environmental protection
Within a fashion PBS, paying special attention to the problems of designing a new product, it is necessary to observe within internal estimate first of all skills, training, attitude of marketing team, fashion designer and technologist and then the production management structure of the PBS itself, current systems (CAD/CAM systems), relations and communications among people. In order to manufacture an adequate product real expenses must be estimated, especially textile fabrics and quality of manufacturing garments, in order to lengthen a life cycle of a fashion product and not to neglect technical-technological capacities of the firm. The rhythm of technological development is faster than the development of human generation (life time for technological generation is four to five years, which is seven to eight times less than an engineer’s length of service in clothing industry), so permanent training of production-technical employees is necessary.
Within an external estimate, when analysing possibilities and dangers of a fashion product that should be designed and redesigned in accordance with a fashion trend, it is necessary to study the very situation on the market, to determine target groups and categories of consumers. Garment manufacturers who do not invest in the development of products and production technology get into danger and can’t “keep pace” with fashion trend although they try hard.
A good distribution net, besides placing goods on the home market, should think of doing it on the foreign market. Because of poor economic power and large competition on the world market there are possibilities for many fashion PBS to fail, therefore a good distribution net should enable joint breakthrough for many fashion PBS to the foreign market, as the only real possibility.
A large number of not standardized fashion products, not harmonized sizes and quality of production are a danger for gaining access to the world market.
SWOT analysis can be of a special importance in fashion industry when used for designing a new article of clothing, i.e. collection. The suggestions for the use of SWOT analysis when designing a new article of clothing in fashion industry are given in the Figure 5.5.
During the manufacturing of basic SWOT analysis different problems may appear and they can be solved (Kotler, 2006) with more critical POWER SWOT tool:
P = Personal experience
It provides the SWOT analysis to be based on the experience, knowledge, skills, attitudes and beliefs, because all the observations and personal feelings have an impact on the SWOT.
O = Order
Marketing managers often confuse features and advantages or disadvantages and risks, because the line between them is sometimes invisible.
W = Weighting
Certain elements of the SWOT analysis are often difficult to estimate, because some points are slower than other ones. Therefore, it is necessary to use percentage participation, for example: 1 = weakness of 20%, weakness 2 = 70% and weakness 3 = 10% (total 100%).
E = Emphasize detail
Many details, reasons and justification have been omitted in the SWOT analysis. For example, the technology itself is often both the weakness and the advantage.
R = Rank and prioritize
All the facts presented in the SWOT analysis have the impact on the strategy and that is why it is necessary to classify (rank) them from the highest to the
5.5 SWOT analysis for new collection.
STRENGTHS - Futuristic design - Good image
- Reaction to a new fashion trend - Quality of textile fabric and
production
- New ergonomic form of model - Short period of development of a
model and short period of duration - Automatization of production
processes
- Industrial training conducted by specialist
- Ecological requirements
WEAKNESSES
- Very high price because of fast changes
- Small series with a large number of models (three to five articles in work order)
- Manufacturing of only three sizes - Bad covering of foreign market - High price of energy
- Condition and price rise of raw material because of introducing VAT
- Short time for optimalization of products
OPPORTUNITIES
- Consumers’ wish for new designs - Marketing of products into a new
market - Market
- Establishing “show room” objects - Making e-mail catalogue
- Value of labour
- Production of garments Made-to- Measure
THREATS
- Import of similar articles of clothing at low prices
- Competitors have lower price - Competitors have better distribution
net with more sales places - Quick obsolesce of technology
lowest impact and thus determine the priorities. For example, if possibilities of a manufacturer for a new collection of clothing:
– The desire of customers for new creations = 25%
– Creating a “show room” facilities = 60%
– Launching new products to market = 20%
Then the marketing plan must be identified according to the following priorities (the opening of “show room”, new creations, placing new products on the market, etc.). For ranking and setting priorities a Gap Analysis can be used, a simple and effective analysis that enables marketing managers to decide upon the appropriate strategy and tactics.
5.4 Optimization of planning
Planning means predicting tasks in a future period of time. Planning shouldn’t be done as desired, but according to the real possibilities, including all possible potentials.
Planning is a complex job and it can be overcome only by good organization of work and following the specific methodology. In the PBS, there are:
– individual plans and – overall plans.
Total plan consists of individual plans, such as:
– investment plan, – production plan,
– plan of procurement of material, – plan of required number of workers, – plan of realization of products, – plan of depreciation, etc.
According to the time period, there are:
– long-term plans, (including a period of five to ten years), – medium term plans (including a period of one to five years) and – short-term plans (including a period of one year).
Short-term production plans are most represented in garment industry due to the fashion trends that are often changing. In the short-term plans there are:
– seasonal plans or plans which include a period of six months, – monthly plans which include a period of one month,
– weekly plans and – daily plans.
Regardless of the time period, the production plan should include:
– name and type of products, – the unit,
– the planned amount in pieces and financial indicators, – normative material consumption,
– normative consumption time, – overview of capacity,
– measures for carrying out the plan of production, etc.
Production plans depend on the length of production cycle. Production cycles in garment industry include the duration of the production process through stages for cutting, sewing and finishing. Therefore, the production cycle means the duration of the technological process of making garment from the first to the last operation.
The duration of the production cycle depends on several factors: selected system of technological processes, a way of keeping the process, the size of bundles, etc.
Depending on the duration, the cycle of production can be:
– The longest (occurs when the next stage does not begin until the previous is completed).
– Shortened production cycle (occurs when the part of the process of cutting finishes and the process of sewing begins, then parallel process of cutting and sewing until the cutting process is completed, and after that the sewing process continues until its end and then the process of finishing starts).
– The shortest cycle of production (occurs when the part of the process of cutting ends and the process of sewing begins, and when the part of the process of sewing ends the process of finishing starts, so there is a simultaneous conducting of three phases in a certain period of time).
Concerning the fact that it often happens that one production unit makes many different models of clothes during one month, you need to know the time for making every particular model, then the average level of productivity and the number of available workers.
The daily production of clothing deals with many work orders, so it is necessary to complete Scheduling (shop floor control). Scheduling means determining the order of carrying out jobs. Priorities can be determined on the basis of several rules:
– FIFO (first-in, first-out), – LIFO (last-in, first-out),
– DDATE (earliest due date) – which product must be made first,
– CUSTPR (highest customer priority) – first the product for priority customers,
– SETUP (similar setup) – first the similar products which require a minimum setting of machines,
– SPT (shortest processing time) – priority for products that last for the shortest period,
– LPT (Longest Processing Time) – priority for products that last for the longest period.
Priority DDATE can have variations:
– SLACK (Slack minimum) – priority for jobs that have less time margin:
– CR (smallest critical ratio) – priority for jobs with smaller ratio of the remaining time to maturity and remaining processing time:
If CR > 1, then the product is made before the deadline If CR < 1, then it’s late
If CR = 1, then it is done on time
Already deployed operations often change their order, since there are new jobs coming into production. Scheduling is performed according to the above rules, which can be modified in a way that corresponds to the number of resources or the complex global rules:
– Expanded SPT (shortest processing time) – jobs are divided into A, B and C, according to their duration. Jobs A are performed with a minimum duration, but every few hours the production is interrupted and job B is performed. Jobs C are performed every day each.
– WINQ (work-in-next-queue) – sees the duration of performing job at the next resource.
– NOPN (fewest number of remaining operation) – according to the number of resources that are yet to be used.
– S/OPN (Slack per remaining operation) -according to the time reserve for the rest of the job.
– RWK (Remaining work) – a variant of SPT, the duration of performing whole job on all resources.
Resources which are bottlenecks have a negative effect on the process efficiency, because they limit its real capacity and do not provide a high-quality, fast and flexible production. Goldratt’s limiting theory (Goldratt E.M 1997), defines a bottleneck in the process or in the BPS, because it assumes that the goal of every PBS is to “create money”. Limiting theory is what prevents the system or process to reach a higher level of performance, i.e. it focuses on real capacity, inventory and production costs. Goldratt’s theory coordinates production flow with demand according to the following principles:
(1) it is necessary to harmonize the flow of the process, not the capacities of phases of the process,
(2) efficiency of bottleneck is not determined by its capacity, but by other constraints,
(3) utilization and use of resources are different concepts,
(4) an hour wasted due to the bottleneck is an hour lost for the entire process, (5) an hour saved at bottleneck is an illusion,
(6) series of transfer do not need to be equal to the size of the production series,
(7) sizes of production series do not need to be fixed, (8) lead time of process is the result of designing process,
(9) when designing a process one should always bear in mind the constraints (bottlenecks).
For successful determination of the flow of process Goldratt proposes the use of network diagrams.
Technological process of production of clothing uses the technique of parallel ways of moving cut parts of garment from one operation to another together with scheduling and deployment of technological operations on the production capacities by checking the availability of resources. Thereby the making or installation of certain parts of garment is performed by an arbitrary number of operations whose scheduling is known to everybody, as well as the duration of individual operations. The optimization of technological operations is shown on Figure 5.6.
The most frequently used expressions for the network activities are CPM
5.6 Optimization of technological operations.
TECHNOLOGICAL OPERATION ACTIVITY
ORDER ACTIVITIES NETWORK PLAN CRITICAL PATH
DURATION OF ACTIVITY
OPTIMIZATION
FINAL NETWORK PLAN TIME USE
RESOURCES
(Circle Plan Methods), PDM (Precedence Diagramming Method) and PERT (Program Evaluation and Review Technique), and the types of networks are:
○ AOA (Activity-on-arc).
○ AON (Activity-on-node).
CPM for making operational plan is based on the graphical view of activities in the sewing room and the finishing, and their interdependence. This method is used to perform the assessment of duration of individual activities and calculating the earliest and the latest start and the earliest and the latest finish of activities. The earliest and the latest times that overlap are critical events, and provide a critical time.
The advantages of this method are:
previous study of work and process,
identification tasks,
time and material savings,
ensuring the success of the assessment process and control,
optimal layout and
calculating of time reserves for the capacity analysis.
In the following network diagram, activities are represented by oriented lines that begin and end with the identification points, which indicate the events shown in the online rounds, the Figure 5.7.
In large serial production a parallel transition method is applied, because parts of series which are completed in one operation do not wait to for the whole series to end but are sent to the second operation, while making in the first operation is still in progress. This method shortens the production cycle.
Cycle time can be calculated from the formula:
Tcp = (n -1) tomax +
1 k
oi i
t
∑
= [hour/cycle] [5.12]5.7 Network diagram.
a
b d
f c
i j h g B
a b 1 c
3 2 4
5 7 6
9 8 ff
d
e i
g h j
10
Where: toi – duration of certain operations,
tmax – the longest time in one operation for one piece in series, n – number of pieces in the series.
In order to avoid delays it is necessary to shift the operations that are on the critical path according to:
Ti + 1 < Ti [5.13]
That is, the beginning of production of such operations can move for:
s 1 = 2 = (n–1) (T1–T2) [5.14]
The mathematical model can be defined as follows:
– Minimum production costs
1 2 , , , 1 3 , , ,
1 1 1
( ) ( ) ( )
ii jj kk ll
l m j k k i m j l l
i l j k l
F x MIN x x t c x x t c
− − − −
=
∑∑∑∑
⋅ ⋅ ⋅ + ⋅ ⋅ ⋅ [5.15]{ { {
1 2 3
1 for selected m variant 1 for k > 0 1 for1> 0
0 for another variant 0 for k = 0 0 for1= 0
x x = x =
If is x2 =1 then x3 =0 and vice versa.
Restrictions are as follows:
– Taken capacity must be less than or equal to the available one for each capacity
ZAKkt ≤RASkt [5.16]
– All the technological operations must be deployed in the field
1 2 , , , 1 3 , , ,
1 1 1 1 1 1
( )
ii jj kk ll kk tt
i m j k i m j l kl
i j k l k t
x x t x x t ZAK
− − − − − −
⋅ ⋅ + ⋅ ⋅ =
∑∑∑∑ ∑∑
[5.17]– Deadlines in product delivery must be met
, ,
( )
imj jj k n
i
MAX tz − ≤νz
[5.18]
– Terms of beginnings of first activities must be larger than the system (current) date of drafting
, 1,
( )
imj k t
i
MIN tp − >s [5.19]
Time related to the event (node):
■ EET (early event time) – the earliest time when the activity coming from the node can start.
■ LET (late event time) – the latest time when the activity entering the node has to finish.
Times related to activity (branch):
■ ESij (earliest start) – the EET of node (node i) from which the activity outputs.
■ LFij (latest finish) – the FLIGHT of node (node j) into which the activity enters.
■ LSij (latest start) – LFij minus the duration of activity.
■ EFij (earliest finish) – ESij plus the duration of activity.
TF (total float) is the number of time units for which activity can be moved without moving the end date. Moving the start of the activity may cause postponement of some activities that follow, but its duration will not be jeopardized.
Total float can be initial and final:
TF = (LF – D) – ES = LS – ES = initial float time TF = LF – (EC + D) = LF – EF = final float time
Or TFij = LETj – EETi – Dij Where: D – duration
TF is used to determine priorities depending on the backup time that is associated with activities. Leisure spare time is used to determine activities that can be postponed without affecting the total backup time of the activities that follow (Figure 5.8).
FF (Free Float) is FFij = EETj – EETi – Dij
Independent float is used to determine activities that, although delayed, will
5.8 Free float time.
Aij i
Aij Dij
j
LETi LETj
EETi EETj
Aki
not affect the total float time of the activities that precede or follow her behind.
The value of an independent float time can be negative, and in these cases it is said to have zero value and then both free and independent backup time are the same and equal to zero.
IF (Independent float): IFij = EETj – LETi – Dij CF (Conditional float): CFij = TFij – FFij = LETj – EETj
The chain of activities that has the longest finish time determines the earliest finish time. This time is often called the time of the project (project time) or duration of the project (project duration) or the most critical path (critical path). Critical time begins with the first node (event) and continues along the network until the final node.
Total float time shares all activities within a single chain of activities. If one activity uses a part of the total float time, the total float time which remains for the other activities is reduced to that amount. Free float time is shared only with activities that proceed and is used during planning. When the float time that some activity has is used, then it can become critical, which results in a new critical path. Duration of each activity:
Dij = (Q • nv) / (N • t) [days] [5.20]
Where: Q – quantity of some activities on the basis of technical documentation, N – number of workers/ working groups,
nv – standard time unit of product, t – the duration of shifts/working hours.
PDM (Precedence Diagramming Method) – has the following relations between activities:
○ FS (Finish to Start) – the beginning of the next activity is after the end of the previous one.
○ SS (Start to Start) – the beginning of the next activity is after the beginning of the previous one.
○ FF (Finish to Finish) – the completion of the following activity is after the completion of the previous one.
○ SF (Start to Finish) – the completion of the following activity is after the beginning of the previous one and therefore it is rarely used.
To pass through the network in advance:
RPj = max (RPi + SSij; RZ +FSij)
RZj = max (RZi + FFij; RPi + SFij; RPj + Dj) [5.21]
To pass back through the network:
KZi = min (KZj – FFij; KPj – FSij)
KPi = min (KPj – SSij; KZj – SFij; KZi – Di) [5.22]
Analysis of the critical path (Figure 5.9):
(1) earliest start and latest start time must be equal ES = LS (2) latest finish and finish start time must be equal EF = LF
(3) duration of activity is the difference between latest finish and earliest start activities of LF-EC = D
For example, time of making men’s shirt is 27 min. Time of making the front of the shirt is 3 minutes and it is a critical path. To minimize the transportation, the production is planned to take place in bundles of 5 pieces. On the bases of the time division of operations per working places for each operation, a longer period of time for obtaining the time of performing each operation that is written in the network plan is taken and the total time for the first bundle is calculated.
For example: TC1 = 0.0311 • 5 pieces = 0555
TC2 = 0.0069 • 5 pieces = 0345 etc.
5.9 Analysis of the critical path.
1
o o1 2
3 4 6
5 13 10 4
9 9
6 15 15
7 16 16 1 1
C 8 D
3 3 E
G
1 6 H
2 F
2
1 B I
A 1
5.10 Network diagram for manufacturing shirt.
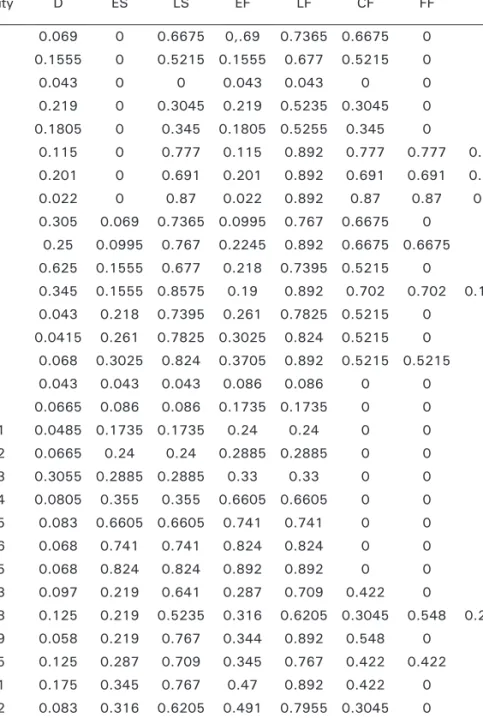
A network diagram (Figure 5.10), which was made according to the operation plan for shirts, can help to determine the critical technological operations:
Table 5.2 Analysis of float time
Activity D ES LS EF LF CF FF IF
1-2 0.069 0 0.6675 0,.69 0.7365 0.6675 0 0
1-4 0.1555 0 0.5215 0.1555 0.677 0.5215 0 0
1-8 0.043 0 0 0.043 0.043 0 0 0
1-17 0.219 0 0.3045 0.219 0.5235 0.3045 0 0
1-23 0.1805 0 0.345 0.1805 0.5255 0.345 0 0
1-25 0.115 0 0.777 0.115 0.892 0.777 0.777 0.777
1-25 0.201 0 0.691 0.201 0.892 0.691 0.691 0.691
1-25 0.022 0 0.87 0.022 0.892 0.87 0.87 0.87
2-3 0.305 0.069 0.7365 0.0995 0.767 0.6675 0 0
3-25 0.25 0.0995 0.767 0.2245 0.892 0.6675 0.6675 0
4-5 0.625 0.1555 0.677 0.218 0.7395 0.5215 0 0
4-25 0.345 0.1555 0.8575 0.19 0.892 0.702 0.702 0.1805
5-6 0.043 0.218 0.7395 0.261 0.7825 0.5215 0 0
6-7 0.0415 0.261 0.7825 0.3025 0.824 0.5215 0 0 7-25 0.068 0.3025 0.824 0.3705 0.892 0.5215 0.5215 0
8-9 0.043 0.043 0.043 0.086 0.086 0 0 0
9-10 0.0665 0.086 0.086 0.1735 0.1735 0 0 0
10-11 0.0485 0.1735 0.1735 0.24 0.24 0 0 0
11-12 0.0665 0.24 0.24 0.2885 0.2885 0 0 0
12-13 0.3055 0.2885 0.2885 0.33 0.33 0 0 0
13-14 0.0805 0.355 0.355 0.6605 0.6605 0 0 0
14-15 0.083 0.6605 0.6605 0.741 0.741 0 0 0
15-16 0.068 0.741 0.741 0.824 0.824 0 0 0
16-25 0.068 0.824 0.824 0.892 0.892 0 0 0
22-23 0.097 0.219 0.641 0.287 0.709 0.422 0 0
17-18 0.125 0.219 0.5235 0.316 0.6205 0.3045 0.548 0.2435
18-19 0.058 0.219 0.767 0.344 0.892 0.548 0 0
19-25 0.125 0.287 0.709 0.345 0.767 0.422 0.422 0
20-21 0.175 0.345 0.767 0.47 0.892 0.422 0 0
21-22 0.083 0.316 0.6205 0.491 0.7955 0.3045 0 0 22-25 0.0135 0.491 0.7955 0.574 0.8785 0.3045 0.3045 0 23-24 0.175 0.574 0.8785 0.5875 0.892 0.3045 0 0 24-25 0.1915 0.1805 0.5255 0.3355 0.7005 0.345 0.345 0
1-8-9-10-11-12-13-14-15-16-25
According to the network diagram a critical path is the one at which the backup time is zero. To calculate the float time (Table 5.2) the duration time of activity is observed.
Considering the fact that the technique of parallel ways of moving material from one operation to another is applied, a schedule of production can be suggested only for activities which are on the critical path. This plan (Figure 5.11) shows that the first bundle ends in 0.892 hours. The production of each following bundle ends in 0.3055 hours, since the cycle length of the longest operation is 0.3055 hours for one party. For the week of five working days (37.5 h), a possible production of 598 pieces can be determined in the following way:
– First day 5 + 7.5 0.892 0.3055 5
− ⋅ = 110 [pieces/day]
– Second day 7.5 0.892 0.3055 5
− ⋅ = 122 [pieces/day], and so on.
Delays can be avoided by shifting operations that are on the critical path and the start of production of these operations may move due to the continuity of production:
σ5 –6 = 597 (0.0875 – 0.0665 ) = 12.537 [hour/cycle]
σ6–7 = 597 (0.0665 – 0.485 ) = 10.746 [hour/cycle]
σ20–24 = 597 (0.3055 – 0.0805) = 134,325 [hour/cycle]
σ25–26 = 597 (0.083 – 0,068) = 8,955 [hour/cycle]
5.11 Term action plan on the critical path for the production of shirts.
Therefore, if the cycle of first operation of first party starts at 7 h, then the cycle of second operation of the first party starts at 7 05 h.
Application of network diagram allows performing of the time calculation of network diagram, the optimal allocation of resources and seeking the best economic solution for production. Network diagram in the technical- technological preparation of garment production allows:
a reviewed plan of making a garment,
a logical scheduling of technological operations,
optimal preparation and making of clothing,
an easy defining of deadline of clothing by determining deadlines of certain activities,
an easy identification of activities, whose shortening reduces the total time of making products,
informational data processing, etc.
PERT method of evaluation and auditing is a technique of network analysis which is used to estimate the duration of the operation when there is a high degree of uncertainty of the duration of individual activities, or when the duration of individual activities is not known. PERT uses the average of the distribution (expected value) of time estimation.
In the PERT technique each of the activities require three estimates of activities (Figure 5.12):
– Optimistic time is the duration of activities which can only happen during its performance under very favourable conditions and circumstances.
– Most probable time is the duration of activities that has the biggest individual probability to happen in practice.
5.12 Calculation of the PERT duration for one activity.
probably(CPM) PERT
beta distribution
pessimistic optimistic
smaller posible duration more
smaller probability events
more