A COMPREHENSIVE ANALYSIS OF CASES IN FINANCIAL ACCOUNTING
by Anna Lapayeva
A thesis is submitted to the faculty of The University of Mississippi in partial fulfillment of the requirements of the Sally McDonnell Barksdale Honors College.
Oxford May 2019
Approved by
__________________________
Advisor: Dr. Victoria Dickinson
__________________________
Reader: Dean Mark Wilder
Abstract
The thesis constitutes a comprehensive analysis of various cases in financial accounting.
The topics included investment decisions, income statement, property, plant, and equipment valuation, accounts receivable, allowance for doubtful accounts, research and development, data analysis, interest bonds, stock and dividends, securities, income taxes, and revenue recognition. The GAAP standards for the subjects include many options that can be used, and accounting will be significantly different dependent on the choice the firm will make. The research highlighted the respective differences in the methods and thoroughly explained the reasonings behind the chosen methods in cases. Topics were investigated over the course of two semesters, while attending a special course led by Dr.
Victoria Dickinson. Each case discusses a topic by using different public companies as an example, which provides us with necessary background information to critically assess the situation and to explain the underlying concepts to reasonably informed user. The cases required different means of information gathering, but generally included references to the available textbooks and books, as well as web sources and data bases available through the university library. The data gathered assisted in the case analysis and helped to understand more in the area of financial reporting. We were encouraged to use codification, laws, and ratios to assist in the analysis. The case studies inspired us to acquire more knowledge on different topics and gain some expertise in the application of concepts. From case to case it can be clearly deduced how important is to understand the basics of each topic to be able to navigate through more advanced topics in our college career.
Takeaways from the course
On average I spent four to ten hours a week over the course of the two semesters working on the cases and drafting the thesis. The experience was invaluable because our expertise was applied to real cases scenarios, allowing us to discuss topics more thoroughly than we ever could in any other class. It taught us a great deal of self-management in the areas of research and professional writing. To be concise, we adhered to the professional formatting guidelines, presenting information as to a business official, or as we would have to later in our career. We improved our understanding of the underlying accounting principles and their application.
The course taught us how to navigate through the financial statements and how to recognize what parts are important to users and why. We would go through the same steps in the process as investors would and consider how to allocate resources between different business options. Analysis of different business entities rewarded us with the understanding how business operates, and its functions interact with each other.
We gained expertise in utilizing different financial ratios and can critically assess the firm’s performance, relying on the financial metrics. The course highlighted the importance of the trend analysis both across firms and over the time periods. We faced the ambiguity of the financial metrics and can provide reasons for why that could be the case. It was of a huge future benefit to look though all of them to determine which numbers would be useful in calculations for ratios, because some of data could be misleading for an inexperienced user.
Multiple cases involved scrutiny of the transaction history, which helped us to build journal entries and T-accounts with much ease than before. It would help us in our future career, because even though various applications track transaction history, it would be impossible to draw any conclusions without complete understanding of how exactly application records entries.
Now, going back to the first case of the course, I can clearly see how far I have come in terms of understanding the details of various financial topics, for example, how the timing and the creditworthiness of the debtors will affect the calculation of the bad debt expense. After all, it would influence other elements as well, such as opinions of the users of financial statements and future estimates of allowance for doubtful accounts. In another case, it was important to note the relationship between total research and development costs to net sales, and how the companies adjust the former according to the changes in the latter.
I think that research and development is crucial to many companies and understanding how we treat them is essential for us to be able to work for the future clients.
To talk more about the estimates, it can be noted that financial users do not favor relying on the estimates, so it is of the utmost importance to be able to be as specific as possible when dealing with specific accounts. In the cases we learned that you must have certain expertise to be able to operate such accounts. One of the most useful tools used for grasping the concepts was building T-accounts with corresponding journal entries.
One of the cases involved explanation of an intermediate accounting problem to a new student. Knowing how to break things down, and how to explain it to someone with no background knowledge of it, helps to work on problem-solving skills and ability to
follow logical conclusions. This concept might be used for the future topics and applied to different subjects in college.
Multiple cases offered us an insight in a technological side of the accounting world.
We know that the data and analytics became the essential part of any company, especially those of accounting service providers. Data streams are constantly recorded and stored away, but even though the information gathered is invaluable, there are few platforms that can analyze it.
Other issues that we discussed was that the auditors have different opinions on the matter of how to account for securities, which is why it is very important to have a clear guidance and regulations in place. The cases helped us understand various reasonings behind the classifications as well as ways to record significant events. To understand better, we frequently consulted the codification and familiarized ourselves with different exempts from it.
What is more, sales revenue as an essential part of any accounting cannot be overlooked. Although not the only one, but maximizing sales and profit is one of the main objectives of any company. In order to do strategic planning, it is important for a firm to rely on reliable financial statements with accurate data. It is true that the more complex company’s sales process is, the more difficult it is to choose accounting method, but the case helped to investigate one of the more common situations.
To conclude, the investigation of the accounting topics in this course had tremendous impact on me as a future professional, building the necessary foundation of knowledge and skills.
TABLE OF CONTENTS
Title Page ... i
Abstract ... ii
Takeaways from the Course... iii
Table of Contents ... vi
Home Heaters, Inc ... 1
Molson Coors Brewing Company ... 11
Pearson ... 16
Solving Intermediate Problem ... 21
Palfinger AG ... 25
Volvo Group ... 30
Splunk ... 35
Rite Aid ... 41
Merck & Co ... 47
State Street Corporation ... 52
Zagg ... 58
Apple ... 66
Case «Home Heaters, Inc»
Investment Decisions
2 Introduction.
This case provides financial information for the two following companies:
Glenwood Heating, Inc. and Eads Heaters, Inc. Operating in Colorado and selling the same product, these two companies compete in the same field, which means the company that performs better will be chosen for an investment. According to the analysis,
Glenwood appears to be the better company to invest in based on a careful consideration of transactions, methods of operations, financial statements, and ratios.
It was important to consider which parts of the statements were valuable to the investors, and this selection depended on the understanding of how business operates.
Personally, I believe that until a person will be involved in a company, he/she cannot fully understand its management, and consequently its accounting. In the class, we do not get the opportunity to apply knowledge to real cases, so this experience was valuable. To finish the case, it was necessary for me to consult not only the books, but the internet, and read the opinions of real investors, which let me understand how complex the process is.
It taught me the principles of investment, excel, official formatting, and auditing. I find that case studying compliments greatly my Intermediate Accounting, Finance, and Marketing classes. I view this case from a completely different angle now compared to the time I tried to figure it out in class. After completing the case, I held more knowledge about the investing decisions and sources I can use to make one. I plan to enhance this knowledge by investigating following cases, which will help me not only in my classes, but in a possible internship.
3 To start the analysis Figure 1-1 identifies several transactions that are true to both Glenwood Heating, Inc., and Eads Heater, Inc. Trial balance is attached to the Figure 1-2 to confirm truthfully represented numbers.
Figure 1-1
Part A: Recording Basic Transactions
Assets = Liability + Equity____
Столбец1 Столбец2 Столбец3 Assets Столбец4 Столбец5 Столбец6 Liabilities Столбец7 Столбец8 Stockholders' EquityСтолбец9
Cash Accounts
receivable Inventory Land Building Equipment Accounts Payable
Note Payable
Interest
Payable Common stock Retained earnings
No. 1 $160,000 $160,000
No. 2 400,000 $400,000
No. 3 -420,000 $70,000 $350,000
No. 4 -80,000 $80,000
No. 5 $239,800 $239,800
No. 6 $398,500
No. 7 299,100 -299,100
No. 8 -213,360 -213,360
No. 9 -41,000 -20,000 21,000
No. 10 -34,200
No. 11 -23,200 $23,200
No. 12 6,650
Figure 1-2
Столбец1 Столбец2 Столбец3 Trial Balance
Debits Credits
Cash $47,340
A/R 99,400
Inventory 239,800
Land 70,000
Building 350,000 Equipment 80,000
A/P $26,440
N/P 380,000
I/P 6,650
C/S 160,000
Div 23,200
Sales 398,500
Other Op 34,200
Int Exp 27,650
4 Figures 1-1 and 1-2 imply that the financial situation was exactly the same for two companies before managers started recording entries. Afterwards, there were several transactions that changed the course of companies’ development – different ways of recording drastically changed the picture portrayed by the companies. Detailed review of their impact on the financial situation of the companies is presented in the Figure 1-3 for Glenwood Heating and in the Figure 1-4 for Eads Heaters. Figure 1-5 is the trial balance, taking into consideration additional transactions.
To begin with, there was a debit of $99,400 to Accounts Receivable, but
managers estimated different percentage for uncollectible receivables. Allowance for Bad Debt Expense accounts of Glenwood Heating, Inc. and Eads Heaters, Inc. were charged
$994 and $4,970 respectively. Next, companies have chosen their own method of recording Cost of Goods Sold: Glenwood decided to use FIFO, while Eads opted for LIFO. This decision reflected on Gross Profit as well, because it influences Cost of Goods Sold. The difference of $11,800 was estimated in favor of Glenwood Heating, Inc in terms of COGS. Depreciation method used was one of the long-term decisions that significantly influenced expenses. Eads Heaters used straight-line depreciation for building, but double-declining balance for delivery equipment, whereas Glenwood Heating recorded all depreciation using the straight-line method. Glenwood Heating finished year with only $19,000 in depreciation, compared to $41,500 in Eads Heaters’
account. Managers of the companies used different approaches, while acquiring
equipment for their companies. On one hand Glenwood made a riskier decision signing an agreement to rent equipment without guarantee of the same cost for next year, but on the other hand Eads’ managers invested in a capital lease agreement of $92,000. The
5 contract included eight percent interest rate, which raised total interest expense to
$35,010, when Glenwood managers recorded $27,650. The tax was estimated to be 25 percent of the income. According to the calculations Glenwood Heating paid $30,914 in taxes. The tax expense for Eads equaled $23,505.
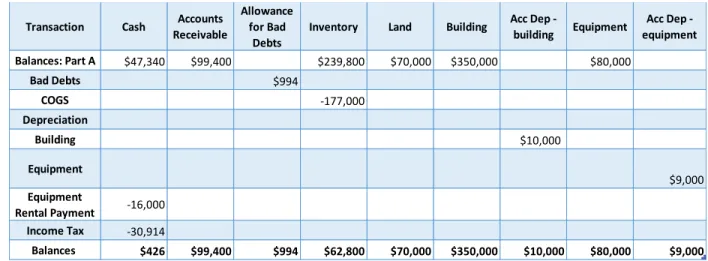
Figure 1-3: Glenwood Heating, Inc.
Part B: Recording Additional Information
Столбец1 Столбец2 Столбец3 Столбец4 Столбец5 Столбец6 Столбец7 Столбец8 Столбец9 Столбец10 Transaction Cash Accounts
Receivable
Allowance for Bad
Debts
Inventory Land Building Acc Dep -
building Equipment Acc Dep - equipment
Balances: Part A $47,340 $99,400 $239,800 $70,000 $350,000 $80,000
Bad Debts $994
COGS -177,000
Depreciation
Building $10,000
Equipment
$9,000 Equipment
Rental Payment -16,000 Income Tax -30,914
Balances $426 $99,400 $994 $62,800 $70,000 $350,000 $10,000 $80,000 $9,000
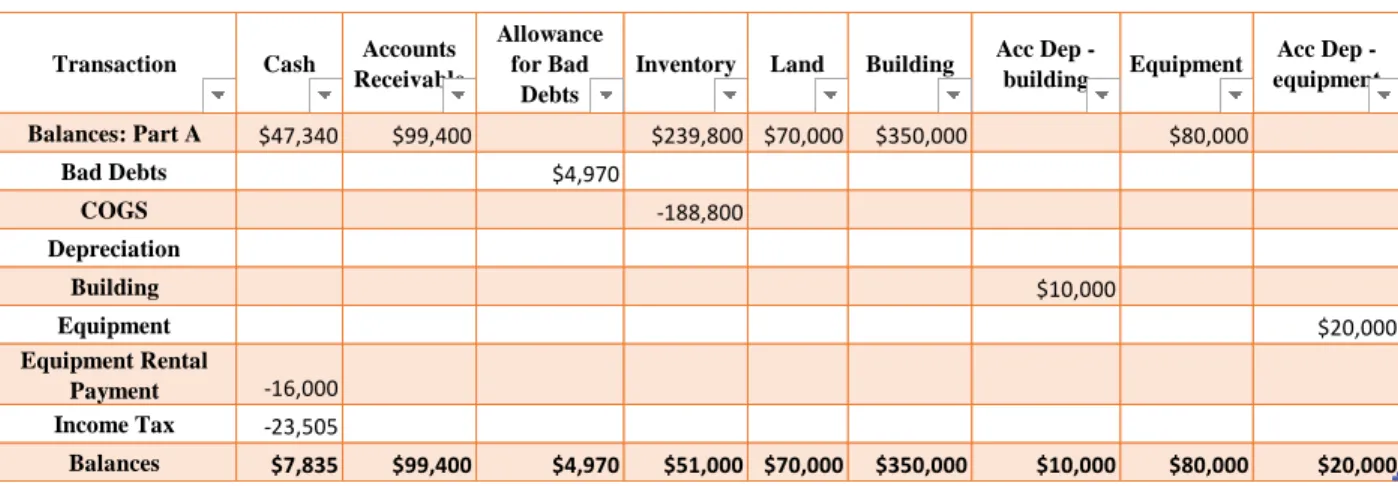
Figure 1-4: Eads Heaters, Inc.
Part B: Recording Additional information
Transaction Cash Accounts Receivable
Allowance for Bad
Debts
Inventory Land Building Acc Dep -
building Equipment Acc Dep - equipment
Balances: Part A $47,340 $99,400 $239,800 $70,000 $350,000 $80,000
Bad Debts $4,970
COGS -188,800
Depreciation
Building $10,000
Equipment $20,000
Equipment Rental
Payment -16,000 Income Tax -23,505
Balances $7,835 $99,400 $4,970 $51,000 $70,000 $350,000 $10,000 $80,000 $20,000
6 Figure 1-5
Part B: Trial balances
Glenwood Heating, Inc. Eads Heaters, Inc.
Столбец1 Debits Credits
Cash $426
A/R 99,400
Allowance for Bad
Debts $994
Inventory 62,800
Land 70,000
Building 350,000
Acc Dep - building
10,000 Equipment 80,000
Acc Dep - equipment 9,000
A/P 26,440
Int/P 6,650
N/P 380,000
Coomon Stock 160,000
Dividends 23,200
Sales 398,500
Cost of Goods Sold 177,000 Other operating
expenses 34,200
Bad Debt exp 994
Dep Exp - building 10,000 Dep Exp - equipment 9,000
Rent Exp 16,000
Int Exp 27,650
Provision for income
tax 30,914
Total $991,584 $991,584
Column1 Dr. Cr.
Cash $7,835
A/R 99,400
Allowance for Bad
Debts $4,970
Inventory 51,000
Land 70,000
Building 350,000
Acc Dep - building
10,000
Equipment 80,000
Acc Dep - equipment 20,000
Leased Equipment 92,000 Acc Dep - leased
equipment 11,500
A/P 26,440
Int/P 6,650
N/P 380,000
Lease Payable 83,360
Coomon Stock 160,000
Dividends 23,200
Sales 398,500
Cost of Goods Sold
188,800 Other operating
expenses 34,200
Bad Debt Exp 4,970
Dep Exp - building 10,000 Dep Exp - equipment 20,000
Dep exp - leased
equipment 11,500
Rent Exp 0
Interest Exp 35,010 Provision for income
tax 23,505
Total $1,101,420 $1,101,420
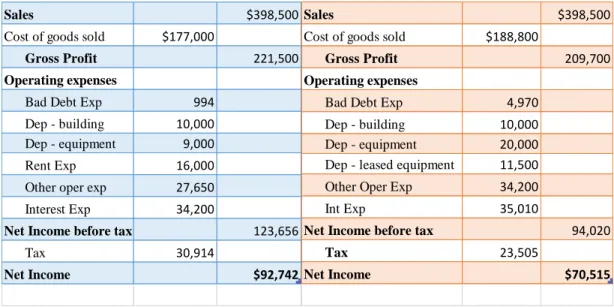
7 Income Statements
Looking at the income statements, it is important to consider Sales Revenue, Cost of Goods Sold, Operating Expenses, and Net Income. Figure 1-6 presents income statement for each company.
Figure 1-6 GLENWOOD CO. INCOME STATEMENT
FYEDECEMBER 31,20X1
EADS CO.
INCOME STATEMENT
FYEDECEMBER 31,20X1
Sales $398,500
Cost of goods sold $177,000
Gross Profit 221,500
Operating expenses
Bad Debt Exp 994
Dep - building 10,000 Dep - equipment 9,000
Rent Exp 16,000
Other oper exp 27,650
Interest Exp 34,200
Net Income before tax 123,656
Tax 30,914
Net Income $92,742
Sales $398,500
Cost of goods sold $188,800
Gross Profit 209,700
Operating expenses
Bad Debt Exp 4,970
Dep - building 10,000
Dep - equipment 20,000
Dep - leased equipment 11,500
Other Oper Exp 34,200
Int Exp 35,010
Net Income before tax 94,020
Tax 23,505
Net Income $70,515
Each company earned $398,500 in sales, but using different method of recording Cost of Goods Sold, Glenwood Heating ended with a larger Gross Profit of $221,500, whereas Eads Heaters performed slightly worse with just $209,700. It is notable that Glenwood Heating spent
$17,796 less on expenses than Eads Heaters, which speaks greatly about their management.
Finally, looking at Net Income, Glenwood positions itself as a more profitable organization with
8
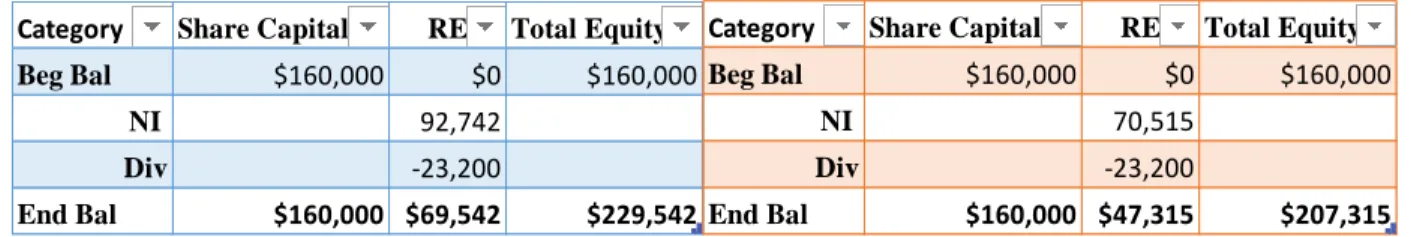
$92,742. Eads Heaters reaches a Net Income of $70,515. Income, in turn, influenced the ending balance of Retained Earnings, which is shown in Figure 1-7. Eads Heaters finished the period with $207,315 in Total Equity, while Glenwood Heating ended up with $229,542.
Figure 1-7 GLENWOOD CO.
STATEMENT OF RETAINED EARNINGS
FYEDECEMBER 31,20X1
EADS CO.
STATEMENT OF RETAINED EARNINGS
FYEDECEMBER 31,20X1
Category Share Capital RE Total Equity
Beg Bal $160,000 $0 $160,000
NI 92,742
Div -23,200
End Bal $160,000 $69,542 $229,542
Category Share Capital RE Total Equity
Beg Bal $160,000 $0 $160,000
NI 70,515
Div -23,200
End Bal $160,000 $47,315 $207,315
Return on Equity was calculated to determine how much profit was generated with invested money.
ROE = NI/Equity
Glenwood Heating, Inc.: 92,742/229,542 = 0.40 Eads Heaters, Inc.: 70,515/207,325 = 0.34
Calculations show that Glenwood Heating, Inc. has higher Return on Equity, which is, therefore, a more attractive choice for investors, because they are potential shareholders
9 Balance Sheets
Balance sheets reflect the amounts of what company own and owe. At that point of time Eads Heaters held more in both Assets and Liabilities as can be seen from Figure 1-8.
To be precise in the assumption which company could pay off the debt, Current Ratios were calculated.
Current ratio = Current Assets/Current liabilities Glenwood Heater, Inc.: $162,626/$33,090 = 4.91 Eads Heater, Inc.: $153,265/$33,090 = 4.63
From the ratios, it is evident that Glenwood Inc. has a better chance to fulfill their obligations.
Conclusion
To conclude, Glenwood Heating, Inc. in comparison to Eads Heaters, Inc. is a more attractive company for investment. It does not only have a higher Net Income, but a Current Ratio, Retained Earnings, and Return on Equity, which will help company to continue perform profitably in the market.
10 Figure 1-8
GLENWOOD CO.
BALANCE SHEET
AS OF DECEMBER 31,20X1
EADS CO. BALANCE SHEET
AS OF DECEMBER 31,20X
Столбец1 Dr. Cr.
Assets Current Assets:
Cash $426
Accounts Receivables 99,400
Allowance for Bad Debt -$994
Inventory 62,800
Non-Current Assets
Building 350,000
Land 70,000
Equipment 80,000
Leased Equipment
Acc Dep - building -9,000
Acc Dep - equipment -10,000
Acc Dep - leased equipment
Total Assets $642,632
Liabilities
Accounts Payable 26,440
Interest Payable 6,650
Notes Payable 380,000
Lease Payable Equity
Common Stock 160,000
Dividends 23,200
$328,958 $971,590
Total Liability + Equity $642,632
Assets Dr. Cr.
Current Assets:
Cash $7,835
Accounts Receivables 99,400
Allowance for Bad Debt -$4,970
Inventory 51,000
Non-Current Assets
Building 350,000
Land 70,000
Equipment 80,000
Leased Equipment 92,000
Acc Dep - building -10,000
Acc Dep - equipment -20,000
Acc Dep - leased equipment -11,500
Total Assets $703,765
Liabilities
Accounts Payable 26,440
Interest Payable 6,650
Notes Payable 380,000
Lease Payable 83,360
Equity
Common Stock 160,000
Dividends 23,200
$351,185 $1,054,950 Total Liability + Equity $703,765
Case «Molson Coors Brewing Company»
Income Statement
12 Introduction
The case presented financial statements for Molson Coors Brewin Company, focusing our attention on the Income Statement. The major objectives were to teach us to differentiate between various elements of the statement, their purpose and usefulness, as well as to analyze the placement of accounts within the statement.
Solving of this case required careful research and proficiency in understanding specific classifications. Thinking through the presented questions allowed me to perceive accounting not as an exact science, but as something adaptable and versatile. Application of different rules creates a conflict of how to best approach the statement. As a result, investigating decisions, that Molson Coors made, helped me to see the reasoning behind them. It is not a typical company, that is why not all the rules apply ordinarily.
a. The major elements of an Income Statement include Revenues, Expenses, Gains, and Losses which are significant to investors and creditors in their decision making. While sales, fees, interest, dividends, rents are typically assigned to Revenues, as cost of goods sold, depreciation, interest, rent, salaries, wages, and taxes to Expenses, it might not necessarily be true for every company. The distinction between Revenues/Expenses and Gains/Losses lies in the company’s set of operation and activities and its treatment of those.
b. «Classified» Income Statement also known as Multiple-step Income Statement one of the formats GAAP requires companies to follow. Multiple-step Income Statement is easier to understand and evaluate. It separates operating and nonoperating activities as well as segregating income tax, discontinued
operations, noncontrolling interest, and earnings per share. This format includes
13 totals and subtotals for gross profit, income from operations, income before tax, net income, earnings per share/net loss per share, making it possible to predict future performance based on how successfully a business entity allocates its resources. I believe that this statement is best characterized by one of the fundamental enhancing qualities of the conceptual framework —
understandability.
c. Persistent income shows earnings that recur from period to period. The more predictable the number is, the more risk-free a company will seem to investors, and the better resources they will have at their disposal. Persistent income indicates that the company is profitable and worth investing into.
d. Net Income found at the end of Income Statement does not necessarily report all business activities, extraordinary gains and losses, and adjustments for prior periods. The net impact of all the elements that affect equity excluding those resulting from investment by owners and distributions to owners, can be found in comprehensive income statement which refers to them as Other comprehensive income.
e. Sales is all amount earned, while Net Sales excludes discounts, allowances, and returns. Molson Coors reports these accounts separately. They have excise taxes levied on their product’s shipment. Excise taxes are related to manufacturing rather than selling, which is why these taxes are applied before Net Sales are calculated. Molson Coors disclosed in the notes that Sales are stated net of
incentives, discounts, and returns. They do not show the adjustments made on the income statement, because those are infrequent for their company. Molson Coors
14 lacks standard practice for returns, and treats discounts and allowances as a
reduction of sales.
f.
i. Special items are recorded in the Income Statement as an unexpected, infrequent, and extraordinary gains or losses that are not likely to recur in future periods. Special items listed by Molson Coors are employee-related charges, impairment or asset abandonment chargers, unusual or infrequent items, and termination fees and other gains/losses.
ii. According to a modified all-inclusive concept, companies report
separately following general categories: unusual and infrequent gains and losses, discontinued operations, noncontrolling interest, and earnings per share. Special items of Molson Coors fall into these categories; therefore, they are shown on the income statement.
Inclusion of special items is a truthful representation of company’s financial situation, and investors pay attention to them across periods. Molson Coors discloses that they consider special items “not indicative of [their] current operations”, and “not necessarily non-recurring”, so with a few exceptions I agree with their placement on the income statement.
Most items listed, excluding termination fees and other gains/losses, should be considered unusual and infrequent gains/losses. However, the appropriate place for termination fees and other gains/losses would be in a Discontinued operations section of the Income Statement.
15 g. Molson Coors does not report Other income and expense it under Income from
operations. It is charged to other Comprehensive income. It should not be placed into the operating expenses as they are not associated with normal business operations. When looking over operating expenses, managers seek to find way to lower them, and both Other Income and Expense and Special Items account may interfere with the decisions being made on a normal cycle of business operations.
h.
i. Comprehensive income equals $760.2 (Note that numbers are presented in millions), while Net Income is $567.3; The difference is due to the Other comprehensive income and noncontrolling interests.
ii. All of the items listed in Comprehensive Income have impact on the equity of Molson Coors during current period of operations.
j.1 Effective tax rate = Income Tax Expense/Pretax Income
Effective tax rate = 84/654.5 = 12.8%
Effective rate of 12.8 percent calculated above indicates the amount of money company pays in terms of the income. The lower the effective tax rate is, the better for the company.
In conclusion, Molson Coors is a complex company that modified their Income Statement according to their operations. Despite the changes that could have been made, the company succeeded in the reporting, and presented fair statement to the audience.
1. — “i.” part of the case was omitted from explanations.
Case «Pearson»
Accounts Receivable
17 Introduction.
Pearson case narrows our research to the accounts receivable portion of the financial statements. Accounts Receivable is one of the most important accounts of any company, second only to cash. A company would pay its liabilities, invest, and operate solely on the revenue it earns, so it is essential to understand the concept of uncollectible amounts. We, as accountants, must understand how the timing and the creditworthiness of the debtors will affect the calculation of the bad debt expense. After all, it would influence other elements as well, for example, opinions of the users of financial statements and future estimates of allowance for doubtful accounts.
From the research of the case, it became evident that there are things that influence allowances outside of what we learned in the principles of accounting. The significance of the account and its contra account in their uncertainty. People do not favor relying on the estimates, so it is of the utmost importance to be able to be as specific as possible when dealing with those accounts. In this case we learned that you must have certain expertise to be able to operate such accounts. One of the most useful tools used for grasping the concepts was building T-accounts with corresponding journal entries.
a. Accounts Receivable, or Loans and Receivables, is a current asset account that indicates the amount owed to the company for the services provided. Accounts receivables are also called trade receivables.
b. There is a distinct difference between Accounts Receivable and Notes
Receivable. Company is likely to collect money for Account Receivable in 30 to 60 days, depending on the oral promises customers make. Notes receivable can be regarded as both short-term or long-term and are always based on a written
18 promise. Notes receivable are almost always interest bearing, whilst accounts receivable are not.
c. A contra account’s balance is the opposite of the normal balance for a specific account. Pearson has two contra accounts that are associated with trade
receivables: Allowance for Bad and Doubtful Debts, and Allowance for Sales Returns. They capture estimated amount of the receivables uncollectible from customers, and sales returned. Managers make their assumptions based on the percentage of sales and experience of the previous years.
d. There are two ways to estimate uncollectible accounts receivable: the
percentage-of-sales procedure and the aging-of-accounts procedure. Although the T-accounts look the same for these two methods, they differ in what company needs to estimate and plug-in. In the aging procedure company computes ending balance of Allowance for Uncollectible accounts, calculating allowance that will need to be added to the Beginning Balance to get to Ending Balance after
subtracting Write-Offs. On the contrary, firms that use percentage-of-sales procedure need to estimate allowance number first, plugging-in what sum should end in the Ending Balance. It should be mentioned that in these two approaches one composite rate usually used for percentage-of-receivables, while an aging schedule is set-up for aging-of-accounts that accounts for various age categories.
The latter is more accurate, because it carefully considers past experiences for different group of uncollectible accounts.
e. Extending credit allows more customers to pay amount they owe to the firm. If managers have not considered that some of the customers will be able to pay later,
19 they would lose possible profit and it would be difficult to adjust. The risk is that the company cannot estimate these amounts accurately but will still rely on these numbers.
f. Differences to the balances are mostly due Income Statement movements and Write-Off of Accounts Receivable accounts as can be seen from the Figure 3-1.
Currency exchange and Acquisition through business combination also made an impact. Out of all beforementioned accounts only Bad Debt Expense appears on the Income Statements in the section of Selling and Administrative Expense, while Allowance for D/A and A/R belong to the Balance Sheet.
i. Figure 3-1 Allowance for D/A Dr. Cr.
72
5 26
20 3 76
Note that all numbers are in millions.
Bad Debt Exp 26
Allowance for D/A 26 Allowance for D/A 20
A/R 20
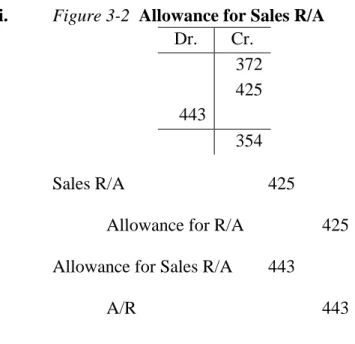
g. Allowance for Sales R/A, Allowance for R/A, And A/R are all reported to
Balance Sheet. Sales R/A, on the contrary, is posted to the Income Statement as a contra revenue account, which is demonstrated in the Figure 3-2.
20 i. Figure 3-2 Allowance for Sales R/A
Dr. Cr.
372 425 443
354
Sales R/A 425
Allowance for R/A 425 Allowance for Sales R/A 443
A/R 443
h. As we can see from the T-account amount of Gross Credit Sales decreased due to Cash Collections, Write-offs, and Sales Returns(actual), and increased, when we added Sales revenue.
Figure 3-3 Gross Credit Sales Dr. Cr.
1474 17 20 425 443 1419
A/R 425
Sales 425
Cash 17
A/R 17
Sales R/A 443
A/R 443
Case «Solving Intermediate Problem»
Accounts Receivable and Bad Debt Expense
22 Introduction.
Out of three chapters given as a choice, I felt like the most recent chapter we covered, namely Receivables, was the one I struggled the most with. In order to help new generation of Intermediate Accounting students understand the concepts of receivables better, I created a study guide that highlighted basic concepts for recording the transactions. As one of the best ways to understand something is to teach it to someone, I think that this case prepared me for a part of my next intermediate exam well. Knowing how to break things down, and how to explain it to someone with no background knowledge of it, helps to work on problem-solving skills and ability to follow logical conclusions. This concept might be used for the future topics and applied to different subjects in college.
P7-6, Intermediate Accounting
Journalize Various Accounts Receivable Transactions.
The Balance Sheet of Starsky Company at December 31, 2016, includes the following.
Notes receivable 36,000
Accounts receivable 182,100
Less: Allowance for doubtful accounts 17,300 200,800 Instructions:
Prepare all journal entries necessary to reflect the transactions below.
Transactions in 2017 include the following.
1. Accounts receivable of $138,000 were collected including accounts of $60,000 on which 2% sales discounts were allowed.
Cash 136,800
Sales Discounts 1,200
A/R 138,000
23 To make this entry, firstly, we need to estimate the discount, which is simply multiplying
$60,000 by two percent. Subtracting the estimated discount from expected receivables of $138,000, we get the amount of actual cash received: $138,000 — $1,200 =
$136,800. To balance debits and credits we included Sales Discount in the journal entry.
2. $5,300 was received in payment of an account which was written off the books as worthless in 2016. It is essential to know what was an initial entry for a write-off, if we need to reverse it. Write-offs are uncollectibles that company believes will never be received. To write-off an account, we debit Allowance for Doubtful Accounts, and Credit Accounts Receivable. Therefore, a recovery of this write-off will be:
A/R 5,300
All for D/A 5,300
We should also recognize cash earned:
Cash 5,300
A/R 5,300
Posting both entries is crucial to the accuracy on the Balance Sheet.
3. Customer accounts of $17,500 were written off during the year.
In the previous step, we have already understood how to write-off an account. Using that knowledge, the entry will be as follows:
All for D/A 17,500
A/R 17,500
Company recognizes that it is likely to never receive beforementioned payments.
4. At year-end, Allowance for Doubtful Accounts was estimated to need a balance of
$20,000. This estimate is based on an analysis of aged accounts receivable. Referring to the given information, we see that the ending balance in the Allowance for Doubtful
24 Accounts is $17,300. In order to create the entry that we also need to consider all the previous entries we posted and their impact on the account. The easiest way to do that is to create a T-account (refer to Figure 4-1).
Figure 4-1 Allowance for D/A
Dr. Cr.
17,300 5,300 17,500
5,100
The estimated ending balance equals to $5,100, but the fourth question asks us to up this amount to $20,000. Starsky Co understated the account by $14,900 ($20,000 —
$5,100), which means we will need to increase both Bad Debt Expense and Allowance for Doubtful Accounts.
Bad Debt Exp 14,900
All for D/A 14,900
Case «Palfinger AG»
Property, Plant, and Equipment
26 Introduction
Before this case, I could not even imagine such specific issues can arise from the decisions managers make on valuating Property, Plant, and Equipment. It was astonishing to find reasons why the numbers on the financial statements on something as specific as buildings, equipment, or even land may differ. However, the most important part of this case demonstrated how the practical application of depreciation varies depending on its methods. From the following research, ambiguity of perspective became apparent, so the conclusion is that each company should customize their cost allocation. It was interesting to see how depreciation methods resulted in gains or losses. I could say that the part I enjoyed the most was studying self-constructed assets. I believe that this one of the major parts of Property, Plant, and Equipment for any company, because it can involve so many other projects, for instance, government grants.
Although the case helped me understand Property, Plant, and Equipment better as a whole, it raised a lot of yet unanswered questions. I will use this intellectual curiosity to inspire myself to explore more endless accounting world.
a. There should be several things included in Palfinger’s Property and Equipment.
It is predicted that they own land with warehouses and manufacturing facilities for their inventory. Equipment will not only include transportation, such as trucks, but also elevators/cranes, because the company manufactures large and heavy products. They will need mechanical assistance with lifting and handling those.
b. €149,990 of PPE represents the historical cost of purchasing and bringing to its intended use all the assets company owns.
27 c. They disclose that PPE consists of: Land and buildings, Undeveloped, Plant and
machinery, Other plant, Fixtures, fittings, and equipment, Prepayments and assets under construction.
d. Prepayments and assets under construction sub-account stands for the self- constructed assets under GAAP. It means that these are the buildings built by the company itself. They are not depreciated yet, because they are either not finished or not used in the operations yet. This account also includes expenses that are being prepaid. Palfinger acquired control over prepaid payments, and/or finished self-constructed building which is shown in Reclassification account, adding value to the PPE. It is a type of clearing account.
e. Straight-line depreciation seems like a reasonable depreciation method for the company, but the detailed quantitative analysis shown in part j revealed that double-declining-balance method will better reflect on the company on the financial statements, because gain will be recorded.
f. They report modifications as the current expenses during the year they are
actually incurred. Alternatively, modifications can be either treated as an increase to depreciation or as a part of an asset if Palfinger reevaluates cost of said asset.
g. i. The purchases for 2007 are reported in the amount of €61,444 as they disclose in the notes.
ii. Governmental grants are financial or different type of the assistance
government provides upon completion of some requirements. They are deducted from PPE because, the cost of bringing asset to its intended use reduces the depreciation account. There was a change of €733 reported at the end of the year.
28 iii. €12,557 is recorded as depreciation.
iv. Net Book Value for the disposal of the assets is estimated as follows:
The cost of the disposal – accumulated depreciation = €13,799 — €12,298 =
€1,501
h. Sale — Net Book Value = Gain/Loss
€1,655 - €1,501 = €154
We see an increase in the value of the asset, so it is a gain upon sale. One of the possibilities is that the value went up because of the natural inflation rate over period of time. The alternative is that the value of the asset itself could increase because of certain modifications in quality or functions.
i. Assuming two different methods of depreciation, namely Straight-line and Double-declining-balance, as well as final salvage value of net assets at €1,273, the table was prepared. It shows year to year recording of depreciation.
Year
Depreciation Expense
Net Book Value
Year Depreciation Expense
Net Book Value
2007 € 1,880 € 8,793 2007 € 4,269 € 6,404 2008 € 1,880 € 6,913 2008 € 2,562 € 3,842 2009 € 1,880 € 5,033 2009 € 1,537 € 2,305 2010 € 1,880 € 3,153 2010 € 922 € 1,383 2011 € 1,880 € 1,273 2011 € 110 € 1,273
j.
i. If Palfinger uses straight-line and does not depreciate for the year of sale, 2008, then the net book value will equal €8,793. Using the formula from before: Sale — Net Book Value = Gain/Loss, we calculate the loss on disposal of an asset of
29
€1,293(€8,793 — €7500). Adding to the loss amount depreciation expense of last year, we conclude that the total impact on income statement is €3,173.
ii. However, if the company uses double-declining-balance net book value of the asset will be significantly less, only €6,404. In this case, Palfinger will record a gain: €7,500 — €6,404 = 1,096. It must be noted that total impact on the income statement will be the same amount of €3,173 when gain is subtracted from depreciation.
iii. The total impacts are identical in the end, but in the first example Palfinger reported loss rather than gain as shown when using double-declining method. As was stated in part e the double-declining-method will seem more favorable to the outsiders of the company.
Case «Volvo Group»
Research and Development
31 Introduction
Working on the Volvo case taught us a lot about Research and Development costs, and especially their difference under American and international laws. Although research and development costs are reported together, there is an important distinction between the two that makes accounting for them even more challenging. The expenditures incurred can be capitalized as a part of an intangible asset or expensed directly to the Income statement. It was important to note the relationship between total research and
development costs to net sales, and how the companies adjust the former according to the changes in the latter. I think that research and development is crucial to many companies and understanding how we treat them is essential for us to be able to work for the future clients. Below you can see a detailed conclusion of the finding of my research, and why do they matter in this particular case.
a. Research and development expenses of kr13,193 million would include any expenditures incurred during the process of research only, because Volvo follows IFRS rules rather than GAAP. In that case, they would capitalize costs once technological feasibility is achieved. According to this, internally developed intangibles that are normally expensed under GAAP, will be excluded and capitalized under IFRS. To resume, the main difference in applying international rules will lie in determining the costs in development phase and them meeting requirements to be either expensed or capitalized.
b. As Volvo applies IAS 38, there are several principles they follow in order to expense or capitalize a certain cost. First of all, if said expenditure has a high degree certainty that will result in future financial benefits they shall be reported
32 as Intangible Assets. However, there are additional criteria to be met. As
mentioned in the notes, one example is to be able to prove a functionality of a product before its development costs are reported as an asset. That would mean that timing is important, as the company will normally be able to capitalize expenditures only during the industrialization phase of a product.
c. Volvo states that amortization period for Product and Software development is three to eight years. Amortization expense is matched with the revenue its asset drives, so we can conclude that Volvo chooses the period according to the useful life of the asset and spreads the cost over it. Volvo exists for many years, so they should have an accurate representation of usage of their assets.
d. There is a difference between reporting Research and Development costs under IFRS and GAAP that was discussed in the first part of this case. The difference is that you expense R&D under GAAP, but when certain criteria are met,
development under IFRS is either capitalized and amortized or expensed. Both methods have their advantages, but IFRS way seems to be more accurate for more experienced companies. The GAAP method is easier to use and implement, and with given consistency the accuracy approximates more complex IFRS rules.
e. Product and software development, net
i. To find net of the Product and Software development, we need to deduct an amount of the Accumulated Depreciation and Amortization.
kr25,148 — kr13,739 = kr11,409
kr11, 409 is the ending balance for the year, while the starting value is kr12,381 as can be seen from a T-account in the next step.
33 Intangible assets have their own line on the balance sheet: Intangible Assets, that is recorded in Assets’ section.
ii. A T-account is presented in Figure 6-1 to show how depreciation and amortization impact balance of Product and Software development.
Figure 6-1 Product and Software Development, net
Dr. Cr.
12,381
2,602 3,126 448 11,409
f. Figure 6-2 combines Product and Software development costs capitalized, Total R&D expense, Amortization, R&D costs that were capitalized, as well as proportion capitalized during the years of 2007, 2008, and 2009. As we can see from the data proportion capitalized is slowly declining.
Figure 6-2
(in SEK millions) 2007 2008 2009
1) Product and software development costs capitalized during the year 2,057 2,150 1,858 2) Total R&D expense on the income statement 11,059 14,348 13,193 3) Amortization of previously capitalized costs (included in R&D expense) 2,357 2,864 3,126 4) Total R&D costs incurred during the year = 1 + 2 - 3 10,759 13,634 11,925
Proportion Capitalized 19.12% 15.77% 15.58%
g. Refer to Figure 6-3. Volvo is steadily increasing their Total R&D to Net Sales, and while for Navistar there was a fall of 0.48 percent in 2008, they increased the
34 proportion by 1.16 percent in 2009. The difference between the companies is not substantial: the greatest one is around two percent. The other evidence that the numbers are quite comparable is that sales increased and fell in the same years. For example, even though Sales of Volvo fell by approximately 30 percent in 2009, Navistar faced 22 percent decrease in the same year.
Figure 6-3
Volvo 2007 2008 2009
(in SEK millions)
Net sales, industrial operations 276,795 294,932 208,487 Total assets, from balance sheet 321,647 372,419 332,265 Total R&D costs incurred 10759 13634 11925 Proportion of total R&D to Net Sales 3.89% 4.62% 5.72%
Navistar
Total RD 375 384 433
Net Sales 11,910 14,399 11,300 Proportion 3.15% 2.67% 3.83%
Case «Splunk»
Data Analysis in Accounting
36 Introduction.
This case offered us an insight in a technological side of the accounting world.
We know that the data and analytics became the essential part of any company, especially those of accounting providers. Data streams are constantly recorded and stored away, but even though the information gathered is invaluable, there are few platforms that are actually capable of analyzing it. Therefore, we considered one of the most valuable IT companies, namely Splunk Platform, and its current and potential contributions to the accountancy. Despite its relatively small life, 15 years of its operation, Splunk created various applications to assist users and contribute to the society as a powerful economic and analytical tool.
It was important for us to understand how Splunk gathered different types of
companies to create a base for all-rounded IT company. For the company to have success it has to go above and beyond of what other companies offer. The platform proved to be an essential tool in various operations. To conclude, we recommend Splunk to be implemented as a means of system’s progression and improvement.
1. Splunk is a software for searching and analyzing big amounts of data. Splunk (the product) captures, indexes, and correlates real-time data in a searchable repository from which it can generate graphs, reports, alerts, dashboards, and visualizations.
(Woods). The company was founded in 2003 by Michael Baum, Rob Das, and Eric Swan. Throughout the years Splunk acquired a mobile-device data-analytics
company, a cybersecurity startup, as well as allying with U.S government, becoming one of the world leaders in IT service. Splunk strives to gather and analyze data in a way modern customer of all backgrounds will access and use it with ease. The
37 company is not oriented, but makes its largest contributions to the business world, creating technology infrastructures and IT systems to help users make well informed decisions. Splunk is a platform itself, which includes Splunk Enterprise, Splunk Cloud, Splunk Premium Solutions, and Rich Ecosystem of apps and add-ons. Splunk premium solutions are further narrowed in Splunk IT Service Intelligence, Splunk Enterprise Security, and Splunk User Behavior Analytics.
2. From the information posted on the Splunk website, we can conclude that the active utilization of their tools will not require an abundance of special skills. The company prides itself in making information accessible, so the operation of the application should be simple enough for an average user to make use of that information.
Illustrations provide a clear picture of an interactive platform that excels at
summarizing information. In addition, Splunk also assures assistance in implementing its programs. Comparatively, despite its complexity of functions, Splunk stays at the same level of difficulty as Microsoft Excel: while it is true that the user would need to learn certain functions of an application first, but after that the platform would do the rest of the work.
As students we learn similar skills in classes like Accounting Information Systems and Management Information Systems, which focus on the technology part of the business world. Working with databases and using special tools to analyze them could be one of the milestones on the way to mastering platforms like Splunk.
Continuing practice with complex formulas and basics of programming could prove to be of a huge benefit in a further understanding, using, and improving more advanced applications like Splunk.
38 3. Accounting world uses technology in their day-to-day operations, and each decade
proves to be on a completely different level in terms of advancement and usefulness. In this section we will examine various scenarios that show how the Splunk platform could be useful in auditing, tax planning, financial statement analysis, valuation, and advisory.
3a. Audit.
Splunk platform could aid auditors in sampling and vouching as a part of substantive testing. The system would easily detect gaps, errors, and any other misstatements that routinely occur. Already, more and more accountants rely on technologies in that regard.
The programs, that Splunk offers, also contain the protocol for assessing risk and its importance to the firm. While it is still managers’ decisions how to approach the problem, it considerably saves both the time and resources.
Risk assessment is an essential part of auditing. It is usual for an event to repeat itself, which means many threats will resurface throughout life of the firm. The desired application will be a tool that could document and store previous risk assessments, later connecting arising one and referencing to the appropriate solutions. In a way, the
platform would design responses building a complex scheme of solutions to tremendous number of challenges.
3b. Tax.
Tax reporting and compliance utilizes many complex concepts that Splunk could not only analyze, but cross-reference. This is very important for companies that are spread internationally as tax must be reported according to local regulations. The legal
39 aspect of tax varies from country to country, and analysis that Splunk produces could help stabilize reporting for the firm and improve its efficiency without allocating more resources.
Tax authorities, as mentioned in the article published by Ernst & Young, are taking advantage of digitization to introduce new e-invoicing requirements into their national legislation to assist with GST, VAT or other revenue-based taxes (Zöllkau 3). It is believed that introducing technologies as Splunk could not only lower taxes, but also increase return on investment.
Monitoring the impact of new tax regulations around the world is impossible without special applications to simplify the process and significantly reduce hours of gathering steady flow of information. Splunk platform is designed to accept stream of data without loosing nor space nor speed, which makes it indispensable in planning and accounting for tax operations.
3c. Advisory.
Advisory department would benefit from the application called Splunk Quick Start, because it collects, correlates, indexes, and visualizes data from all layers of the infrastructure for quicker root cause analysis and faster troubleshooting. (Splunk website)
Splunk IT Service Intelligence specifically makes it easier for financial analysts.
Not only it simplifies operation for quicker insights, but interactively shows critical issues, giving user an advantage of time to fix it. Implementing the system for the clients would allow for a better time management and would reorganize task approach in a more efficient way.
40 Application Delivery manages complex, highly taxed and interconnected
information systems, which is an operational advantage in a valuating area of accounting.
A machine that sorts out through extensive data, attaching it to proper categories would eliminate the need for several manual operations.
4. From the aforementioned evidence, it is clear that the company should invest and implement Splunk platform. Their application is an asset itself that will benefit people of the company in any department. Talented employees could use it to create and integrate various integrations inside the firm, so it would evolve in a more IT independent entity.
However, Splunk’s clean record does not assure cybersecurity of a high level because of the short-term existence. However, it will help the company to enhance data storage, as well as data’s manipulation, gathering, and analysis. Using the ideas from the previous paragraphs, employees are going to create a new unique and successful way of
performing analytical procedures on a global level. Overall, predicted outcomes outweigh the possible high costs of implementation of these professional applications.
Works Cited
Woods, Dan (2011-01-06). "Business Intelligence and the Data Center". Online version, retrieved on 1/24/2018
Zöllkau, York. EY – Tax Insights for business leaders. №14. Online edition, retrieved on 1/26/2018.