SMITHSONIAN INSTITUTION
MUSEUM
OF
NATURAL HISTORY
ForsalebytheSuperintendentofDocuments, U.S.GovernmentPrinting Office Washington, D.C. 20402-Price$1.50 (papercover)
UNITED STATES NATIONAL MUSEUM BULLETIN 285
Two FORTRAN II Programs for
the Univariate and Bivariate
Analysis of Morphometric Data
THOMAS R. WALLER
SMITHSONIAN INSTITUTION PRESS CITY OF WASHINGTON
1968
Publications of the United States National Museum
The
scientific publications of the United States NationalMuseum
includetwoseries,Proceedingsofthe UnitedStates NationalMuseum and
United States NationalMuseum
Bulletin.
In these series axe published original articles
and mono-
graphsdealing with the collectionsand work
oftheMuseum and
setting forthnewlyacquired facts inthefieldsofanthro- pology, biology, geology, history,and
technology. Copies of each publication are distributed to librariesand
scientific organizationsand
to specialistsand
others interested in the various subjects.The Proceedings,
begun
in 1878, are intended for the publication, in separate form, of shorter papers. These are gathered involumes, octavo insize, with the publication dateofeach paper recordedinthetableofcontentsofthevolume.
Inthe Bulletin series, thefirstof
which was
issuedin 1875, appear longer, separate publications consisting ofmono-
graphs (occasionally inseveral parts)and
volumesinwhich
are collected works on related subjects. Bulletins are either octavo orquartoinsize, depending
on
theneedsofthepres- entation. Since 1902, papers relating to the botanicalcollec- tions of theMuseum
have been published in the Bulletin series under the heading Contributionsfrom
the United StatesNationalHerbarium.This
work
formsnumber
285 of the Bulletin series.Frank
A. Taylor Director, United States NationalMuseum
IV
Contents
Page
1
1
Abstract
Introduction „
Statistics
4
DASAN
: Description ofProgram
Listing of
FORTRAN
II StatementsinDASAN
Input
Data
Preparation forDASAN
AlternativeStatements
and
Subroutines forDASAN
Sample
InputData
forDASAN
Sample Output from DASAN
Error Messagesin
DASAN VPLOT
: Description ofProgram
Listing of
FORTRAN
II Statements inVPLOT
Input
Data
Preparation forVPLOT
Sample
InputData
forVPLOT
^
Sample Output from VPLOT
^
Error Messages in
VPLOT
54 Availability of
Program Decks
55 Literature Cited
23 28 28 30 38 38 39 49 50
Two FORTRAN II Programs for the Univariate and Bivariate Analysis of Morphometric Data
Abstract Two computer
programs, written inFORTRAN
II for theIBM
7094, perform univariateand
bivariate analyses ofmorphometric
dataand
plot bivariate scatter diagrams of pairs of data. Basically,the programsare designed toprocess arrays inwhich
rows (up to 100) represent specimensand
columns (up to 52) representmeasured and computed
variables.Alternatively, aninput array
may
represent asingle organism, forexample
a coiledsnail or a segmented arthro- pod, with the rows representing, respectively, individual whorlsor segments.A
high degreeof adaptability to differ- ent kinds of problems is achieved because of thenumerous
control cardswhich
specify inputand
output format, table headings,and column numbers
of variableson
which opera- tionsaretobeperformed.Program
devices allow for the elimination of zeroes rep- resenting missing dataand
for the conversion of selected columns to logarithms to the base 10.The computed
uni- variate statistics include themaximum, minimum,
observed range, arithmeticmean,
standard deviation, standard error of themean, and
coefficient of variation. Bivariatestatistics include the correlation coefficient, slopesand
intercepts of either regression lines or thereducedmajor
axis, coefficients of relative dispersion,and
factors for the computation of confidence intervals. Finally, the programs plot selected pairs of data on bivariate scatter diagramsand
furnish the end points for the plotting of regression lines or reducedmajor
axes.Introduction Morphometry,
or themeasurement
ofform, isbecoming
in-creasingly important in the study of fossil
and
living orga- nisms.The
usesand
limitations of univariateand
bivariate techniques in the analysis ofmorphometric
data in paleon- tologyhave beensummarized
by Imbrie (1956),and
theap- plication ofsuch analytictechniques inzoology hasbeen de- scribed by Simpson, Roe,and Lewontin
(1960).Inpaleontology, itisoftennecessarytodealwithfragmen- tary specimens in order toobtain samples (groups of speci- mens)
which
are largeenough
to be statistically treated. If the missingdataare represented byzeroes, these zeroesmust be eliminatedfrom
any statistical analysis. Furthermore, if the data are transformed to logarithms,a zero representing the logarithm of one to the base tenmust
be treated statis- ticallyand must
therefore be differentiated from a zero representing missing data.Examples
of other operationswhich may
be required inmorphometric work
are as follows:1. Subtract the thickness ofameasuring platformfrom a
measurement
where, in order to obtain themeasurement,this thickness
had
to be included.2. Convert certain measurements,
which
are invari- ablyin ocular micrometerunits, to millimeters.3. Convert certain measurements, which are in ocu- lar micrometer units only
when
the specimen is small, to millimeters.4.
Compute
thecross-sectionalarea of amuscleorliga-ment, where such
an
area can be approximated by a sim- ple formula, e.g., the area ofa circle ora triangle.5.
Compute measurements
which are thesums
or dif- ferences of other measurements.6. Convert any or all measurements to logarithms.
7.
Compute
ratiosofonemeasurement
toanother.8. Arrange datainorderofdecreasingsizeofoneof the measurements
and
/orpreserve the orderofspecimensin the input.1
UNITED
STATESNATIONAL MUSEUM BULLETIN
2859. Construct bivariate scatter diagrams of ratios
and compute
regression linesorlinesof best lit.The
programs described here, for useon
theIBM
7094,perform allof these operations. In addition, they
punch
out the finalmeasurements and
ratiosand
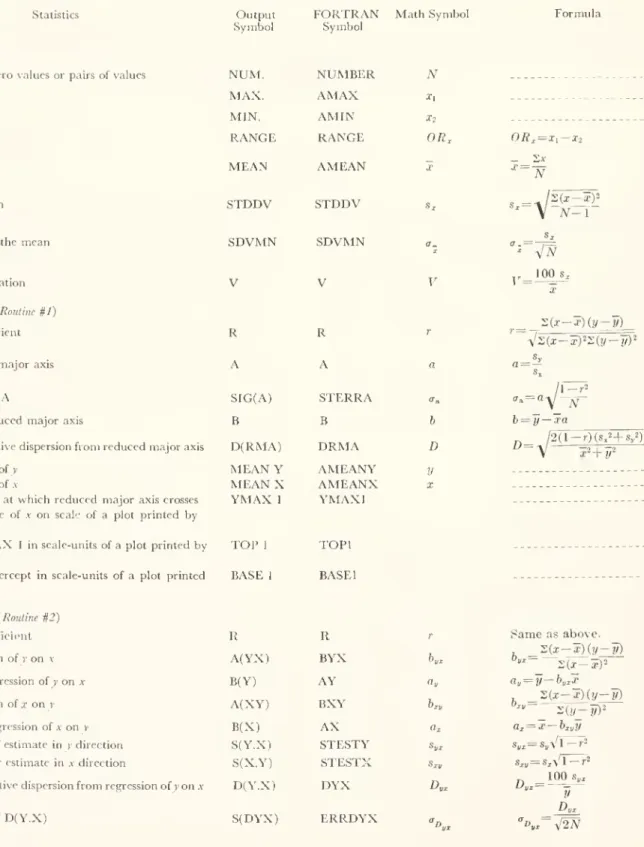
printout thestatistics listed in Table 1.
Table 1.
—
Symbolsand Formulaefor Statistics Computedby Data Assembly andAnalysis(DASAN)
(x or y
=
any variate; *see sectiononstatistics) StatisticsUnivariateStatistics
Number
ofnon-zerovalues or pairs of valuesMaximum
valueMinimum
value Observedrange Arithmetic meanStandarddeviation
Standard error of themean
Coefficient of variation
BivariateStatistics(Routine #1) Correlation coefficient
Slopeofreducedmajoraxis Standarderror of
A
(/-interceptofreduced majoraxis
Coefficient of relative dispersionfrom reduced majoraxis Arithmeticmeanofy
Arithmeticmeanof,v
Ordinate ofpointat which reduced majoraxis crosses
maximum
value of .v on scale of a plot printed byVPLOT
Ordinateof
YMAX
1 inscale-units ofaplotprinted byVPLOT
Ordinate of y-intercept in scale-units ofa plot printed by
VPLOT
BivariateStatistics(Routine#2) Correlationcoefficient Slopeofregression ofyonx Y-interceptof regression of)'on.v
Slopeof regressionofx ony X-interceptofregression of.von y
Standard error of estimatein ydirection Standarderrororestimatein .vdirection
Coefficient of relative dispersionfromregressionofvonx StandarderrorofD(Y.X)
Output Symbol
TWO FORTRAN
IIPROGRAMS FOR
ANALYSIS OFMORPHOMETRY
DATA Table 1.—
Symbolsand Formulaefor StatisticsComputedbyData Assembly andAnalysis(DASAN)
(x ory
=
anyvariate; *see section onstatistics) StatisticsCoefficientof relative dispersionfromregression of xony
StandarderrorofD(X.Y)
Factorforcomputinga confidenceinterval ofA(YX)*
Factorforcomputinga confidenceinterval ofB(Y)*
Factorforcomputinga confidenceintervalofA(XY)*
Factorforcomputingaconfidence interval ofB(X)*
Output Symbol
UNITED
STATESNATIONAL MUSEUM BULLETIN
285DASAN: Description of Program
Construction
and Handling
ofArrays.— The
constructionand
handlingofarraysbyDASAN
isillustratedin Figure 1.Note
thatthe input, referredtoasthe univariate inputarray, contributestoand becomes
partofaunivariateoutputarray.The
latter consists of the univariate input array plus any-new
variables, other than ratios,which
arecomputed from
the input variables. All of the variables represented in the univariate output arraymay
therefore not be univariatein amathematical sense, butthey serve here as the data for a statistical analysis
which
yields the univariate statisticslisted in the introduction.
The
bivariate array consists only ofform
ratios,which
arecomputed from
pairs of variablesdrawn
from the univariate output array.Ineachofthe threearrays,thefirstvariable (first
column)
consists of specimen identification numbers, with the re-
mainingvariables consecutively
numbered from
left toright beginning with variable No. 2.In the schematic
problem
illustrated inFigure 1, the uni- variate input array, containing acolumn
of specimennum-
bers {a)
and
fivecolumns
ofmeasurements
(b through /),becomes
a subarray (A
) within the univariateoutput array.Two
of the original variables,d and
/, are modified so thatand
d'
=
10.18 f'=f-9.45
where
10.18and
9.45 are constantsspecifiedon
controlcards.Four new
subarrays have been generatedand
included in the univariate outputarray.The
subarrayB
containstwo
variables, g
and
h,where
b . c
g=
and
h
=
d' . eThese are special computations
made
possible by the inser- tion of special statements inDASAN,
as described in a fol-lowing section. Subarray
C
consists of variables generated bysubtractingone ofthevariablesinthepreceding columns from another. Let us suppose that hereand
i=b-e i=b-f
Subarray
D
consists of variables generated by adding any twoof thevariables inthepreceding columns.For
example,k=e+h
Subarray
E
consists of the logarithms (base 10) of variables in the preceding columns. For example,l=logMb and
m=logioe
Univariate statistics for all of the variables (except for the specimen identification
numbers)
in the univariate out- put array are computed.Both
univariateand
bivariate statistics arecomputed
for the variables in the bivariate array.In addition to the bivariate statistics
which
arecomputed
for each variable (ratio) in the bivariate array,
an
option existswhereby
a bivariate analysis of xand
y transformed to logarithms (base 10)may
be performed for certain columns, thecolumn numbers
ofwhich
are specifiedon
a control card. Let us suppose that in the sampleproblem
illustrated in Figure 1 a control card specifies that the variables comprising the ratios appearing in
columns
2, 3, 5, 6,and
8 in the bivariate array are to be transformed to logs for an additional bivariate analysis.These
statistics ap- pear in Array IV.The wavy
lines beneath the ratios f'/c, j/d',and l/m mark
those variableswhich were
not desig- nated for logarithmic transformationand
forwhich
the bivariatestatisticsfrom
ArrayIII aremerelyrepeated (with the exception of the coordinates of the end points of the lines of best fitor regressions,which
have been alteredand
are no longer valid).
In the bivariate arrayfor this
same
sample problem, the ratio l/m is the ratio ofone log (log b) to another (log c).
Such
ratioswhich
areconstructedfrom
variables previously transformed to logarithms in the univariate output array cannot beprocessedto yield correct univariateand
bivariate statistics.These
invalidstatistics are indicatedbyawavy
line in Arrays IIand
III.Note
that correct bivariate statistics for thissame
ratio (log b/log c) appear under bjc in Array IV.If the horizontal dimension of an output array exceeds the width of standard output paper, the array
must
be broken into segments, each ofwhich
can be printedon
thecomputer
paper. This has beendone
in the sample output(see listing of sample output)
.
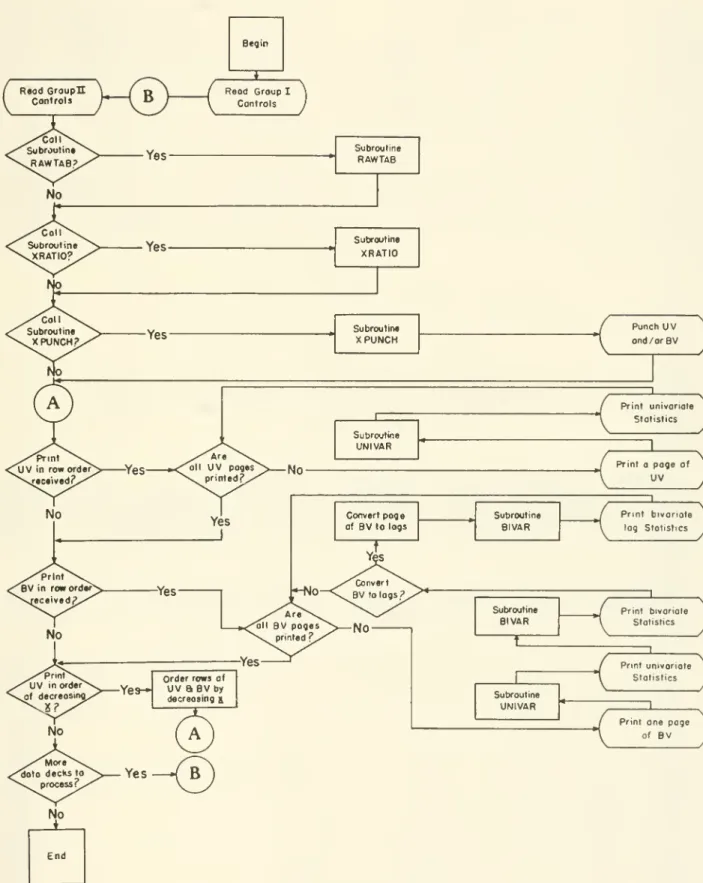
Flow
ofControl.— The
flowofcontrolthroughDASAN
isschematically represented in Figure 2,
and
themain
steps followed by theprogram
duringan
execution involving allsubroutines are listed below:
DASAN
(main)1. Controlcards,variableformats,
and
dataareread in.2. Subroutine
RAWTAB
is called if so indicated by option.TWO FORTRAN
IIPROGRAMS
FOR ANALYSIS OFMORPHOMETRY
DATAUNITED
STATESNATIONAL MUSEUM BULLETIN
285 SubroutineRAWTAB
Each
of the following steps inRAWTAB
is optional, dependingupon
values on control cards.3.
A
read-in constant is subtracted from certain col-umns
of variables, thecolumn numbers
ofwhich
are speci- fied on controlcards.The
results replace the original values.4. Certainvariables, the
column numbers
ofwhich
are specified on control cards,are divided bya read-in constant.The
results replace the original values.5. If so indicated by signalson each data card, certain data cells, the
column numbers
ofwhich
are specified on control cards, are divided by a read-in constant.The
results replace the original values.6. Special variables are
computed
(e.g., the areas of muscle attachments).The
results arenew columns
of vari- ableswhich
areadded
to the original data array.7. Certainvariables,specified on controlcards,aresub- tracted from certainothervariables, also specified
on
control cards.The
results arenew columns
of variablesadded
to the univariate input array.8.
Same
as Step 7, but involving the addition ofvari- ables.9. Certainvariables, specifiedoncontrolcards,arecon- verted to logarithms to the base 10.
The
logsareadded
to the univariate input array ascolumns
ofnew
variables.10. Control is returned to the
main
program.DASAN
(main)11. Subroutine
XRATIO
is called, if so indicated by option.Subroutine
XRATIO
12. Ratios are
computed and
entered in anew
array.The column numbers
ofvariables comprising the ratios are specified on control cards.13. Control is returned to the
main
program.DASAN
(main)14. If so indicated by option, subroutine
XPUNCH
iscalled.
Subroutine
XPUNCH
15.
The
univariate output array ispunched
onto cards according to format specifiedon
control cards.16. Control is returned to the
main
program.DASAN
(main)17. If so indicated by option, the first page of the univariate output array is printed with
no
change in theorder of specimens in the input deck.
18. Subroutine
UNIVAR
is called.Subrout'.ne
UNIVAR
19. Univariate statistics are
computed
from the vari- ableswhich
are to appear on one page of output.20.
The
univariate statistics are printed out below the page of the univariate output array.21. Control is returned to the
main
program.DASAN
(main)22. If
no more
univariate output pages remain to be printed, the option to proceed tothe first page of bivariate output is interrogated. Ifmore
pages of the univariate output array remain to be printed, the next page is printed out, followed by a call toUNIVAR and
printing out of the univariate statistics as in Steps 17 through 21.23. If so indicated by option, the first page of the bivariate array is printed out, with
no
change in the order of specimens in the input deck.24. Subroutine
UNIVAR
is called.Subroutine
UNIVAR
25. Univariate statistics are
computed
from thebivari- ate variableson
a page of output.26.
The
univariate statistics are printed out below the page of the bivariate array.27. Control is returned to the
main
program.DASAN
(main) 28. SubroutineBIVAR
is called.Subroutine
BIVAR
29. Bivariate statistics are
computed
for the ratios ap- pearingon
one page of the bivariate array.30.
The
bivariate statistics are printed out below the univariatestatistics.31. Bivariate statistics for log]0y
and
log10;c arecom-
puted for any or all of the ratios, as instructed by controlcards.
32.
The
bivariate statistics of the log data are printed out below the bivariate statistics of the non-log data.33. Control is returned to the
main
program.DASAN
(main)34.
The number
of bivariate output pages is checked.If
more
remain to be printed, Steps 23 through 33 are re- peated.TWO FORTRAN
IIPROGRAMS
FOR ANALYSIS OFMORPHOMETRIC DATA
Figure 2.
—
Simplified blockdiagram showingthe flow of controlthroughDASAN
andthe major outputoptions.TheabbreviationsUV
andBV
refer,respectively,tothe univariateoutputarrayandthe bivariate array.
A
andB
indicatepointsbetween whichflowlinescannotbeconven- ientlydrawn.8 UNITED
STATESNATIONAL MUSEUM BULLETIN
285 35. Ifno more
bivariate output pages remain, the op-tion to print all data in order of decreasing values of one of the variables, the
column number
ofwhich
is indicatedon
a control card, is interrogated. Ifso indicated, Steps 17 through 34 are repeated (flow returns to connecting pointA
in Figure 2) with an option to print the bivariate arrayin order ofdecreasing values of a specified variable replac- ing the option referred to in Step 23.
36. If
more
data decks remain to be processed, controlis passed back to Step 1 (connecting point
B
in Figure 2) with the readingin ofnew
Group-II control cards (see sec- tionon
input data preparation)and
data. Otherwise the execution is completed.Computation Time. — The
test run ofDASAN
(binary)on the
IBM
7094,which
used the inputand
furnished the output listedand
described in following sections, analyzed 12 specimens,with 28 variables in the input array, 36 vari- ables in the univariate output array,and
42 variables in the bivariate array, in 52 seconds.Core
Space.— DASAN
in itspresent form approachesthemaximum
storageallowed in theIBM
7094. Increasing the dimensions so thatup
to 150 rather than only 100 speci-mens
can be included in a sample resulted inan
overlapof
COMMON and PROGRAM
storage areas.The
maxi-mum
capacityoftheprogram
(in termsofnumbers
of speci- mens)which
can be reached through redimensioning istherefore between 100
and
150.Listing of FORTRAN
IIStatements in DASAN
c c c c c c c
DASAN (MAIN ROUTINE)
PROGRAM FOR THE ASSEMBLY AND ANALYSIS OF MORPHOMETRIC DATA THOMAS R. WALLER, DEPT. OF PALEOBIOLOGY, SMITHSONIAN INSTITUTION
FEBRUARY
6,1967
DIMENSION ANAME(21) ,FMT1(60) ,FMT2(60) ,FMT3(60) ,FMT4(60) ,FMT5(60)
.DMAIN 1FMT6
(60
) ,FMT7( 60
) ,FMT8
(96
) ,IDADDl( 30
) ,IDADD2
(30
)',IDGLAS
(30
) ,IDL0G( DMAIN 230
) ,IDMIN( 30
) ,IDMTR1
(30
) ,IIMTR2
(5) ,IDSUBT( 30
) ,INDXBV( 80
,4)
,MMTRNS
(DMAIN 3100
,5
) ,RATI0( 100
,56
) ,RAW( 100
.53
) ,SPMAX( 53
) ,TEMPI
(53
) ,TEMP2
(56
) ,DMAIN
4VNAME(10,24),SLGMIN(53) DMAIN
1 2 3 4 5
COMMON K, RAW, NLOG,NTRNS, GLASS, OCULAR, NGLASS
,IDGLAS ,NMMTRN, IDMTR1
,DMAIN
61IDMTR2
,NSUB
,IDMIN, IDSUBT
,NADD
,IDADD1
,IDADD2
,IDL0G
,NBIVAR
,FMT8
,FMT2DMAIN
72, FMT3,FMT6,FMT7,SPMAX, RATIO, INDXBV, MMTRNS, SLGMIN,NBVT DMAIN 8
READ INPUT TAPE 5,34, READ INPUT TAPE 5,36.
IF (NGLASS)30,56,55 55 READ INPUT TAPE 5,36, 56 IF (NMMTRN)30,58,57 57 READ INPUT TAPE 5,36, 58 IF (NTRNS)30,60,59 59 READ INPUT TAPE 5,36, 60 IF (NSUB)30,62,6l 61 READ INPUT TAPE 5,36,
READ INPUT TAPE 5,36 62 IF (NADD)30,64,63 63 READ INPUT TAPE 5,36,
READ INPUT. TAPE 5,36 64 IF (NLOG)30,66,65 65 READ INPUT TAPE 5,36 66 READ INPUT TAPE 5,36
NDATA
,L
,NUVT0T
,NBVTOT
,NRTAB
,NRAT NGLASS
,NMMTRN
,NTRNS
,NSUB
,NADD
,NLOG
(
IDGLAS
(J
) ,J=l
,NGLASS
)
(IDMTRI(J)
,J=l, NMMTRN)
(
IDMTR2
(J
) ,J=l
,NTRNS
)
(IDMIN(J).J=1,NSUB)
(
IDSUBT
(J ),J=1, NSUB) (IDADD1(J),J=1,NADD) (IDADD2(J),J=1,NADD) (IDL0G(J),J=1,NL0G) NUVAR,NPAGE1
DMAIN
9DMAIN 10 DMAIN 11 DMAIN 12
DMAIN 13 DMAIN 14 DMAIN 15 DMAIN 16
DMAIN 17 DMAIN 18
DMAIN 19
DMAIN 20
DMAIN 21
DMAIN 22
DMAIN 23
DMAIN 24
DMAIN 25
TWO FORTRAN
IIPROGRAMS FOR ANALYSIS
OFMORPHOMETRY DATA
READ INPUT TAPE 5, 36 ,NBIVAR,NPAGE2 IF (NBVTOT) 30, 68, 67
67 NBVT = NBVTOT
-1
READ INPUT TAPE
5,36
,( (INDXBV(
I,J)
,J=l
,k) ,1=1 ,NBVT) 68 NPTOT = NPAGE1
+NPAGE2
READ INPUT TAPE
5,37,
( (VNAME(
I ,J)
,J=l
,
2k
) ,1=1
,NPTOT)
READ INPUT TAPE
5,36 ,NEMT1 ,NFMT2 ,NFMT3 ,NFMT** ,NFMT5 ,NFMT6 ,NFMT7
,1NFMT8
KK
=12
*NFMT1
READ INPUT TAPE
5,37, (FMTlC I)
,1=1 ,KK)
KK
=12
*NFMT2
READ INPUT TAPE
5,37
,(FMT2( I)
,1=1, KK) KK
=12
*NFMT3
READ INPUT TAPE
5,37
,(FMT3( I)
,1=1 ,KK) KK
=12
*NFMTif
READ INPUT TAPE 5,37, (FMT
if(I)
,I=1,KK) KK
=12
*NFMT5
READ INPUT TAPE
5,37, (FMT5( I)
,1=1 ,KK) KK
=12
*NFMT6
READ INPUT TAPE 5,37 FMT6(l),I
-1,KK) KK = 12 * NFMT7
READ INPUT TAPE 5,37, (FMT7(l),
I -1,KK) KK = 12 * NFMT8
READ INPUT TAPE 5,37,FMT8(l),I=l,KK)
READ INPUT TAPE 5,FMT2, (SPMAX( J)
.J=1,NUVT0T) READ INPUT TAPE 5,FMT2, (SLGMLN(J), J-l,NUVTOT)
1 R^AD INPUT TAPE 5;38,PUNCH,VnU^,WRTTE2,RITHTl,RITHT2,N0RDER READ INPUT TAPE 5,37,ANAME
READ INPUT TAPE 5,39,GI^SS,OOTLAR,ISIDE,K IF (NTRNS)30,U6,U7
1*6
READ INPUT TAPE 5,FMT1, ((RAW(I, J), J=1,L),I-1,K
2*7
READ°INPUT TAPE 5,FMT1, ((MORNS
(I,J)i J=1,NTRNS), (RAW(l, J)
,
J=1,L), 1=1, K)
51 IF (NRTAB)30,^9,^8
1*8
CALL RAWTAB (L,NSPCMP)
1+9
IF (NRAT)30,50,52 52 CALL XRATIO (NBVT) 50 IF (PUNCH) 30, 3,2
2 CALL XPUNCH (NUVTOT, NBVTOT, PUNCH)
1
3
IF (WRTTEl)30,llA
1+
NPTEMP = 1 NPTOT = NV1 = 2 NV2 = NUVAR WRITE1 =0.
5
IF (NPAGE1
-NPTEMP)12,6,6
DMAIN 26 DMAIN 27 DMAIN 28 DMAIN 29 DMAIN 30 DMAIN 31
DMAIN 32 DMAIN 33 DMAIN 3k DMAIN 35 DMAIN 36 DMAIN 37 DMAIN 38 DMAIN 39 DMAIN kO DMAIN kl DMAIN kZ DMAIN
1*3DMAIN
1+1+DMAIN
1*5DMAIN k6
DMAIN
i+7DMAIN
1*8DMAIN k9
DMAIN 50
DMAIN 51
DMAIN 52
DMAIN 53
DMAIN 5k
DMAIN 55
DMAIN 56
DMAIN 57
IDMAIN 58
DMAIN 59
DMAIN 60
DMAIN 61
DMAIN 62
DMAIN 63
DMAIN 6k
DMAIN 65
DMAIN 66
DMAIN 67
DMAIN 68
DMAIN 69
DMAIN 70
DMAIN 71
DMAIN 72
10 UNITED
STATESNATIONAL MUSEUM BULLETIN
285C c
c
c
6 NPTOT
-NPTOT + 1
WRITE OUTPUT TAPE 6,UO,ANAME IF (ISIDE)7,9,8
7 WRITE OUTPUT TAPE 6,kl,K GO TO 10
8 WRITE OUTPUT TAPE 6,k2,K GO TO 10
9 WRITE OUTPUT TAPE
6,1+3,K
10 WRITE OUTPUT TAPE
6,1+5,(VNAME(NPT0T,
J"),J=l,20)
WRITE OUTPUT TAPE 6,FMHk, (RAW(l,l), (RAW(l, J),J=NV1,NV2),I=1,K) CALL UNIVAR (RAW,NV1,NV2,NPTEMP,NUVAR,1,L,NSPCMP,NSUB,NADD) GO TO
511 NPTOT = NPAGE1 12 IF (WRITE2)30,20,13 13 NPTEMP = 1
NV1 = 2 NV2
=NBIVAR NPTMP2 = 1
NR0W1 = 1
NR0W2 = NBIVAR
-1 WRITE2 = 0.
Ik IF (NPAGE2
-NPTEMP)20,15,15 15 NPTOT = NPTOT + 1
WRITE OUTPUT TAPE 6,1+0,ANAME IF (ISIDE) 16, 18,17
WRITE OUTPUT TAPE 6,kl,K GO TO 19
WRITE OUTPUT TAPE 6,^2, K
GO TO 19
WRITE OUTPUT TAPE 6,*+3,K 16
17 18 19
20 21 22 23 2k
WRITE OUTPUT TAPE
6,1+5,(VNAME(NPTOT.J), J=l, 20
)
WRITE OUTPUT TAPE 6,FMT5, (RATI0(I,1), (RATIO(l, J), J=NV1,NV2) ,I=1,K) CALL UNIVAR (RATI0,NV1,NV2,NPTEMP,NBIVAR,2,L,NSPCMP,NSUB,NADD) CALL BIVAR (NR0W1,NR0W2,NPTMP2)
GO TO Ik
IF (RITHTl)30,22,21 WRITE1
=1.
IF (RITBT2)30,2^,23 WRITE2
=1.
IF (RITHT1 + RITHT2) 30,32,25
DMAIN 73 DMAIN Jk DMAIN 75 DMAIN 76 DMAIN 77 DMAIN 78 DMAIN 79 DMAIN 80 DMAIN 81 DMAIN 82 DMAIN 83 DMAIN 8k DMAIN 85 DMAIN 86 DMAIN 87 DMAIN 88 DMAIN 89 DMAIN 90 DMAIN 91 DMAIN 92 DMAIN 93 DMAIN 9k DMAIN 95 DMAIN 96 DMAIN 97 DMAIN 98 DMAIN 99 DMAIN100 DMAINL01 DMAIN102 DMAINIO3 DMAINIOU DMAINIO5 DMAIN106 DMAIN107 DMAIN108 DMAINIO9 DMAINllO DMAINlll DMAIN112
25 K2 = K DMAIN113
TWO FORTRAN
IIPROGRAMS FOR ANALYSIS
OFMORPHOMETRIC
DATA11
26
27
28 29
DO 29 1=1, K2 IP1 = I + 1 DO 29 I2=IP1,K
IF (RAW(l,NORDER)
-MW(I2,N0RDER))26,26,29 DO 27 J=1,NUVT0T
TEMPI (J) = RAW(l,j) RAW(l,j) = RAW(l2,j) RAW(I2,J) = TEMPI (J)
DO 28 J=1,NBVT0T TEMP2(J) = RATIO(l,j) RATIO(l,j) = RATI0(l2.j) RATI0(l2,j) = TEMP2(J) CONTINUE
DMAIN114 DMAIN115 DMAIN116 DMAIN117 DMAIN118 DMAIKL19 DMAIN120 DMAUCL21 DMAHO.22 DMAIN123 DMAIN124 DMAUa25 DMAIN126
30
RITHT1 = 0.
RTTHT2 = 0.
GO TO
3WRITE OUTPUT TAPE 6,hh GO TO 33
DMAIKL27 DMAIN128 DMAIN129 DMAIN130 DMAIKL31 32 NDATA = NDATA
-1
IF (NDATA)33,33,70 70 WRITE OUTPUT TAPE 6,71
GO TO 1 33 CALL EXIT
DMAINL32 DMAHO.33 DMAINI34 DMAIN135 DMAUD.36
C
c
34 36 37 38 39 4o
ill
42
^3 kk
^5 71
FORMAT FORMAT FORMAT FORMAT FORMAT FORMAT FORMAT FORMAT FORMAT FORMAT FORMAT FORMAT
END
(13) (2413) (12A6)
(F2.0,4F3.0,I3) (F6.2/F6.2/I2/I3) (1H1,21A6)
(1H0,I3,12H LEFT VALVES) (1H0,I3,13H RIGHT VALVES) (1H0,I3,10H SPECIMENS)
(1H1,23HANQMAL0US VALVE IN DATA) (lH0,20A6)
(lEL/lHl)
C--- DASAN (SUBROUTINE RAWTAB)
C
SUBROUTINE RAWTAB (L,NSPCMP)
DMAINL37 DMAINI38 DMAIKL39 DMAINLAO DMAINliU DMAXN142 DMAIJGA3 DMAINlH DMAINIU5 DMAIN146 DMAIN147 DMAINLA8
RAWTB
1DIMENSION DUMMY1(390),DUMMY2(100,56),IDADD1(30),IDADD2(30),IDGLAS(RAWTB
2130
) ,IDLOG
(30
) ,IDMIN( 30
),IDMTR1
(30
) ,IDMTR2
(5),LDSUBT( 30
) ,MMTRNS
(100RAWTB 3
2,5),RAW(100,53),DUMMY3(80,4) RAWTB k
COMMON K, RAW, NL0G,NTRNS, GLASS, OCULAR, NGLASS, IDGLAS,NMMTRN, IDMTR1, RAWTB
51IDMTR2
,NSUB
,IDMIN
,IDSUBT
,NADD
,IDADD1
,IDADD2
,IDLOG
,DUMMY1
,DUMMY2
,RAWTB 6
29S-S40
0—69-
12 UNITED
STATESNATIONAL MUSEUM BULLETIN
285C
C
9 10
2DUMMY3,MMTRNS DO 28 1=1,
K
IF (NG LASS) 30,^,1
.
DO
3J=1,NGLASS J2
=IDGLAS(J)
IF (RAW(I,J2))30,3,2 RAW(I,J2)
=RAW(I,J2) CONTINUE
-
GLASS
IF (NMMTRN)30,7,5 DO
6J=1,NMMTRN J2
=IDMTRl(J)
RAW(I,J2)
=RAW(I,J2) / OCULAR IF (NTRNS)30,11,8
DO 10 J=1,NTRNS J3
=IDMTR2(J)
IF (MMTRNS(I,J))9,30,10
RAW(I,J3)
=RAW(I,J3) / OCULAR CONTINUE
RAWTB 7
RAWTB
8RAWTB
9RAWTB 10 RAWTB 11 RAWTB 12 RAWTB 13 RAWTB 1^
RAWTB 15 RAWTB 16 RAWTB 17 RAWTB 18 RAWTB 19 RAWTB 20 RAWTB 21 RAWTB 22 RAWTB 23 RAWTB 2k
C
CC C C C
C CC
CC
C11 Jk
=L NSPCMP
=Jk
=Jk
+ 1NSPCMP
=NSPCMP
+ 112 EAW(I,Jlf) RAW(I,21)
*RAW(I,20)
RAWTB 25 RAWTB 26 RAWTB 27 RAWTB 28 RAWTB 29 ADD ADDITIONAL COMPUTATIONS LIKE STATEMENT NO. 12 IN PLACE OF
THESE COMMENTS. EACH COMPUTATION MUST BE PRECEDED BY jWf
+ 1AND
NSPCMP = NSPCMP
+ 1,AND EACH COMPUTATION STATEMENT BEGINS LIKE STATEMENT NO. 12. WITH RAW(I,J^) ON LEFT SIDE OF
=SIGN. NO STATE- MENT NUMBERS ARE REQUIRED.
IF (NSUB)30,l8,13 RAWTB 30
13 DO 17 J=1,NSUB RAWTB 31
J2
=IDMIN(J) RAWTB 32
J3
=IDSUBT(J) RAWTB 33
J*f
=
J^t+ 1 RAWTB 3k
IF (RAW(l,J2))l5,lif,15 RAWTB 35
Ik RAW(I,J*f)
=0. RAWTB 36
GO TO 17 RAWTB 37
15 IF (RAW(I,J3))16, 1^,16 RAWTB 38
16 RAW(l,J^f)
=RAW(I,J2) - RAW(I,J3) RAWTB 39
17 CONTINUE RAWTB kO
18 IF (NADD) 30,2^f,19 RAWTB kl
19 DO 23 J=1,NADD RAWTB k2
J2
=IDADDI(J) RAWTB
kj>J3
=IDADD2(J) RAWTB V+
Jk
= Jif + lRAWTB ^5
TWO FORTRAN
IIPROGRAMS
FORANALYSIS
OFMORPHOMETRIC
DATA 13IF (HAW(I,J2))21,20,21 20 RAW(I,J^)
=0.
GO TO 23
21 IF (RAW(I,J3))22,20,22
22 RAW(I,J^)
=RAW(I,J2)
+RAW(l,J3) 23 CONTINUE
C
2k IF (NLOG)30,36,25 25 DO 28 J
=1,NL0G
J2
=IDLOG(J) J^
=J^
+ 1IF (RAW(I,J2))30,28,26
26 RAW(I,J*0 = L0G10F(RAW(I,J2)) 28 CONTINUE
GO TO 36 C
30 WRITE OUTPUT TAPE 6,31
31 FORMAT (1H1,23HAN0MAL0US VALUE IN DATA) CALL EXIT
C
36 RETURN END
C--- --- DASAN (SUBROUTINE XRATIO) --- ____
C
SUBROUTINE XRATIO (NBVT) C
DIMENSION DUMMY1( 613)
,INDXBV( 80 ,k
) ,RATI0( 100
,56
) ,RAW( 100
,53
)
C
COMMON K, RAW, DUMMY1, RATIO, INDXBV
C
DO
11=1, K
RATI0(I,1)
=RAW(I,1) J2
=1
DO
111=1, NBVT JY
=INDXBV(II,1) JX
=INDXBV(II,2) J2
=J2
+ 11 RATI0(I,J2)
=RAW(I,JY) / RAW(I,JX)
C
RETURN END
RAWTB kS RAWTB k7 RAWTB kS RAWTB k9 RAWTB 50 RAWTB 51 RAWTB 52 RAWTB 53 RAWTB 5^
RAWTB 55 RAWTB 56 RAWTB 57 RAWTB 58 RAWTB 59 RAWTB 60 RAWTB 61 RAWTB 62 RAWTB 63 RAWTB Gk
RATIO
1RATIO 2
RATIO
3RATIO k RATIO
5RATIO 6
RATIO
7RATIO 8
RATIO 9 RATIO 10 RATIO 11 RATIO 12 RATIO 13
C___-_ _-- DASAN (SUBROUTINE XPUNCH) ---
C
SUBROUTINE XPUNCH
(NUVTOT, NBVT OT, PUNCH)
Q
DIMENSION DUMMY1(320) ,DUMMY2(l73) ,FMT2( 60)
,FMT3(60) ,RATIO( 100, 56) 1RAW(100,53)
C c
COMMON K
,RAW
,DUMMY
1,FMT2
,FMT3
,DUMMY2
,RATIO IF (PUNCH
-2„)1,2,1
1
PUNCH = PUNCH
-1.
PUNCH 1
,
PUNCH 2
PUNCH 3
PUNCH
*tPUNCH
5PUNCH
614 C C
UNITED
STATESNATIONAL MUSEUM BULLETIN
285WRITE OUTPUT TAPE
7,FMT2
,( (RAW(
I,J)
,J=l ,NUVT0T)
,1=1 ,K) PUNCH 7
IF (PUNCH
-l.)3,3,2 PUNCH 8
2 WRITE OUTPUT TAPE 7 ,FMT3
,( (RATIO
(I ,J)
,J=l NBVTOT)
,I=1,K) PUNCH 9
3 RETURN PUNCH 10
END
C__--- DASAN (SUBROUTINE UNIVAR) ---
C
SUBROUTINE UNIVAR (XX,N1 ,N2 ,NPTEMP, NVAR,M,L, NSPCMP, NSUB, NADD) UV
1C
D IMENS ION AMAX
(20
) ,AMEAN( 20
) ,AMIN( 20
) ,ANUM( 20
) ,BNUM( 20
) ,D IFFER( 100UV 2 1,20)
,DIFSQR( 100
,20
) ,DUMMY1
(100 ,53), DUMMY2
(192
) ,FMT6
(60
) ,FMT7( 60
) ,UV 3 2IDL0G2
(100
,20
) ,NUMBER( 20
) ,RAKGE( 20
) ,SDVMN( 20
) ,STDDV( 20
) ,SUM( 20
) ,UV 4
3SUMSQR(20),V(20),X(100,20),XX(100,56),IDL0G(30;,DUMMY3(217) UV 5 C
C
COMMON K
,DUMMY1
,NLOG
,DUMMY2
,IDLOG
,DUMMY3
,FMT6
,FMT7 UV DO 43
I =1,K
DO 43 J
=1,NVAR 43 IDL0G2(I,J)
=IF (M
-1)28,44,29 44 IF (NLOG) 34, 29, 38 38 DO 33 J1=1,NL0G
J2
=L
+NSPCMP
+NSUB
+NADD
+Jl IF (J2-Nl)33,30,30
30 IF (J2-N2)31,31,29 31 J3
=IDLOG(Jl)
J4
=J2-N1
+ 1DO 32 1=1, K
IF (XX(I,J3))34,32,35 35 IDL0G2(I,J4)
= 132 CONTINUE
33 CONTINUE 29 DO
1J=N1,N2
JJ
=J
-Nl
+ 1DO
11=1, K
1
X(I,JJ)
=XX(I,J) NN1
=1
NN2
=N2
-Nl
+ 1DO 3 J=NN1,NN2 AMAX(J)
=X(1,J) DO
3 I =2,K
IF (AMAX(J)
-X(I,J))2,3,3
2 AMAX(J)
=X(I,J)
3
CONTINUE
DO 14 J=NN1,NN2
1 =
1
UV
TWO FORTRAN
IIPROGRAMS
FOR ANALYSIS OFMORPHOMETRY
DATA 15ANUM(J)
=0.
SUM(J)
=0.
39 IF (TDLOG2(l,J))28,4,7 4 IF (X(I,J))7,5,7
5 IF (I-K)6,7,28
6 I = I + 1
GO TO 39
7
AMIN(J)
=XfI,J) SUM(J)
=X(I,J) AN
TJM(J)
=1.
8 I = I + 1
IF (I
-K)40,40,13 40 IF (IDL0G2(I,J))28,9,10
9 IF (X(I,J))10,8,10 10 ANUM(J)
=ANUM(J)
+1.
SUM(J)
=SUM(J)
+X(I,J) IF (AMIN(J)
-X(I,J))8,8,11 11 AMIN(J)
=X(I,J)
12 GO TO 8
13 RANGE(J)
=AMAX(J)
-AMIN(J) 14 AMEAN(j)
=SUM(J) / ANUM(j)
DO 19 J=NN1,NN2
1 = 1
SUMSQR(J)
=0.
IF (IDL0G2(I,J))28,15,17 15 IF (X(I,J))17,16,17 16
I = I +1
IF (I
-K)15,15,19 17 IF (I
-K)l8,l8,l9
18 DIFFER(I,J) = X(I,J)
-AMEAN(J) DIFSQR(I,J)
=DIFFER(I,J) ** 2.
SUMSQR(J)
=SUMSQR(J)
+DIFSQR(I,J) GO TO 16
19 CONTINUE
DO 20 J=NN1,NN2
STDDV(J)
=(SUMSQR(J) / (ANUM(J)
-1.)) ** .5 20 V(J)
=100.
*STDDV(J) / AMEAN(J)
DO 23 J=NN1,NN2 NUMBER(J)
=DO 22
I =1,K
IF (TDL0G2(I,J))28,42,21 42 IF (X(I,J))21,22,21
21 NUMBER(J)
=NUMBER(J)
+1 22 CONTINUE
BNUM(J)
=NUMBER(J)
23 SDVMN(j)
=STDDV(J) / BNUM(j) ** .5 24 GO TO (25,26),M
25 WRITE OUTPUT TAPE 6 ,FMT6
,(NUMBER( J)
,J=NN1
,NN2
) ,(AMAX( J)
,J=uv
J6 UNITED
STATESNATIONAL MUSEUM BULLETIN
2851, (
AMIN( J
) ,J=NN1
,NN2
) , (RANGE
(J
) ,J=NN1
,NN2
) , (AMEAN( J
) ,J=NN1
,NN2
) ,(STUV 85 2DDV(j),J=NNl,NN2), (SDVMN(J), J=NNI
,NN2
) ,(V(J), J=NN1,NN2) UV 86
GO TO 27 UV 87
C
26 WRITE OUTPUT TAPE
6,FMT7
, (NUMBER( j)
,J=NN1
,NN2)
,(AMAX( J)
,J=NN1
,NN2)UV 88
1,
(AMIN(J) ,J=NN1,NN2)
,(RANGE(j)
,J=NN1, NN2
) ,(AMEAN( J)
,J=NN1,NN2)
,(STUV 89 2DDV(J), J=NN1,NN2), (SDVMN(j), J=NN1,NN2), (V(j)
,J=NN1,NN2) UV 90
GO TO 27 UV 91
C
J>k
WRITE OUTPUT TAPE 6,36 UV 92
CALL EXIT UV 93
C
27 NPTEMP
=NPTEMP
+ 1UV
9^+Nl
=N2
+ 1UV 95
N2
=N2
+NVAR
- 1UV 96
C c
36 FORMAT (1H1,23HAN0MAL0US VALUE IN DATA UV 97
28 RETURN UV 98
END UV 99
C---_--- DASAN (SUBROUTINE BIVAR) -__-_-_ ___
C
SUBROUTINE BIVAR
(NR0W1
,NR0W2
,NPTMP2
)
BVRMA
1 CDIMENSION A(20) ,AMEANX(20) ,AMEANY(20)
,B(20)
,BASEl(20) ,DIFFER( 100,2BVRMA 2 1) ,DIFSQR(100,2) ,DRMA(20) ,DUMMY1 (222
),DUMMY2(2*fO) ,DUMMY3( 100
,%) ,FMBVRMA 3 2T8
(96
) ,INDXBV( 80
,k) ,PAIRS
(20
) ,R( 20
) ,RSQ( 20
) ,SPMAX( 53
) ,STDDVX( 20
) ,BVRMA k 3STDDVY( 20
) ,STERRA( 20
) ,SUM2
(2
) ,SUMMUL( 20
) ,SUMSQ2
(2
) ,TOPI
(20
) ,TX( 100BVRMA 5
^,2),X(100,53),YMAXl(20),LGCOL(20),DUMMYMlOO,5),SLGMIN(53) BVRMA 6
CCOMMON K
,X
,NLOG
,DUMMY1
,NBIVAR
,FMT8
,DUMMY2
,SPMAX
,DUMMY3
,INDXBV
,DUMMBVRMA 7
lYif,SLGMIN,NBVT BVRMA
8C
BVRMA 9
BVRMA 10
BVRMA 11
BVRMA 12
BVRMA 13
BVRMA Ik
BVRMA 15
BVRMA 16
BVRMA 17
BVRMA 18
BVRMA 19
BVRMA 20
BVRMA 21
BVRMA 22
BVRMA 23
BVRMA 2k
BVRMA 25
BVRMA 26
BVRMA 27
TWO FORTRAN
IIPROGRAMS FOR
ANALYSIS OFMORPHOMETRIC
DATA17
18
UNITED STATESNATIONAL MUSEUM BULLETIN
285SUMMUL(LL)
=SUMMUL(LL)
+DIFMUL IF (LGT)26,2?,26
26 IF (TX(I,1))20, Ik, 28 28 IF (TX(I,2))20, 14,13 2? IF (X(l,Jl))l2,l4,12 12 IF (X(I,J2))13, 14,13 13 SUMSQ2(l) = SUMSQ2(1)
+SUMSQ2( 2)
=SUMSQ2( 2) 14 CONTINUE
DIFSQR(I,l)
+
DIFSQR(I, 2)
BVRMA 75 BVRMA 76 BVRMA 77 BVRMA 78 BVRMA 79 BVRMA 80 BVRMA 8l BVRMA 82 BVRMA 83 .5
.5
STDDVY(LL)
=(SUMSQ2(l) /
(PAIRS (LL) - 1.))
,STDDVX(LL)
=(SUMSQ2(2) / (PAIRS(LL)
-1.))
*SY2
=STDDVY(LL) ** 2.
SX2
=STDDVX(LL) ** 2.
R(LL)
=SUMMUL(LL) / (SUMSQ2( l)
*SUMSQ2( 2)) **
A(LL)
=STDDVY(LL) / STDDVX(LL) RSQ(LL)
=R(LL) ** 2.
STERRA(LL)
=A(LL)
*((1.
-RSQ(LL)) / PAIRS(LL)) B(LL)
=AMEANY(LL)
-AMEANX(LL)
*A(LL)
(l.-R(LL))
**
.5
A(LL)
+B(LL)
BVRMA 84 BVRMA 85 BVRMA 86 BVRMA 87 BVRMA 88 BVRMA 89 BVRMA 90
.5 BVRMA 91
BVRMA 92 (SX2+SY2) / ((AMEANX(LL)**2.) BVRMA 93 BVRMA 94 BVRMA 95 BVRMA 96 BVRMA 97 BVRMA 98 BVRMA 99 BVRMAIOO BVRMA101 DRMA(LL)
=100.
*(2.
1 +
(AMEANY(LL)**2.))) YMAXl(LL)
=SPMAX(J2) IF (LGT)49,48,49 48 TOY
=SPMAX(Jl) / 49.
GO TO 50
49 TOY
=(SPMAX(Jl)
-SLGMIN(Jl)) / 49.
50 TOPl(LL)
=(YMAXl(LL) - SPMAX(Jl)) / TOY BASEl(LL) = B(LL) / TOY
DO 17 1=1, K
BVRMA102
IF (LGT)15,16,15 BVRMA103
15 X(I,J1)
=TX(I,1) BVRMA104
17 X(I,J2)
=TX(I 2) BVRMA105
SPMAX(Jl)
=TSPMAX BVRMA106
SPMAX(J2)
=TSPMXX BVRMA107
16 CONTINUE BVRMA108
5^ NN
=NBIVAR BVRMA109
IF (M+MM)36,31,36 BVRMA110
31 IF (89-K)45,46,46 BVRMA111
45 WRITE OUTPUT TAPE 6,19 BVRMA112
46 WRITE OUTPUT TAPE
6,l8 BVRMA113
GO TO 39 BVRMA114
36 IF (M)43,42,43 BVRMA115
42 IF (70-K)44,46,46 BVRMA116
44 WRITE OUTPUT TAPE 6,19 BVRMA117
43 WRITE OUTPUT TAPE
6,40, (LGCOL( J)
,J=l
,IM) BVRMA118 39 WRITE OUTPUT TAPE
6,FMT8
,(R( J)
,J=2
,NN)
,(A( J)
,J=2
,NN)
,(STERRA( J)
,J=BVRMA119 12,NN),(B(J),J=2,NN), (DRMA( J)
,J=2
,NN)
,(AMEANY( J)
,J=2
,NN)
,(AMEANX( J)BVRMA120 2,J=2,NN),(YMAX1(J),J=2,NN),(T0P1(J),J=2,NN),(BASE1(J),J=2,NN) BVRMA121
DO 53 J=2,NN BVRMA122
TWO FORTRAN
IIPROGRAMS
FORANALYSIS
OFMORPHOMETRIC
DATA19 R(J)
=0.
A(J)
=0.
STERRA(J) B(J)
=0.
DRMA(J)
=AMEANY(J) AMEANX(J) YMAXl(J) TOPI (J)
=37
38
20
= 0.
0.
= 0.
= 0,
0.
0.
53 BASEl(J)
= 0.IF (MM)37,38,37 M
=1
MM
=GO TO 32
NPTMP2
=NPTMP2 NR0W1
=NR0W2
+NR0W2
=NR0W2
+GO TO 22
+ 1 1
NBIVAR
- 1WRITE CALL
OUTPUT EXIT
TAPE 6,21
BVRMA123 BVRMA12i+
BVRMA125 BVRMA126 BVRMA127 BVRMA128 BVRMA129 BVRMA130 BVRMA131 BVRMA132 BVRMA133 BVRMA13
Z+BVRMA135 BVRMA1J6 BVRMA137 BVRMAI38 BVRMA139 BVRMAl^O BVRMAl^l BVRMAl^-2 21 F0RMAT(1H1,23HAN0MAL0US VALUE IN DATA)
18 FORMAT (1H-,93HBIVARIATE ANALYSIS (REDUCED MAJOR AXIS) OF Y/X 1SULTS NOT VALID FOR COLUMNS OF LOG Y/LOGX.)
19 FORMAT (1H1)
1+0
FORMAT (1H-,80HBIVARIATE ANALYSIS (REDUCED MAJOR AXIS) 1G X VALID ONLY FOR COLUMN(S)
,lOT-VlB, 101A-)
22 RETURN END
BVRMAl^-3
REBVRMAl^
BVRMAl^-5 BVEMA3A6 OF LOG Y/LOBVRMAl^
BVRMAl*f8 BVRMA1^9
C C C C c
- - -
DASAN (SUBROUTINE BIVAR) ---
ALTERNATE SUBROUTINE BIVAR WHICH COMPUTES THE REGRESSIONS OF Y ON X AND X ON Y.
SUBROUTINE BIVAR
(NR0W1
,NR0W2
,NPTMP2
)
BVYXY DIMENS ION AMEANX
(20
) ,AMEANY
(20
) ,AX
(20
) ,AY
(20
) ,BASE2
(20
) ,BASE3
(20
) ,BVYXY 2 1BXY( 20
) ,BYX( 20
) ,CONAX( 20
) ,CONAY( 20
) ,CONBXY( 20
) ,CONBYX( 20
) ,DIFFER( 1BVYXY
3200
,2) ,DIFSQR( 100
,2
) ,DUMMYl( 222
) ,DUMMY2
(2^0
) ,DUMMY3( 100
,56
) ,DUMMY'*
(BVYXY k 3100
,5
) ,DXY
(20
) ,DYX( 20
) ,ERRDXY
(20
) ,ERRDYX( 20
) ,FMT8
(96
) ,INDXBV
(80
,4 BVYXY 5
^),LGC0L(20),PAIRS(20),R(20),RSQ(20),SLGMIN(53),SPMAX(53),STDDVX(20BVYXY 6 5
) ,STDDVY( 20
) ,STESTX( 20
) ,STESTY( 20
) ,SUM2
(2) ,SUMMUL
(20
) ,SUMSQ2
(2
) ,SXBVYXY
76Y(20),SYX(20),T0P2(20),T0P3(20),TX(100,2),X(100,53),XMAX(20),YMAX2BVYXY 8
7(20) BVYXY 9
COMMON K,X,NL0G,DUMMY1, NBIVAR, FMT8,DUMMY2,SPMAX,DUMMY3, INDXBV, DUMMBVYXY 10
1Y^,SLGMIN,NBVT BVYXY 11
M
=BVYXY 12
20 UNITED
STATESNATIONAL MUSEUM BULLETIN
285MM
=IM
-32 DO 16 II
=NR0W1,NR0W2 IF (II
-NBVT)55, 55,54 55 Jl
=INDXBV(II,1)
J2
=INDXBV(II,2) LL
=INDXBV(II,3) LGT
=INDXBV(II,4)
IF (M)22,33,35
35 IF (INDXBV(II,4))34,33,34 34 IM
=IM
+ 1LGCOL(IM)
=LL 33 PAIRS(LL)
=0.
SUMSQ2( 1) = 0.
TWO FORTRAN
IIPROGRAMS FOR ANALYSJS
OFMORPHOMETRY
DATADO
61=1,
K
DIFSQR(I,J)
=DIFFEE(I,J)
=k?
25
7 8
10
DO 9
I =^ K
IF (LGTH7,7,V7
IF (TX(I,1))20,9,25 IF (TX(I,2))20,9,10 IF (x(i,Jl))8,9,8 IF (X(I,J2))10,9,10 DIFFER(I,l)
DIFFER(I,2) DIFSQR(I,l) DIFSQR(I,2) CONTINUE
X(I,J1) X(I,J2) DIFFER(I,l) DIFFER(I,2)
-
AMEANY(LL) AMEANX(LL)
* * 2.
* *
2
.
11 DO Ik 1=1, K
DIFMUL
=DIFFER(I,D
*DIFFER(I,2) SUMMUL(LL)
=SUMMUL(LL)
+DIFMUL
IF (LGT)26,27,26 (TX(I,1))20, 1^,28 (TX(I,2))20, 1^,13 (X(I,J1))12, 1^,12 (X(I,J2))13, 1^,13 SUMSQ2(1) SUMSQ2(2) 26
28 27 12
13 SUMSQ2(1)
=SUMSQ2(2)
=Ik CONTINUE
IF IF IF IF
+
DIFSQR(I,1)
+
DIFSQR(I,2)
1.
1.
))
STDDVY(LL)
=(SUMSQ2(l) / PAIRS LL
- ))STDDVX(LL)
=(SUMSQ2(2) /
(PAIRS (LL)
-BYX(LL)
=SUMMUL(LL) / SUMSQ2(2)
BXY(LL)
=SUMMUL(LL) / SUMSQ2(l) ..
AY(LL)
=AMEANY(LL)
-BYX(LL)
*AMEANX LL AX(LL)
=AMEANX(LL)
-BXY(LL)
*AMEANY(LL) SY2
=STDDVY(LL) ** 2.
SX2
=STDDVX(LL) ** 2.
YY
=BYX(LL) ** 2.
*SX2
S<n sS» ^Vtf f^<"»
RSO(LL) = R(LL) ** 2.
,tt
nn cSTESTY LL)
=STDDVX(LL)
*(1.
-^Q LL - .5
STESTX LL)
=STDDVY(LL)
*(1.
-RSQ(LL) - .5
DXY(LL) =100.
*STESTY(LL) / AMEANX(LL) ERRDXY(LL)
=DXY(LL) /
(2.
.PAIRS (LL
))
DYX(LL)
=100.
*STESTX(LL) / AMEANY(LL) ERRDYX(LL)
=DYX(LL) / (2.
*PAIRS (LL)) CONBYX LL)
=SYX(LL) ** .5 / (STDDVX LL COnIxY(LL)
=SXY(LL) ** -5/ (ST™VY(LL)
CONAY(LL)
=SYX(LL) ** .5 / PAIRS LL CONAX(LL)
=SXY(LL) - .5 /
f IR ^ L /
XMAX(LL)
=SPMAX(Jl)
*BXY(LL)
+AX(LL)
.5 .5
(SY2
-YY) (SX2
-XX)
,* .5
.5 .5
((PAIRS(LL)
-((PAIRS(LL)
-.5) .5)
21
BVYXY 62 BVYXY 63 BVYXY 6k BVYXY 65 BVYXY 66 BVYXY 67 BVYXY 68 BVYXY 69 BVYXY 70 BVYXY 71 BVYXY 72 BVYXY 73 BVYXY Ik BVYXY 75 BVYXY 76 BVYXY 77 BVYXY 78 BVYXY 79 BVYXY 80 BVYXY 81 BVYXY 82 BVYXY 83 BVYXY 8^
BVYXY 85 BVYXY 86 BVYXY 87 BVYXY 88 BVYXY 89 BVYXY 90 BVYXY 91 BVYXY 92 BVYXY 93 BVYXY 9^
BVYXY 95 BVYXY 96 BVYXY 97 BVYXY 98 BVYXY 99 BVYXY100 BVYXY101 BVYXY102 BVYXY103 BVYXYIO^
BVYXY105
BVYXY106
)**.5))BVYXY107
)**.5))BVYXY108
BVYXY1C9
BVYXY110
BVYXY111
22 UNITED
STATESNATIONAL MUSEUM BULLETIN
YMAX2(LL)
=SPMAX(J2)
*BYX(LL)
+AY(LL) BVYXY112
IF (LGT)4 9,48, 49 48 VDY
=SPMAX(Jl) / 49.
VDX
=SPMAX(J2) / 35.
GO TO 50
49 VDY
=(SPMAX(Jl)
-SLGMIN(JI)) / 49.
VDX
=(SPMAX(J2)
-SLGMIN(J2)) / 35.
50 T0P2(LL)
=(YMAX2(LL)
-SPMAX(Jl)) / VDY BASE2(LL)
=AY(LL) / VDY
TOPMLL)
=(XMAX(LL)
-SPMAX(J2)) / VDX BASEJCLL)
=AX(LL) / VDX
BVYXY113 BVYXY114 BVYXY115 BVYXY116 BVYXY117 BVYXY118 BVYXY119 BVYXY120 BVYXY121 BVYXY122 IF (LGT)15,16,15
15 DO 17 1=1, K
X(I,J1)
=TX(I,1) 17 X(I,J2)
=TX(I,2) SPMAX(Jl)
=TSPMAX SPMAX(J2)
=TSPMXX 16 CONTINUE
54 NN
=NBIVAR
BVYXY123 BVYXY124 BVYXY125 BVYXY126 BVYXY127 BVYXY128 BVYXY129 BVYXY130 IF (M+MM)36,31,36
31 IF (8l-K)45,46,46 45 WRITE OUTPUT TAPE 6,19 46 WRITE OUTPUT TAPE
6,l8
GO TO 39
36 IF (M)43, 42,43 42 IF (50-K)44,46,46 44 WRITE OUTPUT TAPE 6,19
43 WRITE OUTPUT TAPE
6,40, (LGCOL(J)
,J=l
,IM)
39 WRITE OUTPUT TAPE
6,FMT8,
(R( J)
,J=2
,NN)
,(BYX( J)
,J
=INN), (BXY(J),J=2,NN), (AX( J)
,J=2
,NN)
,(STESTY( J)
,J=2 2=2,NN),(DYX(J),J=2,NN), (ERRDYX( J)
,J=2
,NN)
,(DXY(J) 3J),J=2,NN), (C0NBYX(J),J=2,NN), (CONAY( J)
,J=2
,NN)
,(
4, (C0NAX(J),J=2,NN), (YMAX2(J), J=2,NN),(XMAX(J), J=2
5,
NN)
, (BASE2
(J
) ,J=2
,NN
) , (TOP3
(J
) ,J=2
,NN)
, (BASE3
(J
)
c
TWO FORTRAN
IIPROGRAMS FOR ANALYSIS
OFMORPHOMETRIC DATA 23 CONBXY(J)
= 0.CONAX(J)
=0.
YMAX2(J)
=0.
YMAX(J)
=0.
T0P2(J)
=0.
BASE2(J)
=0.
T0P3(J)
=0.
53 BASE3(J)
=0.
24 TWO FORTRAN
IIPROGRAMS FOR ANALYSIS
OFMORPHOMETRIC DATA
of specimen identification numbers. (Note that if the
number
for Instruction 2 is maxi-mal, i.e., 53, there is no
room
remaining foradditional univariate variables,
and
the uni- variate output array will consist only of the arrayA shown
in Figure 1.)Punch
in col-umns
2-3.The number
is 73 for the problem in Fig- ure 1.4. (1) :
The number
of variables in the bivariate ar- ray (from to 56), including thecolumn
of specimen identification numbers.Punch
incolumns 2-3.
The number
is 9 for the problem in Fig- ure 1.5. (1) : Signal for the calling of Subroutine
RAW- TAB
(one) or the bypassing ofRAWTAB
(zero),
punched
incolumn
3.RAWTAB may
be bypassed if
no new
univariate variables areto beadded
to the inputarray.6. (1): Signal for the calling (one) or bypassing (zero) of Subroutine
XRATIO, punched
incolumn
3.XRATIO may
be bypassed if no ratios are to becomputed and
if no bivariate analyses are toberun.7- (1) : (a)
Columns
2-3:The number
of univariate input variables (from to 30)from which
a constant, thevalueofwhich
isspecifi