474
EFFECTIVENESS ANALYSIS OF HYDRAULIC TORQUE WRENCH MACHINE USING FAILURE MODE AND EFFECT ANALYSIS (FMEA) AND LOGIC TREE ANALYSIS STUDY CASE ON HEAVY EQUIPMENT MANUFACTURING
Dhadung Prihananto1*, Taufik Roni Sahroni2
Department of Industrial Engineering, Faculty of Engineering, Bina Nusantara University, Indonesia1,2
Received : 04 April 2023, Revised: 24 November 2023, Accepted : 01 December 2023
*Corresponding Author
ABSTRACT
Production quality in terms of process efficiency and quality in the manufacturing industry must always be improved in order to maintain customer confidence. PT XYZ as a heavy equipment assembly company is one of the companies that depends on process reliability for a smooth production process. Based on this, the problems raised in this study focus on increasing the efficiency of the process of installing bolts on slew bearings. By using Overall Equipment Efficiency (OEE) and Process Capability (CpK) as the main benchmarks for measuring the quality of the production process where the latest data shows the average OEE value is at 18.53%, while the CpK value for the bolt tightening process is at 0 ,67. The OEE and CpK figures obtained show that the process quality is still not optimal and needs to be improved. The purpose of this research is to identify and prevent as many factors as possible that can lead to process failure. The methods used to evaluate processes and to identify where and how a process might fail are Failure Mode and Effect Analysis (FMEA) and Logic Tree Analysis (LTA). Both methods are used to identify and prevent as many factors as possible that can lead to a process failure. The results of research using the FMEA and LTA methods show that in the process of installing slew bearing bolts there is a process that needs to be improved because the RPN value is quite high, namely above 125. Some suggestions for improvement such as the use of a manipulator arm on a torque tool and the implementation of a manufacturing execution system (MES) can reduce the RPN value from above 125 to 28, where the process obtained is better than before.
Keywords: Failure and Mode Effect Analysis, Logic Tree Analysis, Overall Equipment Effectiveness, Process Capability, Production Process
1. Introduction
The manufacturing industry is one of Indonesia's largest connecting industries, according to data from the Ministry of Industry, the manufacturing sector's contribution to the national GDP in the second quarter of 2021 was 17.34%. With a demand of 4.5%, it should be noted that the MVA or Manufacturing Added Value for the Indonesian manufacturing industry is the highest among ASEAN nations. Meanwhile, Indonesian manufacturing is ranked ninth globally among all countries. According to Airlangga, Indonesia's manufacturing industry is the largest in ASEAN because Indonesia's economic system is a member of the one trillion-dollar club, which is distinct from that of other ASEAN nations (Kemenperin, 2021).
In the manufacturing industry, numerous processes are required to produce a final product that satisfies the needs of producers and consumers. Initially, everything is in the form of raw materials or parts supplied by suppliers, where it is unclear how the process will conclude. Next, they enter the production or assembly phase, which entails several processes before becoming finished goods or goods ready for distribution. Products are manufactured using empowered raw materials, components, and equipment. Typically, different products have varying quality levels.
Occasionally, there are defective products among perfectly functioning products. When the rate of defective products sent to customers is excessive, the brand's image and reputation will suffer severely. It may reduce sales in the future. Consequently, it is natural to focus on the number of product defects to monitor the production process's quality.
Failure Mode and Effect Analysis (FMEA) is one method for minimizing the likelihood of product defects. FMEA is a step-by-step process for preventing these by identifying all
475
identifiable failures in the assembly, manufacturing, and design processes. In conclusion, it is a structured method for identifying the potential failure points of a process (breakdown) and how failure causes waste, defects, or adverse outcomes (effect) (Carlson, 2012).
The key to maximizing the benefits of FMEA lean manufacturing is its proper implementation and adherence to process findings consistently. It will result in significant manufacturing process improvements. In addition, FMEA reduces troubleshooting and downtime by identifying the causes of typical manufacturing process issues. This procedure is also beneficial to the design procedure. One of the most significant benefits of FMEA is the ability to gather information on how to address issues that disrupt business processes effectively. Then there are the tools used to determine the priority scale based on the Logic Tree Analysis (LTA) results of the FMEA analysis. The objective of preparing a Logic Tree Analysis (LTA) is to assign a priority to each damage mode and conduct reviews and functions, and function failures so that the status of the damage mode, a criticality analysis, and additional information are required.
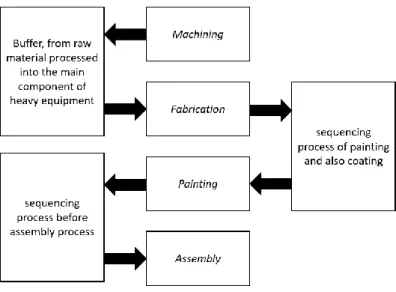
Machining, fabrication, painting, and assembly are the four general stages of heavy equipment manufacturing. The overall machine assembly process is depicted in figure 1 (Nagane, 2002). Production scheduling traverse sequential flows through synchronized workstations based on the takt-time concept. Takt time is the amount of time available to complete tasks at a workstation to produce a single product. Each shop's production equipment is distinct. It requires using different internal production control systems and buffers in each shop. There are various buffer configurations possible. The relationship between pickup speed and cycle time, which influences production targets, is vital in a manufacturing environment.
Fig. 1. The Process Of Assembling Heavy Equipment In General
Sheet metal panels and raw steel are formed during the machining process. Typically, production here is conducted in batches. Due to the inherent nature of the process, this is necessary. It takes time to set up the machine, input the machine program, and place the fixtures and JIG during the machining process. In order to achieve economies of scale for these expensive machines, high-capacity engines are utilized. In addition, fabrication involves welding the parts formed during the machining process. Welding is a process that is typically performed manually or with a robot.
In the paint shop, the process is carried out in small batches based on the unit's color. When a color change is necessary, the spray gun must be cleaned. It causes a loss of both time and paint.
It also increases the cost of treating environmentally hazardous paint components, such as diluents, prior to their release into the environment. A coating process for anti-rust is used in addition to painting.
The assembly shop is the final step in the process, where all the major parts are assembled to create a complete unit. The assembly process of the carbody in a hydraulic mining shovel involves the construction and integration of various components to form the main body structure of the machine. The carbody components, such as side frames, end frames, crossbeams, and other structural elements, are fabricated according to the design specifications. Steel plates and sections are cut, shaped, and welded together to form the main framework of the carbody. Carbody
476
bearings, which provide rotational support, are installed at strategic locations within the carbody structure. Pivot points, such as the swing bearing and slew ring, are mounted onto the carbody to enable the rotation of the upper structure. Electrical wiring harnesses, sensors, and control panels are installed and connected to enable communication between the carbody and the operator cabin.
Control systems for operating the slewing motion, monitoring parameters, and safety features are integrated into the carbody. Once the carbody assembly is complete, a thorough inspection is conducted to ensure proper alignment, structural integrity, and component functionality.
Tightening bolts is a common process in the manufacturing of heavy equipment. The tightening process aims to achieve the correct clamp force for the joint to work and function properly. Correctly tightening bolts involves maximizing the bolts' elastic properties. For the bolt to function properly, it must behave like a spring. The tightening process applies axial pre-load stress to the bolt during operation. These stresses are equal and opposite to the compressive forces applied to the assembled components. It may also be called a "tension load" or a "tightening load".
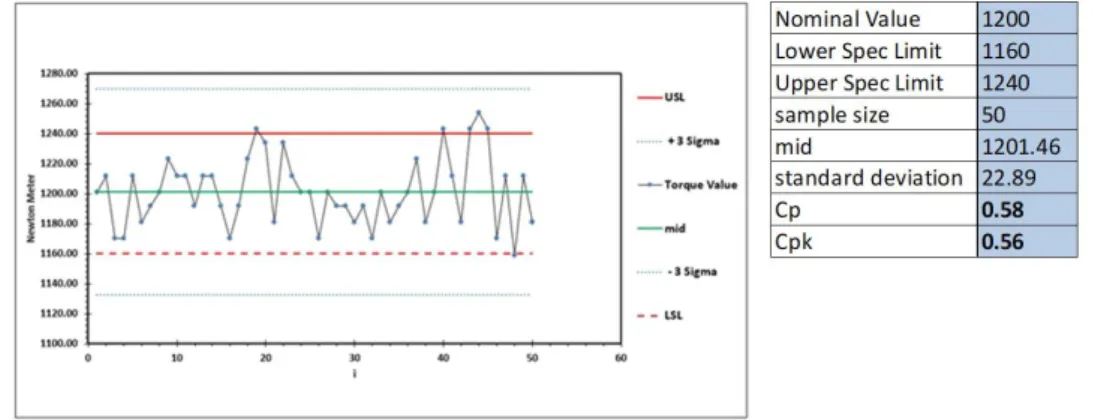
The background of this research is to analyze and transmit a manufacturing process in the heavy equipment industry, where from the observations of researchers the process can still be improved and improved, Figure 2 shows a graph of the process capability of the screw tightening process on slew bearings.
From Figure 2 it shows that the process capability coefficient is still very low, which is around 0.56, and some processes are still out of standard so that it needs to be reprocessed which results in additional production time. Based on these data, it is necessary to make improvements to maintain quality and increase productivity.
Fig. 2. Process Capability Graph of Slew Bearing Assembly
One method to minimize the potential for product defects is to use Failure Mode and Effect Analysis (FMEA). FMEA is a step-by-step process for preventing things that can go wrong by identifying all foreseeable failures in the assembly, manufacturing, and design processes. In short, it is a structured approach to uncovering the possibilities where a process could fail (breakdown) and the ways in which that failure causes waste, defects, or harmful results (effects).
The overall key to getting the most out of FMEA lean manufacturing is its proper implementation and consistent adherence to process findings. This will lead to significant improvements in the manufacturing process. Additionally, FMEA reduces troubleshooting time and downtime by outlining the basis for common problems affecting manufacturing processes.
This procedure also helps in the design process. One of the most significant advantages of FMEA is that it gathers information on how to effectively address issues that disrupt business processes.
Then there are the tools used to determine the priority scale from the results of the FMEA analysis using the Logic Tree Analysis (LTA) method. The purpose of preparing a Logic Tree Analysis (LTA) is to give priority to each damage mode and carry out reviews and functions, function failures so that the status of the damage mode, criticality analysis and additional information is needed.
2. Literature Review
Failure Mode and Effect Analysis (FMEA) has emerged as a pivotal tool in the realm of manufacturing quality management. Previous works in machine tools analysis he failure modes can accurately represent real-world situations and thus assist engineers to formulate accurate improvement guidelines, thereby enhancing the robustness and lifecycle of machine tools (Lo et
477
al., 2019). Research by Mutlu and Altuntas (2019) an approach based on FMEA that integrates the advantages of the fault tree analysis (FTA) method and belief in fuzzy probability estimations of time (BIFPET) algorithm has been proposed in order to improve the performance of the FMEA method. The results of this study show that failure related to fabric trimming adjustment in the tenter has the highest risk priority number. The proposed approach can be used in various industry for risk analysis. In addition, results obtained by the study have indicated that the proposed approach can be implemented in practice to perform comprehensive risk assessment procedures as it reflects real-life dynamics to analyze and assess potential risk.
Research by Wang et al. (2019) presents a novel risk priority model for FMEA by using interval two‐tuple linguistic variables and an integrated multicriteria decision‐making (MCDM) method. The interval two‐tuple linguistic variables are used to capture FMEA team members' diverse assessments on the risk of failure modes and the weights of risk factors. An integrated MCDM method based on regret theory and TODIM (an acronym in Portuguese for interactive MCDM) is developed to prioritize failure modes taking experts' psychological behaviors into account. Finally, an illustrative example regarding medical product development is included to verify the feasibility and effectiveness of the proposed FMEA. By comparing with other existing methods, the proposed linguistic FMEA approach is shown to be more advantageous in ranking failure modes under the uncertain and complex environment.
Implementing FMEA methods, leading to increased productivity and Overall Equipment Effectiveness (OEE) value in practical industry sector (Muthalib et al., 2020; Purwanto & Jaqin, 2021; Rozak et al., 2020). The study identifies the main factors contributing to low OEE values, such as reduced speed loss, idling and minor stoppages, and equipment failure. The output is improvement of overall equipment efficiency and reduce operational losses. Analyzing the Overall Equipment Effectiveness (OEE) and identify big losses is effective to develop corrective action plan and increase productivity and quality in the industry by implementing Total Productive Maintenance (TPM) and other maintenance strategies. The study by Hadisaputra and Hasibuan (2022) also reviews previous research on TPM implementation and its impact on equipment efficiency and productivity. The results offer valuable insights for improving machine maintenance and productivity at the factory (Saifuddin et al., 2022).
Research by Perico (2019) regarding the application of Manufacturing Execution Systems (MES) to support assistance and loss elimination processes in various industries. Perico found most current MES vendors have built lean functionality into their software, but a comprehensive methodology explaining how MES can be used to implement lean manufacturing is lacking. This research aims to fill this gap by presenting a lean-MES framework.
Research by Chen (2020) presents an approach for the creation of an automated Manufacturing Execution System (MES) according to the MDE concept that provides MES functionality relevant to the food and beverage manufacturing process. It consists of the necessary phases to complete the entire MES engineering process. Based on the application presented approach to the brewery brewing process, the feasibility and practicality of this approach were shown to be applicable. The research also identified areas for future work, such as considering real-time execution functions of MES, validation with real production data, and integration with shop floor control and enterprise management systems. Additionally, the need for expanding the range of predefined basic functions and enriching libraries with more modeling elements for different application domains in the food and beverage industry was highlighted.
Research by Mantravadi (2019) is to understand the development of manufacturing execution systems (MES) in the digital transformation era. The theoretical propositions made on MES (based on a survey of the literature) were examined empirically using three case studies in Danish companies. The findings provide an overview of Industry 4.0-ready MES and identification identified in future factories. This research also hides the current MES research related to Industry 4.0 into the key groups to be demonstrated in digital manufacturing.
From various references that have been questioned by the author. This study has the same focus on repairing and evaluating a manufacturing process in the industry using the Failure Mode and Effect Analysis (FMEA) method and logic tree analysis. In this study, the use of the FMEA and LTA methods was applied to the repair process in the heavy equipment assembly industry.
478 3. Research Methods
This This research was conducted to measure the effectiveness of the production process in order to provide recommendations for production machine maintenance planning as well as evaluations of various factors that can affect quality and process efficiency. Overall Equipment Effectiveness (OEE) is one of the methods used to assess the machine's efficiency. Comparing the value of machine availability (availability), work efficiency (performance efficiency), and product quality constitutes an OEE evaluation (quality rate). The Failure and Mode Effect Analysis (FMEA) method and logic tree analysis is also used to determine the various possible causes of process failure.
Many studies using FMEA as a risk analysis technique have shown successful implementation (Wessiani & Yoshio, 2017). Failure modes and effects analysis (FMEA) is one of the first highly structured systematic techniques for failure analysis (Tripathi & Jain, 2017).
FMEA regulates the principle of identifying and prioritizing possible failures or defects (Shivakumar et al., 2015). In PFMEA risk quantification uses indicators (RPN), which are defined as the product of severity (S), incident (O), and failure detection (D) (Rachieru et al., 2013).
Determine corrective and preventative measures based on the various causes of the failure.
This analysis uses RPN calculations to determine which failure rate is the highest. The RPN value is computed based on the relationship between variables, namely severity, failure detection, and frequency, which identifies risks that require corrective action.
Analysis and evaluation come next in the process. Based on the failure mode analysis, we can determine which items must be enhanced based on the priority scale. This enhancement factor can be analyzed using the 4M framework: man, method, material, and machine.
FMEA has been widely applied in several sectors. It is an effective tool for improving and analyzing system quality, and is applied in many industries such as machinery (Lo et al., 2019;
Su et al., 2012; Baghery et al., 2018; Sakthivel & Ikua, 2017), electronics (Wang et al., 2018), chemical industry (Ahn et al., 2017), medicine (Liu et al., 2018; Wang et al, 2019) and Textiles (Mutlu & Altuntas, 2019; Altuntan & Kansu, 2019).
The Overall Equipment Effectiveness (OEE) value is calculated by multiplying the availability, performance, and quality rate.
𝑂𝐸𝐸 (%) = 𝐴𝑣𝑎𝑖𝑙𝑎𝑏𝑖𝑙𝑖𝑡𝑦𝑟𝑎𝑡𝑒 (%) 𝑥𝑃𝑒𝑟𝑓𝑜𝑟𝑚𝑎𝑛𝑐𝑒 (%) 𝑥𝑄𝑢𝑎𝑙𝑖𝑡𝑦𝑟𝑎𝑡𝑒 (%)
Availability is the availability of a machine/equipment, which is the ratio between the operating time and the loading time of a machine/equipment. Then the availability ratio can be calculated as follows:
𝐴𝑣𝑎𝑖𝑙𝑎𝑏𝑖𝑙𝑖𝑡𝑦𝑟𝑎𝑡𝑒 =𝐿𝑜𝑎𝑑𝑖𝑛𝑔𝑡𝑖𝑚𝑒 − 𝐷𝑜𝑤𝑛𝑡𝑖𝑚𝑒 𝐿𝑜𝑎𝑑𝑖𝑛𝑔𝑡𝑖𝑚𝑒 𝑥100
%
Performance Rate is a benchmark for the performance efficiency of a machine that runs the production process. Then the performance efficiency can be calculated as follows:
𝑃𝑒𝑟𝑓𝑜𝑟𝑚𝑎𝑛𝑐𝑒𝑟𝑎𝑡𝑒 =𝐼𝑑𝑒𝑎𝑙𝑐𝑦𝑐𝑙𝑒𝑡𝑖𝑚𝑒𝑥𝑁𝑢𝑚𝑏𝑒𝑟𝑜𝑓𝑜𝑢𝑡𝑝𝑢𝑡 𝑂𝑝𝑒𝑟𝑎𝑡𝑖𝑛𝑔𝑡𝑖𝑚𝑒 𝑥100
%
OEE (Overall Equipment Effectiveness) is the gold standard for measuring manufacturing productivity. OEE can identify the proportion of production time that is truly productive.
Production is said to be perfect if the OEE value reaches 100%. This indicates that the production has completed several elements such as: 100% quality (only good parts), 100% performance, and 100% availability without any downtime (Atmaja et al., 2018).
OEE as a best practice and standard was first introduced in the Total Productive Maintenance (TPM) framework (Nakajima, 1990). Applying multiple methods, such as different lean techniques, also increases OEE scores (Nguyen & Do, 2016; Antoniolli et al., 2017; Lam et al., 2016; Glass et al., 2016). Application of proper engineering methods, for example, the Method of Failure and Effects Analysis (FMEA), will also result in a higher OEE (Dobra & Josvai, 2021).
Higher OEE can also be achieved by increasing the number of shifts in production, but by increasing the length of the shifts.
Overall Equipment Effectiveness (OEE) is a calculation used to determine the effectiveness of equipment. With this method, TPM seeks to maximize output by maintaining ideal operating conditions and equipment/machines running effectively. A tool that is damaged, slowed down, or
479
lacks precision and produces a defective product, the equipment/machine does not operate effectively. To achieve Overall Equipment Effectiveness, TPM works to eliminate six big losses which are heavy obstacles (Winatie et al., 2018).
3.1. Research Stages
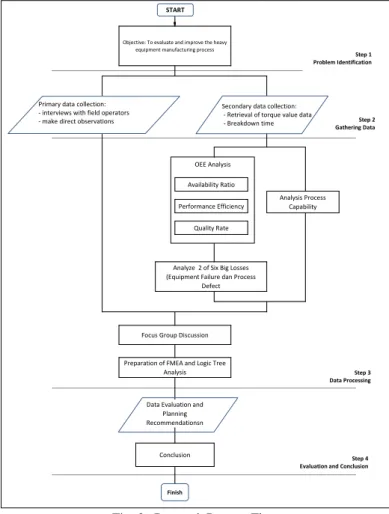
Research stages are an explanation of the steps taken in research that describes the research process from start to finish so that the research is more focused and systematic. Figure 3 is a flow diagram of the research stages.
Collection and search of data is the initial stage of research which later this data is used for analysis to determine recommendations to improve the quality of the process. This study uses two types of data, namely primary data and secondary data.
Primary data is data that was first coined by researchers through effort and direct experience. Data collection was carried out through survey methods, observations, and direct interviews with relevant sources such as production operators, shopfloor section managers and maintenance technicians. Secondary data implies used information that has been collected and recorded by someone other than the user for some purpose. It is an available form of data that is collected from several sources. In this study using secondary data from the production, quality and also maintenance. This secondary data will later be used to calculate OEE and also process capability which will describe the quality and efficiency of the manufacturing process. This secondary data will be divided into 5 subgroups, with 30 data collection each.
Fig. 3. Research Process Flow
3.2. Data Evaluation and Planning Recommendations
From the results of data processing, analysis will be carried out to determine the OEE value, factors causing losses, and from Failure Mode and Effect Analysis to find out what main factors cause process failures. The results obtained will be used as material for improvements to the company and later in the form of recommendations for improvements to the company to increase the effectiveness of the process.
Conclusion Preparation of FMEA and Logic Tree
Analysis
Data Evaluation and Planning Recommendationsn
OEE Analysis Objective: To evaluate and improve the heavy
equipment manufacturing process
Focus Group Discussion Analyze 2 of Six Big Losses (Equipment Failure dan Process
Defect Availability Ratio Performance Efficiency
Quality Rate
Analysis Process Capability START
Finish
Step 1 Problem Identification
Step 2 Gathering Data
Step 3 Data Processing
Step 4 Evaluation and Conclusion Secondary data collection:
- Retrieval of torque value data - Breakdown time Primary data collection:
- interviews with field operators - make direct observations
480 4. Results and Discussions
There were 30 samples collected for each production batch. Using a monitored pneumatic torque wrench, bolt-tightening data is recorded on the pump and extracted using a flash disk.
Quality Ratio
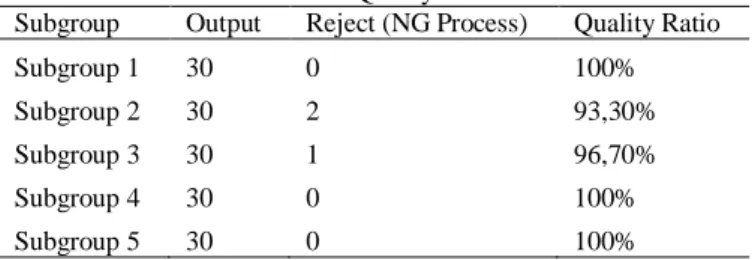
Quality ratio is a ratio that shows the ability of equipment to produce products that comply with standards. The data used in measuring this Quality ratio are output, reduced yield, and rework and reject. Table 1 below show the result of quality ratio of 5 subgroup samples of tightening bolt.
Table 1 - Quality ratio.
Subgroup Output Reject (NG Process) Quality Ratio
Subgroup 1 30 0 100%
Subgroup 2 30 2 93,30%
Subgroup 3 30 1 96,70%
Subgroup 4 30 0 100%
Subgroup 5 30 0 100%
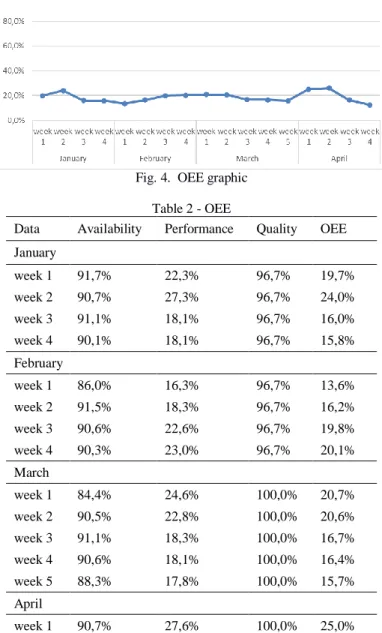
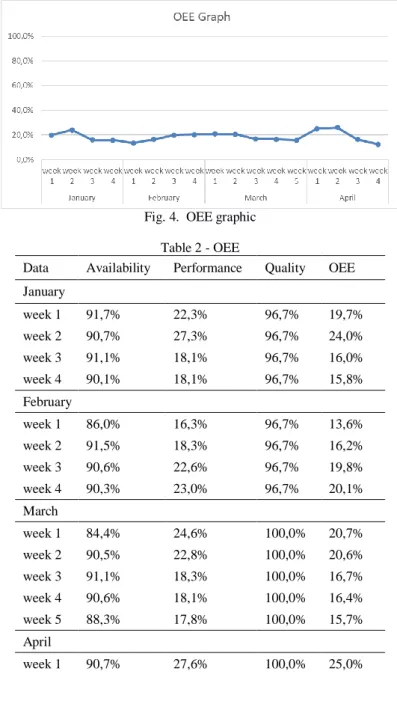
OEE Measurements
After the availability ratio, performance ratio, and quality ratio values are obtained, then the next step is to calculate the OEE value.
Fig. 4. OEE graphic
Table 2 - OEE
Data Availability Performance Quality OEE January
week 1 91,7% 22,3% 96,7% 19,7%
week 2 90,7% 27,3% 96,7% 24,0%
week 3 91,1% 18,1% 96,7% 16,0%
week 4 90,1% 18,1% 96,7% 15,8%
February
week 1 86,0% 16,3% 96,7% 13,6%
week 2 91,5% 18,3% 96,7% 16,2%
week 3 90,6% 22,6% 96,7% 19,8%
week 4 90,3% 23,0% 96,7% 20,1%
March
week 1 84,4% 24,6% 100,0% 20,7%
week 2 90,5% 22,8% 100,0% 20,6%
week 3 91,1% 18,3% 100,0% 16,7%
week 4 90,6% 18,1% 100,0% 16,4%
week 5 88,3% 17,8% 100,0% 15,7%
April
week 1 90,7% 27,6% 100,0% 25,0%
481
week 2 87,0% 29,9% 100,0% 26,0%
week 3 91,1% 18,0% 100,0% 16,4%
week 4 90,7% 13,7% 100,0% 12,4%
Overall 89,79% 20,98% 98,45% 18,53%
From figure 4 and table 2 above, an average value of OEE obtained is 18.5%, which is still below the eligibility standard.
OEE Losses Analysis
It is beneficial, when measuring the value of losses, to identify losses such as equipment damage and hidden losses such as reduced speed. In this measurement, equipment failure losses are calculated by dividing the time between machine damage and repair by the machine's loading time.
𝐸𝑞𝑢𝑖𝑝𝑚𝑒𝑛𝑡𝑓𝑎𝑖𝑙𝑢𝑟𝑒𝑙𝑜𝑠𝑠𝑒𝑠 = 𝐹𝑎𝑖𝑙𝑢𝑟𝑒𝑡𝑖𝑚𝑒 𝐿𝑜𝑎𝑑𝑖𝑛𝑔𝑡𝑖𝑚𝑒𝑥100
%
Defect Losss reflects how much time is available in the machine loading time that is absorbed to produce the product. By multiplying the total damaged by the Actual Cycle Time divided by the loading time of the hydraulic torque wrench machine.
𝐷𝑒𝑓𝑒𝑐𝑡𝑙𝑜𝑠𝑠𝑒𝑠 =𝑇𝑜𝑡𝑎𝑙𝑟𝑒𝑗𝑒𝑐𝑡𝑒𝑑𝑥𝐼𝑑𝑒𝑎𝑙𝑐𝑦𝑐𝑙𝑒𝑡𝑖𝑚𝑒 𝐿𝑜𝑎𝑑𝑖𝑛𝑔𝑡𝑖𝑚𝑒 𝑥100
%
Reduced Yield is the loss of machine loading as a result of absorption of Cycle Time and Standard Time as a result of various things.
𝑅𝑒𝑑𝑢𝑐𝑒𝑑𝑠𝑝𝑒𝑒𝑑 =(𝐴𝑐𝑡𝑢𝑎𝑙𝑐𝑦𝑐𝑙𝑒𝑡𝑖𝑚𝑒 − 𝐼𝑑𝑒𝑎𝑙𝑐𝑦𝑐𝑙𝑒𝑡𝑖𝑚𝑒)𝑥𝑂𝑢𝑡𝑝𝑢𝑡
𝐿𝑜𝑎𝑑𝑖𝑛𝑔𝑡𝑖𝑚𝑒 𝑥100
%
Idle Minor Stoppage Losses are losses that absorb loading time but do not result in processing as a result of waiting for materials, or no processing at all. Minor idle time can also be an indication of optimal job balancing.
𝐼𝑑𝑙𝑒 ∧ 𝑀𝑖𝑛𝑜𝑟𝑠𝑡𝑜𝑝𝑝𝑎𝑔𝑒 =(𝑇𝑎𝑟𝑔𝑒𝑡 − 𝐴𝑐𝑡𝑢𝑎𝑙)𝑥𝐼𝑑𝑒𝑎𝑙𝑐𝑦𝑐𝑙𝑒𝑡𝑖𝑚𝑒
𝐿𝑜𝑎𝑑𝑖𝑛𝑔𝑡𝑖𝑚𝑒 𝑥100
%
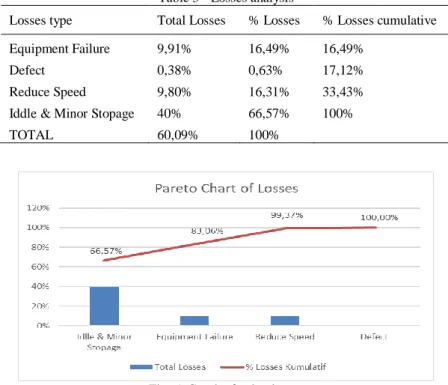
Cause and effect diagrams are used to make it easier to identify root causes to overcome Losses. It can be seen in table 3 that the loss value of 60% means that production efficiency is still low, and to find out the cause can be identified with a cause-and-effect diagram.
Table 3 - Losses analysis
Losses type Total Losses % Losses % Losses cumulative Equipment Failure 9,91% 16,49% 16,49%
Defect 0,38% 0,63% 17,12%
Reduce Speed 9,80% 16,31% 33,43%
Iddle & Minor Stopage 40% 66,57% 100%
TOTAL 60,09% 100%
Fig. 5. Graph of value losses
482
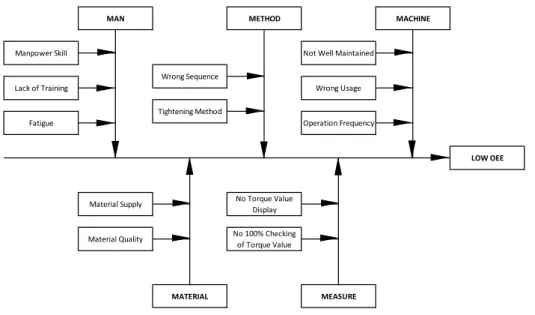
Figure 6 shows a cause-and-effect diagram, and various factors, including lack of maintenance, operator misuse, and usage frequency, can cause equipment failure.
Fig. 6. Fault tree analysis OEE
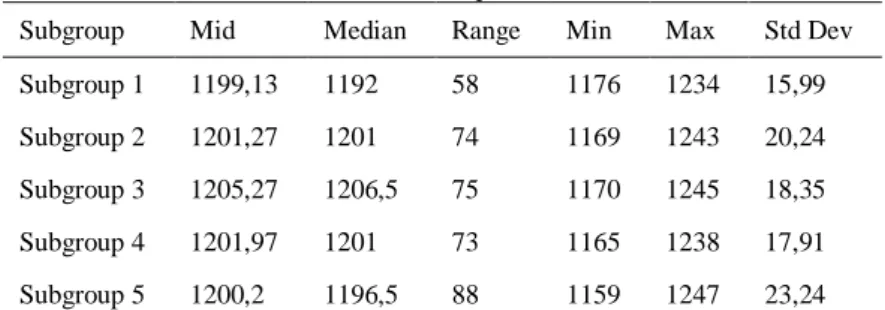
Torque Data Characteristics Analysis
Torque data can describe the torque characteristics of the inner bearing bolt tightening.
Table 4 displays statistical data for each subgroup.
Table 4 - Torque data
Subgroup Mid Median Range Min Max Std Dev
Subgroup 1 1199,13 1192 58 1176 1234 15,99 Subgroup 2 1201,27 1201 74 1169 1243 20,24 Subgroup 3 1205,27 1206,5 75 1170 1245 18,35 Subgroup 4 1201,97 1201 73 1165 1238 17,91 Subgroup 5 1200,2 1196,5 88 1159 1247 23,24
Table 4 shows that the average torque required to install inner bearing bolts for subgroup 1 is 1199.13 Nm; subgroup 2 is 1201.27 Nm; subgroup 3 1205.27 Nm; subgroup 4 is 1201.97 Nm, and for subgroup 5 is 1200.2 Nm. The data presented in Table 4 is derived from the subgroup.
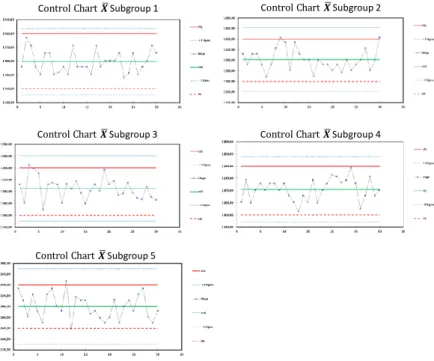
Then, use a control chart (X) to determine whether the inner bearing tightening process follows a particular pattern in each subgroup (1–5). Figure 7 shows that there are no sample data outside the control limits in the graph of subgroup 1, with an average torque value of 1199.13 Nm, the upper control limit being 1240 Nm, and the lower control limit is 1160 Nm. It is also known that the data graph lacks a discernible pattern, allowing it to be inferred that the mean process in subgroup 1 has been statistically controlled.
With an average torque value of 1201.27 Nm, the upper control limit is 1240 Nm, and the lower control limit is 1160 Nm; subgroup 2 data showed sample data outside the control limits.
The data that exceeds the control limits are all within the upper control limits. The subgroup 2 sample data shows that process improvement is required to maintain the process statistically.
With an average torque value of 1205,27 Nm, Subgroup 3 data shows that data samples are outside the control limits. The upper control limit is 1240 Nm, and the lower control limit is 1160 Nm. The data that exceeds the control limits are all within the upper control limits. The sample data from subgroup 3 shows that process improvement is required to maintain the process statistically.
ith an average torque value of 1200.20 Nm, an upper control limit of 1240 Nm, and a lower control limit of 1160 Nm, Subgroup 5 data shows that sample data is out of control limits.
The sample data from subgroup 5 shows that process improvement is required to maintain the process statistically.
Material Supply
Material Quality
No Torque Value Display
No 100% Checking of Torque Value Tightening Method
Manpower Skill
Lack of Training
Fatigue
LOW OEE MACHINE
METHOD
MATERIAL MEASURE
MAN
Not Well Maintained
Wrong Usage
Operation Frequency Wrong Sequence
483
Fig. 7. Control chart 𝑋´
Process Capability Index (CpK) Analysis
The data used for process capability is the result of tightening the inner bearing bolts in subgroup 1 – subgroup 5 are shown in Table 5 below.
Tabel 5 - Capability Index
Index Subgroup 1 Subgroup 2 Subgroup 3 Subgroup 4 Subgroup 5 Average
Cp 0.83 0.66 0.73 0.74 0.57 0.71
CpK 0.82 0.64 0.63 0.71 0.57 0.67
Table 5 can be seen that in Subgroup 1-5 the average Cp value is 0.71 which is less than 1 so it can be said that the data is less homogeneous.
Failure Mode and Effect Analysis
Based on the data that has been obtained during the observation and has been analyzed, then it is necessary to find out which types of defects have the greatest risk to the production process and have the greatest impact on product quality. The cause of the problem with the greatest risk will later be made a priority for improvement by the company. One of the tools used to determine the causes of defects that have the greatest risk is FMEA (Failure Mode & Effect Analysis). FMEA is very useful for determining priority repairs for various causes of defects or failures in a product or process by calculating the RPN (Risk Priority Number) value. RPN is calculated by weighting with 3 aspects, namely Severity, Occurrence and Detection, so that the RPN (Risk Priority Number) value for each cause will be obtained. All stages of the inner bearing installation process are described in the FMEA check sheet with a total of 11 stages. Each stage describes all the potential damage that can arise during that stage and its impact. Each of these impacts has a severity, occurrence and detection value.
Table 6 - RPN Value for Each Stage of The Slew Bearing Bolt Tightening Process
Process Step RPN Cum. Cum%
Perform bolt tightening 616 616 49%
Turn on the vector pump and calibrate 336 952 76%
process of cleaning the surface of the carbody 72 1024 81%
Torque tightening equipment preparation 60 1084 86%
lubricate bolts with oil 48 1132 90%
Checking Material from Storage 32 1164 92%
C Subgroup 1 C Subgroup 2
C Subgroup 3 C Subgroup 4
C Subgroup 5
484
Marking bolts after completion of fastening each bolt 28 1192 95%
Insert the bolt on the inner bearing 24 1216 97%
Check the completeness of the bolt material 16 1232 98%
Install hose on pump and tightening tool 16 1248 99%
Insert pins on inner bearings 12 1260 100%
Fig. 8. Pareto RPN Graph for Stages of Tightening Slew Bearing Bolts
Table 7 - Detail FMEA Check Sheet No Process Failure
Mode Effect Severity Rootcause Occur
rence Countermeasure Detection RPN
1
Checking Material from Storage
Non- complia nt material
delayed
process 1 No
checking 4
Use of
checksheets after material is supplied to the production line
2 8
there are material defects
Need to rework, longer time, delayed process
3
no inbound check quality
4
Quality checking in the inbound logistics area
2 24
2
Check the completen ess of the bolt material
the number of bolts does not match
delayed
process 1 No
checking 4
Use of
checksheets after material is supplied to the production line
2 8
There are defectiv e bolt conditio ns such as misread
delayed process 1
no inbound check quality
4 2 8
3 The process of cleaning the surface of the Carbody
&; slew ring then Apply sealant
Surfaces are not cleaned properly
There is contaminati on that can damage the thread
6
operator did not follow the procedure
4
Double check after lubrication process
2 48
Wrong use of sealant occurs
There is rust so that the components become brittle
6
operator did not follow the procedure
2 Use of Visual
Control 2 24
485
4
lubricate bolts with oil
Bolts are not lubricate d properly
tightening is not smooth;
torque is not appropriate and reduces clamp force
6
operator did not follow the procedure
4
Double check after lubrication process
2 48
5
Insert the bolt on the inner bearing, thread it by hand
mis thread bolt position
The tightening process is not suitable, the bolt may break
6
operator did not follow the procedure
2
Sampling for checking hand tighten
2 24
6
Insert pins on inner bearings
Incorrec t pin position installati on
Slew bearings cannot enter, delayed the process
3
operator did not follow the procedure
4 Added Visual
Check 1 12
7
Torque tightening equipment preparatio n: vector pump, hose, tightening tool and reaction bar
Tooling selectio n errors
delayed process 1
operator did not follow the procedure
4
Added visual check for tooling used
1 4
Not paying attention to tooling conditio ns properly
Damage occurs during the process, delayed process
7
operator did not follow the procedure
4 2 56
8
Install hose on pump and tightening tool
Hose installati on is not tight
Torque calibration fails, delayed process
2
operator did not follow the procedure
4 Use of Visual
Control 2 16
9
Turn on the vector pump and calibrate
Torque value input error
low Torque, Reduced Clamping Force and Can Reduce Component Lifetime
7
operator did not follow the procedure
4
The use of system
monitored tools, where the torque setting program
has been
prepared without the need to adjust torque by the assembler
6 168
Torque exceeds standard, bolts or components may be damaged
7 4 6 168
10
Perform bolt tightening in cross order
low torque
Reduced clasp force, reducing component lifetime
7 Misuse of
tools 4
The use of a system of monitored tools, where the torque setting of the tool has been programmed and the addition of a control sequence with barcoding or
using an
encoder, the addition of an arm manipulator structure, to produce a more consistent
6 168
over torque
Bolts or components may be damaged
7 Misuse of
tools 4 6 168
wrong sequenc e
The clasp force is poorly distributed, reducing the lifetime of components
7
operator did not follow the procedure
4 10 280
486
tightening process
11
Marking bolts after completio
n of
fastening each bolt
no marking
customer feedback, reducing customer trust
7
operator did not follow the procedure
2
The use of monitored tools,
with the
recording of data no longer requires manual marking
2 28
Improvement Plan
Design of the manipulator arm on the tightening tool
Utilizing the manipulator arm structure on the tightening tools is one of the improvements that can be made to increase the consistency of the bolt-tightening process. In the current process, the tightening tools are manually operated, moved, and held by the operator, which has the potential to result in inconsistencies in the reaction force required to withstand a torque of 1200 Nm. With the manipulator arm equipped with pneumatics, the operator needs less energy to move and hold the tools during the tightening process. In addition to improving process quality, a manipulator improves the operator's safety and ergonomics. This manipulator arm design has 3 degrees of freedom with dimensions tailored to the dimensions of the car body for multiple 2- station models. Figure 9 shows component details on the manipulator arm made from the material SUS304.
Fig. 9. Manipulator Arm Design
Structural strength analysis
A strength analysis of the manipulator's arm is performed to ensure that the design can meet the specified requirements (criteria). This calculation activity will concentrate on finite element modeling, analysis of stress and stiffness of structures, and a comprehensive analysis of strength and deflection aspects. Modeling and analysis of geometry utilizing the finite element method and ANSYS software. With the criteria of high strength and stiffness without permanent deformation under load. The manipulator's arm is made of SUS304 as its main material.
487
Fig. 10. Element model on ANSYS.
The load-induced stress value must not exceed the maximum allowable stress of the material. Where the allowable stress value is derived from the yield stress value of the material or is equal to 240 MPa.
Table 8 shows the results of the loading simulation. From the calculation of the construction strength using finite element analysis, it shows that the manipulator arm structure can support a vertical load of 500 kg from the object's mass and is declared safe, as the safety number is greater than one (SF> 1) and there is no critical point.
Table 8 - Loading simulation results Deflect Safety
Factor
Von Mises Stress Max
Material
Part Allowable stress
(Mpa)
Yield
(Mpa) Material
1,43 9,35 25,68 180 240 SUS 340 Base Reaction Arm
9,56 6,65 36,1 180 240 SUS 340 Stand Top Pipe
20,58 1,25 192,38 180 240 SUS 340 Upper Arm
22,12 0,66 363,11 180 240 SUS 340 Swing Arm
57,27 1,59 151,33 180 240 SUS 340 Arm 2
58,13 1,21 198,39 180 240 SUS 340 Arm 3
58,8 0,74 325,08 180 240 SUS 340 Up Down Hinge
63,58 4,43 54,22 180 240 SUS 340 Stand Tolls
8,56 0,67 357,61 180 240 SUS 340 Bushing Upper Arm
Fig. 11. Visualization of The Overall Deflection of The Manipulator Arm Structure
Torque wrench terminator using manufacturing execution system
In process evaluation using FMEA, one process step that needs to be improved in the inner bearing bolt tightening process is the system's ability to detect whether the torque applied to the bolt meets quality standards. There is no such system in the current process. When there is still a
488
gap for the bolt-tightening process to pass through that does not meet quality, the torque value is checked at random.
Solving this issue requires an interlock mechanism where a system can detect whether the results of tightening the bolts are by quality standards. When a process deviates from the standard, the system can issue a warning and prevent the operator from proceeding with the following process: interlocking. After the interlock mechanism is added, Figure 12 shows the flow diagram.
A manufacturing execution system is one of the technologies that can be utilized to implement the interlock system (MES). MES is a computerized system used in the manufacturing industry to track and document the transformation of raw materials into finished goods. The MES functions as a real-time monitoring system that enables control of various production process elements (e.g.
inputs, personnel, machines and support services).
Fig. 12. Tightening Sequence After Integrated with Interlock System
It is necessary to use a control module on a torsion device that can transmit torque value data that MES can then process to implement the interlock system using MES. Therefore, the control module used must support an open protocol. The open protocol enables torque wrenches and other tools to interoperate without requiring a proprietary interface or gateway. The main benefit of using an open protocol is the ease with which features can be expanded to meet operational production requirements, in this case, the use of torque value data in interlock system applications. Figure 13 shows a schematic of MES-integrable torque equipment.
Fig. 13. The Main Frame of Monitored Torque System Using MES
Use of encoder to control sequence tightening
In the process evaluation using the previous FMEA, one of the process steps that need to be improved in the bolt tightening process on the inner bearing is how the bolt tightening sequence can be ensured according to the standard because no system can ensure that the process carried
Finish, proceed to the next bolt Tightening Process
Start
Input Torque Setting
Is torque value
meet the standard? No
Repeat tightening process, loosen the
bolt Yes
I N T E R L O C K I N G S T E P
489
out has followed the procedure. There is no system capable of detecting when an operator makes a sequence error.
One system that can overcome this problem is to use an encoder in the design of the manipulator arm on each arm axis. In the manipulator arm design that has been designed, it has 3 degrees of freedom, so 3 encoders are needed to provide coordinate input signals to the system.
Each encoder will later send information in the form of coordinates so that the system can determine whether the position of the tooling used is in the correct sequence. Rotary encoders provide a position feedback signal from a rotating shaft or object. They are available with analog (0-5V, 0-10V or 4-20mA) or digital outputs. Available resolutions range from 2.8° to 0.006°, thus providing accurate torque tool positioning. Figure 14 shows the position of the encoder and the shaft that is controlled on the manipulator arm.
The reference point is at the first process or at the first bolt which we consider to be position [0,0,0] or coordinates [encoder 1, encoder 2, encoder 3], then in a crossed sequence it is continued at the position of the bolt opposite it.
Fig. 14. Location of The Encoder On The Manipulator Arm
Fig. 15. Illustration of The Position of The Manipulator Arm and Encoder Relative To The Car Body
This information will be used to command the system to ensure that each sequence adheres to a predetermined standard. This system is commonly referred to as interlocking. If an error in coordinates is detected during the fastening process, the system cannot continue the bolt-
490
tightening process, or the torque tool cannot be operated. Figure 16 below illustrates the sequence and flow of the bolt-tightening process for clarity.
Fig. 16. Process Flow Sequence and Bolt Tightening
Logic Tree Analysis (LTA) Hydraulic Torque Wrench Machine
As a basis for determining how to handle failure modes that occur, LTA is a qualitative method that aims to classify failure modes into multiple categories. In general, the LTA process uses three structured questions (evident, safety, and category) to obtain categories of failure modes that occur, such as category A (failure modes affect safety), B (failure modes affect production), C (failure modes affect non-production), and D (failure modes affect non- production).
The new maintenance action is determined by the equipment's deterioration and conformity with the task selection based on the previously determined RPN value. Following a decision diagram to conduct a logic tree analysis is one of the methods for determining appropriate maintenance actions for failures.
The OEE loss analysis determined that equipment failure accounted for one of the largest losses. LTA can be used to reduce the occurrence of equipment failures, determine the proper action to be taken by the operator in the event of a failure, and assess the impact if the failure is likely to occur.
In Table 6, Evident is indicated as "YES" when the assembler or operator is aware of a system disturbance. The Safety column is marked with "YES" if the damage poses a safety risk and "NO" otherwise. The Outage column is marked with "YES" if this damage stops the engine and "NO" otherwise. The Category column has four entries: A (failure mode impacting safety), B (failure mode impacting production), C (failure mode impacting non-production), and D (hidden failure mode).
The process carried out at the Logic Tree Analysis stage with the RCM approach is to provide component categories based on the existing damage modes. The categories obtained with RCM are categories A and C with a percentage of 0% while B and D with a percentage of 75%
and 25%.
Finish, proceed to the next bolt
Resetting the tool position Start
Input Tool Coordinate
Is coordinate is
correct? No
Yes
Proceed to tightening Process
Tool is locked, Cannot process to next step
491
Table 9 - Logic Tree Analysis Using Torque Wrench Hydraulic Machines
Failure type Failure Impact Potential Causes Critical Analysis Category
E S O
Calibration failure The tool cannot operate
Incorrect hose pump connection
Yes No Yes B
There is a problem with the pump cylinder resulting in less pressure Lack of oil
Failure of tools to achieve target torque
The results of the bolt tightening process are not in accordance with specifications
Incorrect hose pump connection
Yes No No B
There is a problem with the pump cylinder resulting in less pressure
Damage to bolt threads or threads
Lack of oil The pump doesn't
work
Damage to electronic components
Burnt motor
Yes No Yes D
The condition of the brush is not good
Torque tools locked on bolts (jamming)
Shaft components on the tool can be damaged
The tool operates backward / in the
wrong direction Yes No No B
The tool is wedged under a fixed object Pump pressure is
low
The linkage between the piston and drive plate is broken
Damage to the pump
seal Yes No Yes D
Lack of oil B
Valve damage Yes No Yes D
Leaking cylinders or tools
The O-ring on the
cylinder is damaged Overheating occurs
Yes No Yes B
Cylinder seal broken Oil that has never been changed
Overheat pump Damage to pump components
Continuous use without pause
Yes No Yes B
Oil that has never been changed
Task Selection
Action selection is used to determine effective maintenance policies applied to minimize the likelihood of failure and cost-effective actions in terms of maintenance expenses. Failure mode that is directly related to Time Directed (TD), Condition Directed (CD), or Failure finding (FF) dictates the maintenance policy chosen.
Recommendations for actions produced with the Reliability Centered Maintenance (RCM) approach can be obtained based on the results of the selection of actions for failed components;
namely, a percentage value of 12.5% is obtained in 1 component with Time Directed actions, a percentage value of 12.5% is obtained in 1 component with condition directed action, and a percentage value of 75% in 6 components with failure finding.
Table 10 - Torque Wrench Hydraulic Component Maintenance Policy
Component Failure Mode Policy Task (RCM) Information of Effectiveness
Lubricant Filters Damaged Time Directed
Periodic maintenance and on- condition maintenance are forms of preventative maintenance that aim to replace a component or system at predetermined time intervals.
Lubricant Dirty, Diminish Condition Directed
Preventive maintenance is performed based on specific conditions of a component or
492
system, with the goal of preventing damage. Due to the unpredictability of time variable
Hydraulic Hoses Broken or torn
Failure finding
Failure mode prevention by periodically checking a hidden function of the equipment
Quick Connector Dirty, Damaged Cylinder Seals Damaged Gauge Hydraulics Filled with liquid,
accuracy failure
Brushes Wear out
Couplings Broken
Discussion
The research showed that quality ratio of 5 subgroup samples of tightening bolt was 93,30%
- 100%. Numerous variables, including the lubrication coat kinds, thread tolerance faults, and coefficient of friction, influence the ratio (Miao et al., 2020).
The average value of OEE obtained is 18.5%, which is still below the eligibility standard.
Based on the described data for loading time and operation time, the biggest losses are caused by the inefficient use of available processing time, which results in 40% of idle losses and 40% of stoppages. The subsequent largest loss is 9.91% due to equipment failure. This is similar to research conducted by Rusman et al., (2019) to analyze OEE in a wood processing company, the main factors causing the low OEE value on the machine were the reduce speed factor, as well as the idle and minor stoppages.
By examining the average torque value in Table 4, it can be determined that the bolt- tightening results fall within the company's specifications. However, when the minimum and maximum values are considered, several processes fall outside the standard torque range of 1160 Nm to 1220 Nm. This indicates that there are still products that still need to meet quality standards.
The average Cpk value is 0.67 which also is less than 1.0, so the level of accuracy is low or the data does not meet the target. It can be concluded that the torque value on the inner bearing is not homogeneous and less accurate with respect to the specification value so that the process is not capable.
From the results of the RPN values and using the Pareto principle, there are 3 processes that are priorities for improvement, namely at stages 3, 9 and 10. In stage 3 of the car body and sealant cleaning process, here there is a potential for error if the cleaning process is not perfect and there is contamination on the threads, this can result in damage during the bolt tightening process. Another risk of damage, if the sealant is used incorrectly, is the potential for rust to arise which can affect the life of the components. In stage 9 of the calibration process and input of torque values. Here there is a potential for error when inputting the torque value setting and as a result the bolt tightening results may be out of quality standards. When the torque value goes outside the design standard limits, it will result in component damage, component life will be reduced, and machine performance, especially in the slew bearing section, can be disrupted, this will have an impact on customer confidence in the product produced. Apart from that, errors in inputting torque values are also difficult to detect. In stage 10, the torque tightening process must follow the cross sequence as described in sub-chapter 4.1. If this sequence is not followed, the clamp force will not be distributed evenly on the surface of the slew bearing and car body. As a result, the connection between the slew bearing structure and the car body is not optimal and this has an impact on component life and engine performance. This sequence error cannot be detected, because there is no system that is able to detect this tightening sequence. Stages 9 and 10 are the main priority for improvements to the inner bearing tightening process, because this process has the highest risk of damage and is difficult to detect when an error occurs in the process.
There are some improvements that can be made to increase the consistency of the bolt- tightening process such as: (1) utilizing the manipulator arm structure on the tightening tools to improves the operator's safety and ergonomics, (2) make a strength analysis of the manipulator's arm, (3) using Manufacturing Execution System (MES) to detect whether the torque applied to the bolt meets quality standard, (4) using an encoder in the design of the manipulator arm on each arm axis can be ensured the standard, (5) using Logic Tree Analysis (LTA) to reduce the