This publication is a special assignment from the Ministry of Energy and Mineral Resources to the General Secretariat of the National Energy Council. The authors of this publication are employees of the General Secretariat of the National Energy Council and foreign experts who specifically assist in the preparation of this publication, including an expert from the Government of Denmark.
PICTURE
LIST OF TABLE
EXECUTIVE SUMMARY
INTRODUCTION
This book presents the national energy situation in 2016 to 2050, which includes the projection of supply and demand of primary energy and final energy based on Business as Usual (BaU), Alternative 1 (ALT 1) and Alternative 2 (ALT 2) scenario that should are being developed with Long range Energy Alternative Planning System (LEAP) and Balmorel System modelling. The average assumption averages 5.6% p.a. or approaches Bank Indonesia's 2015 projection and high GDP assumption based on national energy policy of 7.1% p.a.
METHODOLOGY
- Framework Analysis
Framework Analysis of Indonesia Energy Outlook 2016
Synergy between LEAP and Balmorel
- Energy Projection Scenario
- Modeling Assumption
- Population Growth
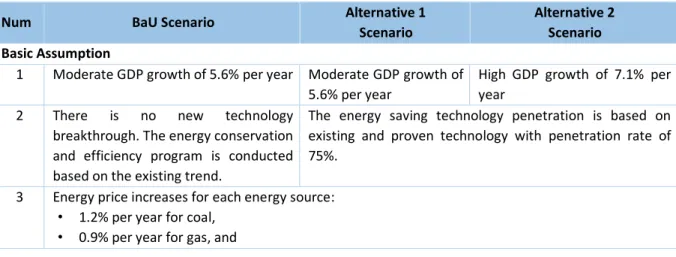
The first scenario or BaU uses basic assumption of moderate GDP growth of around 5.6% per year in the period from 2016 to 2050. The third scenario or Alternative 2 (ALT 2) uses high GDP growth assumption of 7.1% per year year average based on National Energy Policy in the projection period from 2016 to 2050 as well as optimal NRE technology and energy saving technology implementation assumption.
Population Growth and Urbanization Rate Assumption
- Economic Growth
For the following years until 2050, the growth rate is assumed to be constant at 0.62% per year. In relation to the current economic situation, moderate GDP growth is assumed to average 5.6% per year over the projection period.
High and Low GDP Growth Assumption
- Technology
- Energy Price
The developed and applied energy technology in demand and supply side will influence the investment decision, different supply costs for each energy source, as well as future energy demand rate and composition. Energy price paid by consumer will influence the choice of technology and appliances to meet the energy demand.
Energy Price Assumption
Scenario
7 Biofuel content as the mixture of biodiesel and biogasoline RON 88 until 2050 follows the biofuel development plan and roadmap as set by the government, such as 30% biodiesel and 20%. There is a movement in mode of transport up to 15% of total vehicle production in 2050 from passenger car and motorcycle to bus and train and from truck to train 18 The oil refinery capacity in 2025 is aligned with the government roadmap (Pertamina) and it is assumed.
CURRENT CONDITION
- Energy Balance
Energy Balance 2015
Oil Resources 2015
Oil Production, Import and Export Development
- Oil Fuel Production and Import Year 2010 to 2015
Source: Ministry of Energy and Mineral Resources processed by the General Secretariat of the National Energy Council 2016 Note: Import Dependency Ratio = Import divided by domestic supply (Production+Import-Export). The current selling price of 3 kg of LPG is IDR 4,250 per kg and the government has allocated a subsidy of IDR 5,750 per kg.
Gas Resources 2015
Gas Production and Export Development
- Coal
Based on this Presidential Ordinance, if the gas price exceeds USD 6 per mmbtu, the Minister of Energy and Mineral Resources can set certain gas prices for fertilizer industry, petrochemical industry, oleochemical industry, steel industry, ceramic industry, glass industry and the glove industry. Note: Quality based on calorie class (Presidential Decree Number 13 Year 2000 amended by Presidential Decree Number 45 Year 2003).
Coal Resources and Reserve Value Change Year 2010-2015
Indonesia Coal Reserve 2015
Coal production realization in 2014 fell due to low price with a total production of 458 million tons. This shows that the coal produced is mostly exported and the domestic use is still low (Picture 3.8).
Coal Production and Export Development Realization 2010-2015
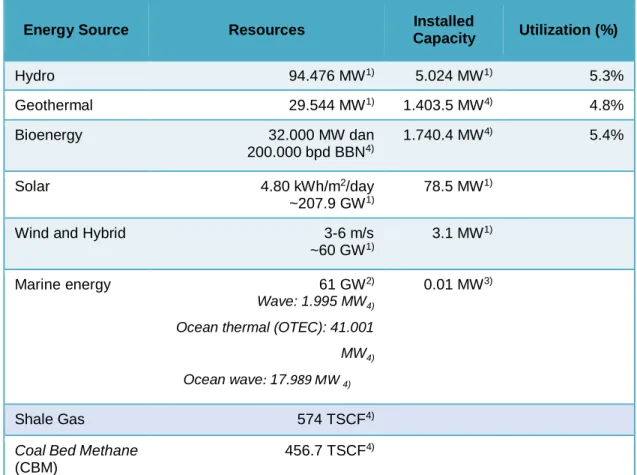
- New and Renewable Energy
Government regulation number 77 year 2014 on the third amendment of government regulation number 23 year 2010 on mineral and coal mining industry. One of the regulations in future NRE development is Government Ordinance Number 79 Year 2014 on National Energy Policy.
Large Scale Hydro Power Potential Map
Hydro potential for electricity generation from hydroelectric power plants and mini/micro hydroelectric power plants is widespread in Indonesia, estimated to be around 75,000 MW.
Wind Power Potential Map
Indonesia's solar energy resources can be grouped based on location in the western and eastern part of Indonesia respectively. The solar resources in the western part of Indonesia are 4.5 kWh/m2.day with a monthly variation of about 10%, while the solar resources in eastern Indonesia are 5.1 kWh/m2.day with a monthly variation of about 9%.
Solar Power Potential Location Map
Tidal Power Potential Location Map
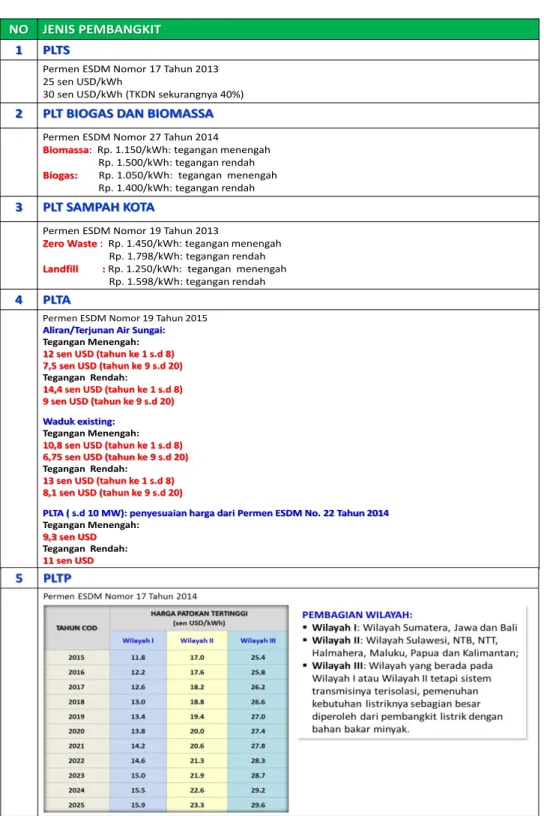
Feed in Tariff (FiT) is a mechanism for determining the purchase price of electricity from NRE electricity production by PT PlN, where the tariff is different for each energy source. Thus, the government issued ministerial decree no. 17/2014 on the purchase of electricity from geothermal power generation and geothermal steam for geothermal power generation by PT PLN to ensure security that the parties can negotiate after exploration and FS to reach an economic value.
ENERGY OUTLOOK
- Final Energy Demand
Final Energy Demand by Scenario
The demand for coal is closely related to the use of coal in industry, especially as a source of energy for furnaces in the cement industry and other industries. The high demand for electricity is due to the high electrification target of 100% in 2020 and lifestyle changes along with economic improvement and technology development.
Final Energy Demand by Source and Scenario
Final Energy Demand by Sector 4.1.1 Final Energy Demand in Non Energy Industry
Based on Presidential Regulation number 40/2016 on gas price determination, the gas price for a certain sector can be reduced if two requirements are met. They do not meet the economic value of the gas consuming industry and the gas price is higher than 6 USD per MMBTU.
Final Energy Demand Share by Industry From the energy intensive level per unit, industry can be classified into three
Final Energy Demand Share by Subsector and Scenario
Energy Conservation and Efficiency in Industry
- Final Energy Demand in Transportation
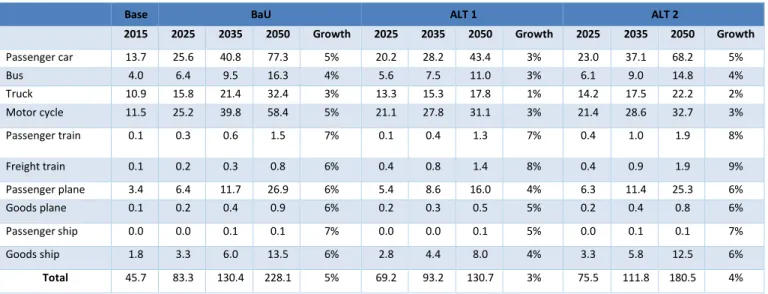
Without aggressive energy diversification and efficiency in BaU, final energy demand in transportation will grow by 5% per year or from 46 million TOE today to 228 million TOE in 2050. Final energy demand in ALT 1 is lower since GDP growth assumption in ALT 1 scenario is lower.
Final Energy Demand in Transportation by Source and Scenario
Due to the use of energy-saving vehicle and mode of transport shift, improvement of transport infrastructure and traffic management, the final energy demand of the two scenarios is lower than in BaU. Gas demand in transport will increase to 9 million TOE and 13 million TOE in 2050 for ALT 1 and ALT 2.
Final Energy Share in Transportation by Mode and Scenario
The activity of means of transport is differentiated into passenger and goods based on transport production or useful energy (energy used by passenger and goods). In detail, energy saving and efficiency are implemented in both ALT 1 and ALT 2, as shown in image 4.10.
Energy Conservation and Efficiency in Transportation
- Final Energy Demand in Household
Final Energy Demand in Household by Source and Scenario
TV and refrigerator in the household still use older technology, namely cathode ray tube (CRT) or liquid crystal display (LCD), while refrigerators without inverter consume a lot of energy. The use of energy-saving LED TVs and inverter refrigerators is predicted to increase, along with policies to support this technology.
Energy Conservation and Efficiency in Household
- Energy Conservation and Efficiency in Household
Substantial electricity supply and infrastructure has encouraged the commercial sector to convert its energy demand to electricity. The projection of the final demand for energy in the commercial sector by energy source is shown in figure 4.13.
Final Energy Demand in Commercial Sector by Energy Source and Scenario
HVAC technology in large offices uses the Variable Air Volume (VAV) system which saves more energy compared to the Constant Air Volume (CAV). In addition, there is variable refrigerant flow (VRF) technology for HVAC in commercial buildings.
In terms of lighting, in addition to energy-saving FL types T5 and T8, there are also CFLs and LEDs in residential buildings.
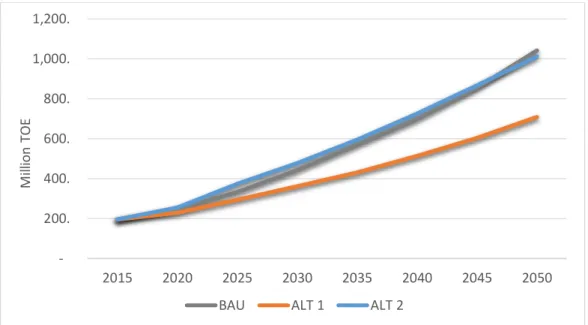
Primary Energy Demand by Scenario
Primary Energy Mix by Source and Scenario
- Energy Indicator Primary Energy Intensity
In ALT 1 and ALT 2, fossil energy such as oil, coal and gas is still the main option for meeting the national energy demand. Growth in primary energy demand over the past five years has been faster than Indonesia's GDP growth.
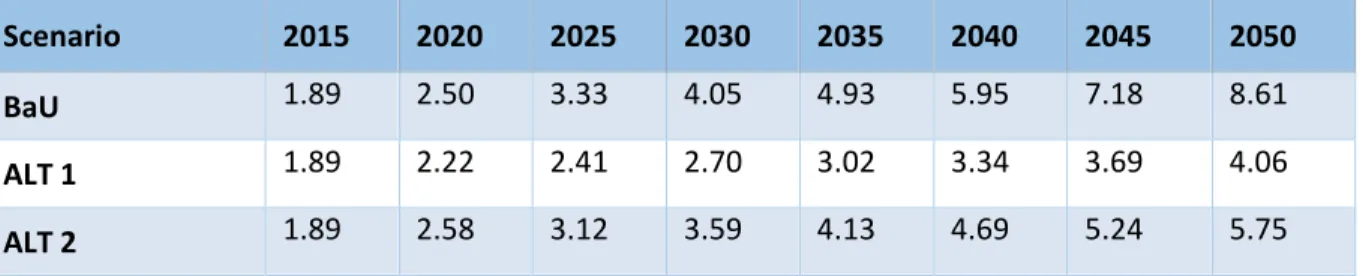
Primary Energy Intensity by Scenario
The increase comes as the target electrification ratio reaches 100% in 2020, high population growth, and moderate energy efficiency and energy conservation driving high primary energy demand.
Primary Energy Intensity Rate of Change by Scenario
Energy elasticity below one by 2025 is one of the goals of the national energy policy (Figure 4.19).
Energy Elasticity by Scenario
- Oil Outlook
- Sectoral Oil Demand
Oil distillation capacity has remained constant over the past decade, leading to increasing imports of refinery products, such as fuel oil. The use of oil in other sectors such as electricity, industry, trade and household is also influenced by economic and population growth.

Oil Demand by Sector and Scenario
- Oil Refinery
Petroleum fuel is used as energy while non-petroleum fuel is a raw material for industry especially the petrochemical industry. The new refineries will supply the demand for diesel fuel especially pertamax (RON 92 gasoline) with optimal cost of fuel distribution.
Oil Refinery Processing Capacity Assumption
Oil Refinery Balance
- Oil Primary Energy Supply
Oil Primary Energy Supply
- Oil Production
Oil Lifting
Oil Production Assumption
Oil Balance by BaU Scenario 4.5.5 Oil Refinery Infrastructure
Oil Refinery Balance 2015-2050
- Gas Outlook
- Sectoral Gas Demand
In electricity, gas is an interesting option that ensures high efficiency of electricity production, especially in the production of electricity with steam. Electricity also needs gas in larger quantities to meet the demand for gas-fired electricity generation during peak load and gas-steam electricity generation during moderate or base load.
Gas Demand by Sector and Scenario
- Gas Refinery
Gas is also used in oil, LPG and LNG refinery inputs which produce LPG and LNG. The LNG refinery's current capacity is 44.2 million tonnes per year from the three existing LNG refineries and the new Donggi Senoro LNG.
LNG Refinery Processing Capacity Assumption
The national utilization of gas in the form of LNG is not optimal due to the lack of infrastructure and utilization of existing facilities. Based on the government plan, LNG refinery capacity in this Outlook is projected to increase to 29 million TOE by 2050, including Masela and Tangguh Train 3 (Figure 4.30).
LNG Refinery Balance LPG Refinery
- Gas Primary Energy Supply
To ensure domestic energy supply in the future, gas will be prioritized to supply domestic demand instead of being exported. This means that gas infrastructure is a key to increasing domestic gas supply in the future.
Gas Primary Energy Supply
- Gas Production
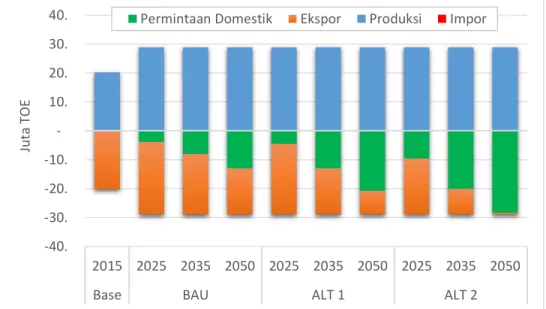
In the last several years, half of the gas production has been exported in the form of LNG and through pipelines. Although not significant, there is additional gas production in ALT 1 and ALT 2 from CBM (Coal Bed Methane) starting in 2020.
Gas Production Assumption by Alternative Scenario (ALT 1 dan ALT 2) Picture 4.34 shows simulation of gas demand, production, export and import projection in BaU,
Kutai, Jangkrik Muara Bakau, Matindok Donggi Senoro dan Abadi Masela diharapkan dapat menekan laju penurunan produksi gas di Indonesia.
Gas Balance
- Gas Refinery Infrastructure
LNG Refinery Capacity Demand Projection
To meet the growing demand, it requires additional LNG refinery capacity from the Donggi Senoro refinery and the South Sulawesi refinery of 6.3 million tonnes per annum (MTPA). As a result, increased demand causes increased LPG imports and additional LPG refinery capacity.
LPG Refinery Capacity Demand Projection
- Coal Outlook
- Sectoral Coal Demand
In alternative scenarios, the largest consumer of coal is the cement industry and the non-metallic industry which grows by 3% per year in 2015-2050. The next largest consumer is the fertilizer, chemical and rubber industry which is growing at 2.5% per year with a relatively constant share of 17%.
Coal Primary Energy Supply
- Coal Production
As explained in the previous chapter, the coal production assumption is divided into BaU and ALT.
Coal Production Assumption by Scenario
Coal Balance
- Electricity Outlook
- Power Demand
Power Demand by Scenario
Power Demand by Sector
- Power Supply Power Production
Power Production by Scenario and Energy Source
This is due to slower growth in energy production from gas-fired power generation compared to coal-fired power generation. Gas-fired power generation and NRE power generation contribute the same amount to total power generation in 2025.
Power Generation Total Capacity by Scenario and Energy Source In ALT 1, power demand is lower than in BaU due to energy conservation and other efforts to
- Power Capacity Addition
Half of it has been operating since 2015 while the rest is newly installed power generation capacity. About 61% of the total additional capacity comes from coal-fired power generation, while the share of gas-fired power generation is about 26%.
The details of additional electricity generation capacity up to 2019 by electricity generation for each scenario and RUPTL 2016-2025 can be seen in Figure 4.46.
Additional Power Generation Demand 2016-2019
- Electricity Price
Electricity costs in ALT 1 are higher than in BaU as ALT 1 is encouraged to meet the NRE use target in power generation. Although the electricity price is relatively lower in electricity generation with fossil fuels, the external costs will increase in the future, which will affect the rising electricity price.
Electricity Price 2015-2050
- Power Fuel Demand
The graphic shows that coal power generation (conventional and supercritical), biomass power generation and geothermal. Hydropower generation is not only flexible in production, but it can also produce quickly as long as there is sufficient water in the reservoir.
Power Production Week 22 Year 2025
Jam dalam Minggu ke-22 (2025)
Power Production Week 22 Year 2050
- New Renewable Energy Outlook .1 NRE Supply
With generation only at certain hours in a day, the solar power generation will contribute to meeting the midday peak load on the 22nd week. Pumped storage power generation should meet the same peak load demand as in 2025, but with a larger amount.
Jam dalam Minggu ke-22 (2050)
- NRE Supply
- NRE Demand by Sector and Scenario
- Biodiesel and Bioethanol Demand
- Bioethanol Demand Development by Scenario 0
- NRE Demand for Power Generation
- Power Generation capacity Supply from NRE 0%
- NRE Power Generation Additional Demand 2016-2050
- NRE Power Generation Additional Demand 2016-2025
The additional capacity in solar power generation and wind power generation compared to the total additional NRE power generation (113 GW) is 18% and 10%. Therefore, additional high capacity in solar and wind power generation in ALT 2 is possible in the next 35 years.
THE CITY OF BATAM ENERGY OUTLOOK
- Population Condition
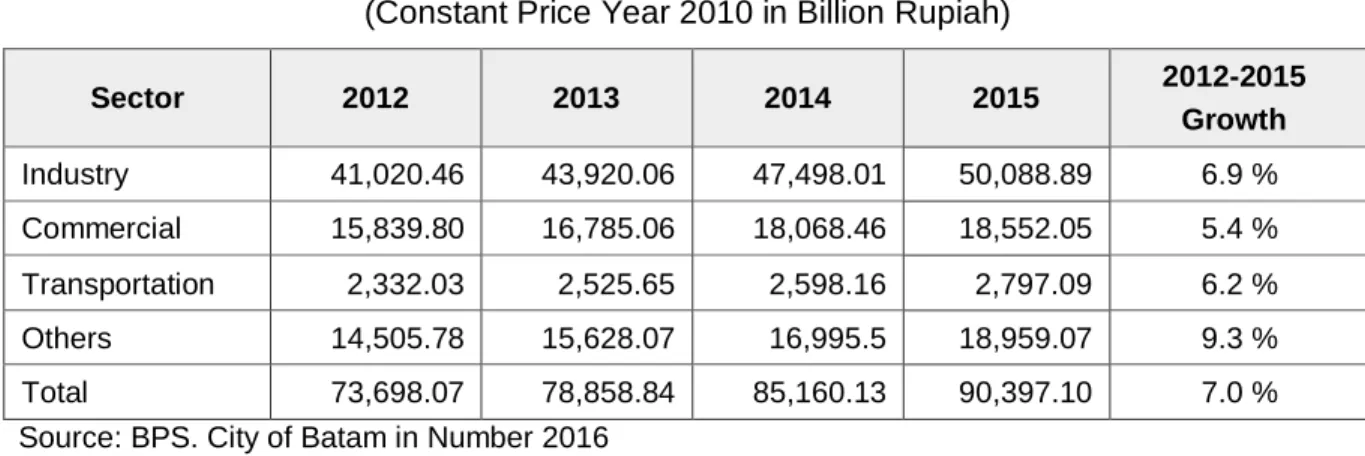
- Economic Condition
- Energy Sector Development
- Social Economy Projection 1 Population
- Population Projection in City of Batam 5.4.2 Gross Regional Domestic Product (GRDP)
- Proyeksi Kebutuhan Energi Final
- Final Energy Demand Projection in the City of Batam by Consumer
- Energy Demand Projection by Energy Source
- Final Energy Demand Projection in the City of Batam By Energy Source
- Electricity
- Power Demand Projection in the City of Batam
- Power Generation Capacity Projection in the City of Batam
- Capacity and Cost Addition
- Fuel Demand Projection for Power Generation in the City of Batam
- Capital Cost Projection for Power Generation Construction in the City of Batam
- Power Generation Cost in the City of Batam based on Cost Component
- Primary Energy Supply
- Primary Energy Mix in the city of Batam 26%
It is predicted that the role of NRE power generation in Batam city will not grow well. Fluctuations in electricity production costs in the city of Batam are shown in Figure 5.8.
BIBLIOGRAPHY
DEFINITION