THE ARCHITECTURE OF THE GENE REGULATORY NETWORK MODEL FOR MICROMERE LINEAGE SPECIFICATION
Thesis by
Roger Revilla-i-Domingo
In Partial Fulfillment of the Requirements for the Degree of
Doctor of Philosophy
California Institute of Technology Pasadena, California
2007
(Defended May 22, 2007)
© 2007
Roger Revilla-i-Domingo All Rights Reserved
To my father, my mother,
and my brothers, Dani, David and Ferran, who provided the foundation and support
that made this possible
ACKNOWLEDGEMENTS
First of all I want to thank my advisor, Eric Davidson. There are many reasons for which I am grateful to him. Some are especially important to me. I want to thank him first for opening the door of his lab to a “backpacker” with no knowledge of biology whatsoever.
Secondly, because at key points of this PhD he has believed in my ability to learn biology and to do experiments more than I have myself. Third, and most important to me, for having illuminated a path toward my deepest intellectual dream: that of understanding how life works. In my view he has opened a whole scientific life in front of me, both in a practical and in an intellectual sense. Finally, I want to thank him for his scientific intuition that has impressed me throughout the course of this PhD, and which I can best illustrate with an email I received from him on August 3, 2006, just a few months before discovering that hesC, a HES class factor, was the repressor of micromeres:
“Dear Roger
I still think the Id misadventure is not a total loss. Most likely it is interacting with an E2A type transcriptional activator, and so it will lead us to the activator if we can determine what its partner is. E2A proteins bind E-box target sites. But another class of bHLH factors binds a subset of these same sites and acts as a dominant repressor, the HES factors (sometimes in complex with E2A also). [...] R of mic could be a HES class factor, Id a level titrator of the E2A activator and the E2A and HES see the same site, sort of like the scratch drawings we were making last night. [...].
Eric”
I also want to especially thank Ellen Rothenberg. Her teaching, her interests, and our numerous discussions have been an invaluable source of inspiration. Through her I have discovered the fascinating scientific questions to which I hope to devote my academic future. I am extremely grateful to her for the enormous help and very precious guidance.
Special thanks also to Jaume Gabarro, a mentor long before I started this PhD, who first motivated me to explore the world of scientific research, and whose work and ideas have had a great impact on my views of science.
I want to thank my thesis committee for their assistance throughout this PhD. And the Davidson lab in general for creating an incredibly diverse and fertile environment in which to grow, technically and intellectually, as a scientist. Special thanks to Paola Oliveri. Her work set the ground for the project that has constituted this thesis; she taught me how to microinject sea urchin embryos; and she has collaborated with me in what has turned out to be a very enjoyable and fruitful part of my PhD. I am also especially grateful to Joel Smith, my companion in my intellectual explorations. I thank him for sharing with me his scientific thoughts and ideas, and for feeding me tons of interesting papers. To Jongmin Nam for extremely useful discussions and criticism of the fourth chapter of this thesis in particular, and for teaching me how to scare people in general. To Veronica Hinman for joining me in the “punishment room”; and for publishing a paper that inspired me enormously. To Samdar Ben-Tabou de-Leon, for being right in telling me that the previous version of the introduction to this thesis needed to be completely rewritten. To Sagar Damle for his unbeatable WMISH technical service, for accompanying me in the scuba diving course, and for letting me take out from his drawer more than I put in. To Stefan Materna for the runs and hikes. To Albert Erives for being my first teacher in the lab. To Andy Ransick for teaching me the most useful microscopy techniques, like how to role alive embryos on a slide. To Julie Hahn for enormous help with preparing mutation constructs. To Jane Rigg for those many little things, and some not so little ones, that many times allowed me to make it over the hurdles. I will
especially remember that she gave me the first bowls and cups I ever owned when I arrived in Pasadena with empty pockets. And to Deanna Thomas for her patience with my picky and always rushed ordering requests.
I also very especially want to thank those who have been closest to me in the lab, physically but also, I believe, at a personal level: the past and present members of 017K.
Jane Wyllie for understanding me from the very first day. Cesar Arenas-Mena for an attitude toward science that I admire. Takuya Minokawa for never getting upset (except once) to my asking way too many questions; for teaching me an enormous number of technical tricks; and most importantly for the daily discussions, through which I discovered vast and fascinating new horizons in biology. Qiang Tu for being a real “soul mate”; for being born the same day as me, May 26, 1975; for the bike trip to Mexico border, definitely my best adventure in California; and most of all, for his quiet, but always present readiness to help a friend. And finally, my most special thanks to the one person in the lab that has walked with me every step of this PhD: Pei Yun Lee. I thank her most of all for her unconditional and continued signs of friendship, which have more than once been the only good news of some tough weeks.
Many thanks to all my friends from Caltech. First and foremost, to Dr. Gilberto Hernandez for putting me back on track on many occasions, and because from him I have learned why the Spartans were seldom defeated. To Maria Eugenia Hernandez for sharing with me adventures, misadventures, stories and dreams. To Agustin Rodriguez for his views on humankind, which have influenced my own. To Javier for staying at my place every once in a while, and for talking to me about his projects. To Macarena for painting me once. To Gabi, Mihoko and Nonia for many nice lunches and brunches. To
my neighbors Juanse and Clari for providing free internet access. And also to Beto, Leila, Lavi, Theo, Roya, Julia, Jernej, Debrah and Paola.
Thanks to my friends from UCLA, whose parties have been the best: especially to Lan, but also to Paco, Nacho, Patricia, Laura, Marc, Marta, David, Israel, Nikos, Tom, and many others.
I also thank my friends from Manresa for not having forgotten me after all these years: el Xevi, el Xul.le, el Jorba, l’Elena Lloses, el Pol and la Celia, la Mariona, l’Emma, l’Elena Sixtu, el Marc, la Nadina, el Joan, el Dominguix, el Ferro, el Potra, la Celeste, la Nuria, l’Oriol, la Nuria, el Tom and many others. Also Albert Armenteres for being a great teacher.
Finally, I am very especially thankful to my family, for their strong moral support and encouragement. To my grandparents: avi Pasqual, iaia Maria, avi Albert and iaia Lola. To my uncles and cousins: Mariu, Merce, Aleix, Queralt, Gerard, Jaume, Montserrat, Pol, Dunia, Lis, Carme, Nil, Carla and Ricard. And to my sisters-in-law, Carla and Africa, for their precious friendship, and for making my brothers happy.
ABSTRACT
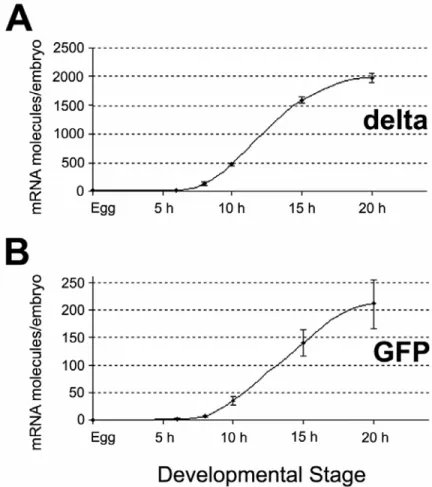
During the specification of the endomesoderm of the sea urchin embryo, mesodermal and endodermal cell types derive from common progenitors. The Delta signal, a ligand of the Notch receptor, serves as the spatial cue that triggers the segregation between these two fates. Expression of the delta gene exclusively in the micromere lineage early in development is essential for Delta to be able to correctly serve this role. According to a model of the gene regulatory network (GRN) underlying this process, the mechanism by which the micromere lineage is specified as a distinct domain, and by which the delta gene is expressed exclusively there, depends on a double repression system. A gene encoding a transcriptional repressor, pmar1, is activated specifically in the micromeres, where it represses transcription of a second repressor that is otherwise active globally.
Zygotic expression of delta and micromere specific control genes depends on ubiquitous activators, and localization in the micromere lineage depends on repression by the second repressor everywhere else. In this model the second repressor is an unidentified gene, the existence of which is implied by numerous experiments. The work presented in this thesis experimentally validates the double repression architecture for micromere lineage specification and localization of delta expression. To prove the existence of the double repression system a genomic screen was devised to identify the gene playing the role of the second repressor. hesC, a transcription factor of the HES family, was found to be this gene. It is expressed at the right time and place, and its function is to repress micromere specific regulatory genes. To show that expression of delta in the micromere lineage depends on ubiquitous activators and HesC-dependent repression, the relevant cis-
regulatory module (CRM) was recovered. This CRM, named R11, is shown to be able to drive the expression of a reporter gene exclusively in the micromere lineage at the right time. Dissection of R11 and its response to blockade of hesC expression show that R11 expression depends on ubiquitously present activators, and on HesC-dependent repression everywhere except the micromere lineage.
TABLE OF CONTENTS
Dedication iii
Acknowledgements iv
Abstract viii
Table of Contents x
Introduction 1
Chapter 1: Developmental Gene Network Analysis 9 Chapter 2: R11: A cis-Regulatory Node of the Sea Urchin Embryo
Gene Network that Controls Early Expression of SpDelta
in Micromeres 38
Chapter 3: A “Missing Link” in the Sea Urchin Embryo Gene Regulatory Network: hesC and the Double Negative Specification
of Micromeres 77
Chapter 4: Regulatory Functions in the delta R11 cis-Regulatory Element 97
Conclusions 115
Appendix 1: A Provisional Regulatory Gene Network for Specification
of Endomesoderm in the sea Urchin Embryo 120 Appendix 2: A Genomic Regulatory Network for Development 150 Appendix 3: Supplementary Material 161
INTRODUCTION
During the process of development an enormous amount of complexity arises from a single egg. Through specification, a large number of domains, each expressing a distinct set of genes, are established in a coordinated manner in time and space. This requires a sophisticated capability of processing information. The spatial information provided by asymmetries in the egg needs to be translated into the institution of distinct domains. At each succeeding stage, spatial and temporal cues from preceding stages need to be interpreted, and new cues need to be correctly positioned so that each domain can be further partitioned. A fundamental question, a small aspect of which will be addressed in this thesis, is how the genome controls this process.
The genomic loci of spatial and temporal information processing are the cis- regulatory modules (CRMs) that control when and where each gene is to be expressed (Davidson, 2006). The inputs are transcription factors localized in time and/or space in the embryo, which bind specific sequences within the CRM. Presence or absence of each input in the nuclei of each cell at each stage of development determines whether the gene is to be expressed or switched off. Maternally localized factors in the egg, and intercellular signaling molecules serve as spatial and temporal cues. These contribute to the control of gene expression by affecting the availability of specific transcription factors in specific nuclei. Because the expression of each transcription factor and signaling molecule is itself controlled by other transcription factors and signaling molecules, the mechanism by which the genome controls the specification process takes the form of a network of interactions among regulatory genes (Davidson, 2006).
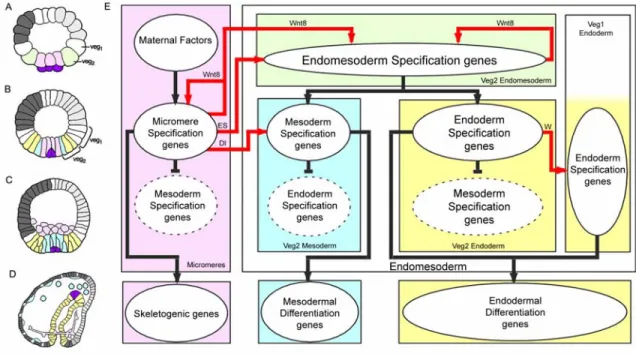
A model for the gene regulatory network (GRN) controlling one particular process of development, namely, the specification of the endomesoderm in the sea urchin embryo was published (see appendices 1 and 2 of this thesis). The experiments on which this model was based are reviewed in chapter 1 of this thesis (“Developmental Gene Network Analysis”). Figure 0.1 illustrates the process of endomesoderm specification in the sea urchin embryo. Ultimately the endomesoderm consists of the skeletogenic mesenchyme, a few other mesodermal structures, and the endodermal gut (Fig. 0.1D). By the seventh cleavage (Fig. 0.1A), the cell lineages of the sea urchin embryo have been segregated into a canonical set of territories, each of which is destined to give rise to distinct cell types and in each of which a specific set of genes is already running (reviewed by (Davidson, 2006)). The animal pole half of the embryo now consists of blastomeres that produce only cells types ultimately found in the oral, aboral, and apical neurogenic ectoderm. The lower half consists of the veg1 ring, their sister cells of the veg2 ring immediately below, and the large and small mircromeres at the vegetal pole.
The large micromeres will produce all the cells of the skeletogenic mesenchyme lineage, and the progeny of the veg1 and veg2 will produce the rest of the endomesoderm. At the swimming-blastula stage (Fig. 0.1B), the veg2 lineage has been segregated into two distinct domains: the inner veg2 ring consists of cells that will give rise to mesodermal cell types; and the rest of the veg2 domain will give rise to endodermal cells (Ruffins and Ettensohn, 1996; Ruffins and Ettensohn, 1993). At the mesenchyme blastula stage (Fig.
0.1C), the skeletogenic mesenchyme cells have ingressed into the blastocoel as primary mesenchyme cells (PMCs). After this, the veg1 progeny will become specified as endoderm (Logan and McClay, 1997), and gastrulation and skeletogenesis will follow.
Fig. 0.1: Endomesoderm specification in the sea urchin embryo. (A-D) Schematic diagrams of sea urchin embryos displaying specified domains. The color coding shows the disposition of specified endomesoderm components: lavender indicates skeletogenic lineage; dark purple indicates small micromere precursors of adult mesoderm; green indicates endomesoderm lineage that later gives rise to endoderm, yellow, and mesoderm, blue; light grey indicates oral ectoderm;
dark grey indicates aboral ectoderm; white indicates regions yet to be specified at the stages shown. (A) 7th cleavage embryo (about 10 h after fertilization). (B) Blastula stage embryo at about 9th cleavage (about 15 h after fertilization). (C) Mesenchyme blastula stage embryo (about 24 h after fertilization). (D) Late gastrula stage embryo (about 55 h after fertilization). The drawing shows the later disposition of all the endomesodermal cell types about midway through embryonic morphogenesis. (E) Process diagram describing endomesoderm specification events in the sea urchin embryo. Boxes represent domains of specification according to the color coding of their background. Ovals represent sets of genes that execute a particular developmental function.
Arrows indicate that the set of genes in the oval where the arrow originates, triggers the developmental function executed by the genes in the oval where the arrow ends. In particular, red arrows represent signaling events. Barred lines indicate repression of the developmental function executed by the genes in the oval where the barred line ends. Developmental time in the process diagram runs from top to bottom in accordance with the stages represented by the schematic diagrams A-D. Abbreviations: ES, Early Signal; Dl, Delta; W, Wnt8.
Fig. 0.1E show a diagram that describes the specification events and the genetic functions that underlie the process just described. Two of these events are important for what follows. The first one relates to the specification of the skeletogenic mesenchyme lineage. These cells are autonomously specified (reviewed by Davidson, 2006). The spatial cue that triggers their specification consists of maternal factors that are localized at the vegetal pole of the egg. The second event is the segregation between the non- skeletogenic mesodermal cell types and the endodermal cell types from common progenitors. The spatial cue that triggers this event is a signaling molecule, Delta (Dl in Fig. 0.1E). The gene encoding this signal is exclusively expressed in the micromere lineage from late cleavage and during blastula stage. Localization of delta expression in these cells at this time is essential. Between 7th and 9th cleavage, the Delta signal activates a Notch receptor in adjacent endomesodermal (veg2) cells, and this is required for normal specification of mesodermal fate (McClay et al., 2000; Sweet et al., 1999; Sweet et al., 2002). Thus, the cells of the veg2 territory immediately adjacent to the micromere descendants are specified as mesoderm, while the rest of the cells of the veg2 territory will become endoderm.
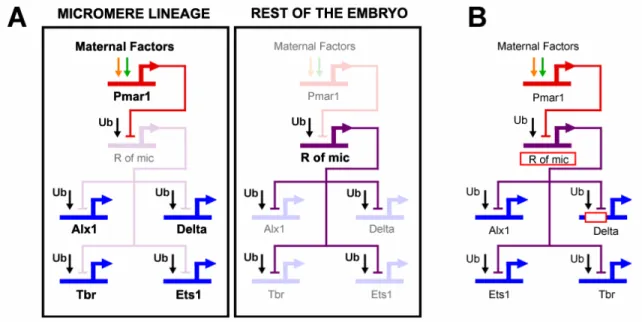
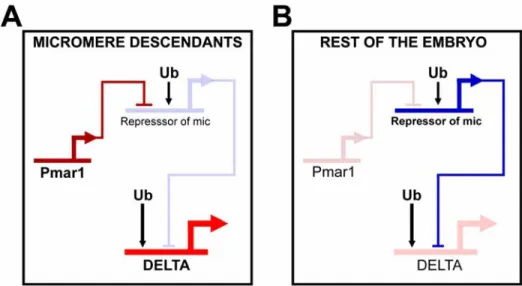
The genomic apparatus that uses the spatial information in the egg to correctly position the expression of the Delta signal is the focus of this thesis. According to the endomesoderm GRN model, the mechanism by which the micromere lineage is specified as a distinct domain, and by which the delta gene is expressed exclusively there, depends on a double negative gate (Fig. 0.2A; Oliveri et al. 2002; with updates from (Ettensohn et al., 2003). Immediately after the micromeres are born, they express a gene, pmar1, in response to the maternal factors localized in the vegetal pole of the egg. This gene
encodes a transcriptional repressor. A second repressor, named repressor of micromeres, or r of mic, is proposed to be zygotically expressed everywhere in the embryo, except in the micromere lineage, where it is repressed by Pmar1. R of mic in turn represses the zygotic expression of delta and of at least three regulatory genes (alx1, ets, and tbr) which are responsible for the activation of the rest of the micromere skeletogenic program. The zygotic expression of delta, alx1, ets, and tbr depends on ubiquitously present activators, and its localization in the micromere lineage depends on repression by R of mic everywhere else in the embryo (Fig. 0.2A).
Fig. 0.2: The double negative gate for micromere lineage specification and localization of delta expression. (A) GRN model. Within the micromere lineage a distinct specification program is activated. In the rest of the embryo, the same program is actively repressed by R of mic. Genes that are active in the respective domain are shown in strong color. Genes that are inactive are shown in light color. (B) The red rectangles represent predictions of the GRN model.
The double negative gate of Fig. 0.2A is an explicit representation of how the genome processes spatial information and thereby controls the specification of the
micromere lineage and the expression of delta. It is a subcircuit of the GRN, i.e., a set of linkages with a particular developmental job (Davidson, 2006). Its architecture is revealing. The use of two repressors in regulatory tandem, and ubiquitous activators, is not the only way to produce a localized expression pattern. The alternative is of course localized expression of activators. But these two GRN architectures are not functionally equivalent. The double negative gate provides de facto, the active repression of regulatory states outside the correct domain of their expression. Thus, it acts as an
“exclusion effect” (Oliveri and Davidson, 2007), actively ensuring silence of target genes in ectopic locations while at the same time ensuring their expression in correct locations.
A remarkable aspect of the subcircuit of Fig. 0.2A is that key components of it are predictions of the GRN model. Fig. 0.2B indicates two such predictions. One is critical to the specification of the micromere lineage in general: the existence of R of mic. The other one is critical specifically to the localization of delta expression in this lineage: that expression of delta in the micromere lineage depends on ubiquitous activators and on repression by R of mic. Both predictions are implied by numerous experimental observations (Oliveri et al., 2002). First, Pmar1 is expressed in the micromere lineage before zygotic expression of delta, tbr, ets and alx1 starts in the same domain. Second, if expression of Pmar1 is forced to occur globally, then delta, tbr, ets, alx1 (and downstream genes) are transcribed in all cells of the embryo, and all cells thereby adopt skeletogenic micromere fate. Third, exactly the same outcome follows if an mRNA encoding a dominantly repressive Engrailed fusion of the Pmar1 protein is globally expressed. Fourth, interfering with the expression of ets, tbr or alx1 has no effect on the expression of delta or of each other at the relevant developmental stage. It follows that
the pmar1 gene product naturally acts as a repressor; that delta, tbr, ets and alx1 are controlled by ubiquitous activators; and that localization of expression of these genes to the micromere lineage in normal embryos depends on their repression by R of mic everywhere else in the embryo. In particular, the possibility that any of these three genes is upstream of delta, or of each other, is ruled out.
To prove that the double negative gate for micromere lineage specification exists, and that it is responsible for the localization of expression of delta in the micromere lineage, it is necessary to experimentally validate the predictions of Fig. 0.2B. This means: a) to find the gene playing the role of r of mic; and b) to recover the relevant delta CRM and to demonstrate that it executes the predicted regulatory functions, i.e., ubiquitous activation and R of mic-dependent repression.
In this thesis I set out to validate the predictions of Fig. 0.2B. The first step was to recover the CRM that drives the expression of delta in the micromere lineage at the right time. I then could verify that the recovered CRM responds to the Pmar1 repression system as is predicted by the model. This work is described in chapter 2. It confirms that the localization of delta expression in the micromere lineage is transcriptionally controlled.
The second step was to find r of mic among all transcription factors in the sea urchin genome. I then could confirm that its properties and its function in the specification of the micromere lineage are as predicted by the GRN model. This work is presented in chapter 3.
The third step was to confirm that the CRM recovered in chapter 2 executes the predicted regulatory functions: activation by ubiquitously present factors, and R of mic- dependent repression. This is described in chapter 4.
The work described in chapter 4 strongly supports, but does not demonstrate, that the interaction between HesC and the recovered CRM is direct, as predicted by the GRN model. A demonstration that this is the case is the subject of ongoing work.
REFERENCES
Davidson, E. (2006). "The Regulatory Genome: Gene Regulatory Networks In Development and Evolution." Academic Press,
Ettensohn, C. A., Illies, M. R., Oliveri, P., and De Jong, D. L. (2003). Alx1, a member of the Cart1/Alx3/Alx4 subfamily of Paired-class homeodomain proteins, is an essential component of the gene network controlling skeletogenic fate specification in the sea urchin embryo. Development 130, 2917-2928.
Logan, C., and McClay, D. (1997). The allocation of early blastomeres to the ectoderm and endoderm is variable in the sea urchin embryo. Development 124, 2213-2223.
McClay, D., Peterson, R., Range, R., Winter-Vann, A., and Ferkowicz, M. (2000). A micromere induction signal is activated by beta-catenin and acts through notch to initiate specification of secondary mesenchyme cells in the sea urchin embryo.
Development 127, 5113-5122.
Oliveri, P., Carrick, D. M., and Davidson, E. H. (2002). A Regulatory Gene Network That Directs Micromere Specification in the Sea Urchin Embryo. Developmental Biology 246, 209-228.
Oliveri, P., and Davidson, E. H. (2007). DEVELOPMENT: Built to Run, Not Fail 10.1126/science.1140979. Science 315, 1510-1511.
Ruffins, S., and Ettensohn, C. (1996). A fate map of the vegetal plate of the sea urchin (Lytechinus variegatus) mesenchyme blastula. Development 122, 253-263.
Ruffins, S. W., and Ettensohn, C. A. (1993). A Clonal Analysis of Secondary Mesenchyme Cell Fates in the Sea Urchin Embryo. Developmental Biology 160, 285-288.
Sweet, H., Hodor, P., and Ettensohn, C. (1999). The role of micromere signaling in Notch activation and mesoderm specification during sea urchin embryogenesis.
Development 126, 5255-5265.
Sweet, H. C., Gehring, M., and Ettensohn, C. A. (2002). LvDelta is a mesoderm-inducing signal in the sea urchin embryo and can endow blastomeres with organizer-like properties. Development 129, 1945-1955.
CHAPTER 1
Developmental Gene Network Analysis
Roger Revilla-i-Domingo and Eric H. Davidson
Published in International Journal of Developmental Biology 47: 695-703 (2003)
ABSTRACT
The developmental process is controlled by the information processing functions executed by the cis-elements that regulate the expression of the participating genes. A model of the network of cis-regulatory interactions that underlies the specification of the endomesoderm of the sea urchin embryo is analyzed here. Although not all the relevant interactions have yet been uncovered, the model shows how the information processing functions executed by the cis-regulatory elements involved can control essential functions of the specification process, such as transforming the localization of maternal factors into a domain-specific program of gene expression; refining the specification pattern; and stabilizing states of specification. The analysis suggests that the progressivity of the developmental process is also controlled by the cis-regulatory interactions unraveled by the network model. Given that evolution occurs by changing the program for development of the body plan, we illustrate the potential of developmental gene network analysis in understanding the process by which morphological features are maintained
and diversify. Comparison of the network of cis-regulatory interactions with a portion of that underlying the specification of the endomesoderm of the starfish illustrates how the similarities and differences provide insights into how the programs for development work, and how they evolve.
KEY WORDS: Gene network, genetic program, evolution and development, genomic regulatory system, sea urchin
INTRODUCTION
The genetic programs that control the processes by which the body plans of animals are built were invented, and shaped, by the evolutionary process. How these programs work, if nothing else, is a matter of great curiosity. Because gene networks constitute the control systems for development, analysis of such networks explains both the process of development and the process by which development has evolved (Davidson, 2001).
Ultimately, development is the process by which the body plans of animals are laid down. Distinct cell types are produced in particular spatial domains, each with particular structural properties given by the distinct programs of gene expression that the cells execute. Through the process of specification each domain in the embryo obtains its developmental identity. Once specified, each domain will run through a progression of states of regulatory gene expression, leading to the establishment and ultimately the stabilization of the terminal programs of gene expression that give each cell type its unique properties.
Spatial cues are always required in order to trigger specification in development.
These spatial cues sometimes consist of localized maternal regulatory factors that are distributed to particular cells with the egg cytoplasm, and are partitioned during cleavage.
Alternatively they can also consist of signaling ligands produced by other cells, in consequence of their own prior state of specification. Ultimately, these spatial cues affect the course of events in development by causing the activation (or repression), in a certain region of the embryo, of particular genes encoding transcription factors. Through this process, new, more refined, domains of specification are created, and the complexity of the embryo increases. But although it is the spatial cues that trigger the events of spatial specification, the locus of programmatic control for each developmental event is the sequence of the particular cis-regulatory elements that respond to the inputs presented (Davidson, 2001).
cis-Regulatory elements can recognize the presence or absence of those transcription factors for which they contain specific binding sites. According to the set of inputs presented in each cell, the cis-regulatory elements of given genes control the expression of the gene in each domain of the embryo. Of particular importance are genes encoding transcription factors, and their cis-regulatory elements. Spatial information is translated by the cis-regulatory elements of these genes into distinct states of regulatory gene expression. It is the network of all these cis-regulatory interactions that is ultimately responsible for driving the process of development. To fully understand how the process of development is programmed in the genomic DNA, it will be necessary to unravel the network of regulatory interactions, and to analyze the information processing functions executed by each cis-regulatory element (Davidson, 2001).
The experiments reviewed here represent a step toward the goal of determining the complete network of DNA-based interactions that underlie one particular major process of development, namely, the specification of the endomesoderm of the sea urchin embryo. Given that evolution occurs by changing the program for development of the body plan, we also illustrate briefly how developmental gene network analysis sheds light on the process by which morphological features are maintained and diversify.
UNRAVELING THE GENE REGULATORY NETWORK THAT UNDERLIES THE PROCESS OF ENDOMESODERM SPECIFICATION IN THE SEA URCHIN EMBRYO
The armature of the network
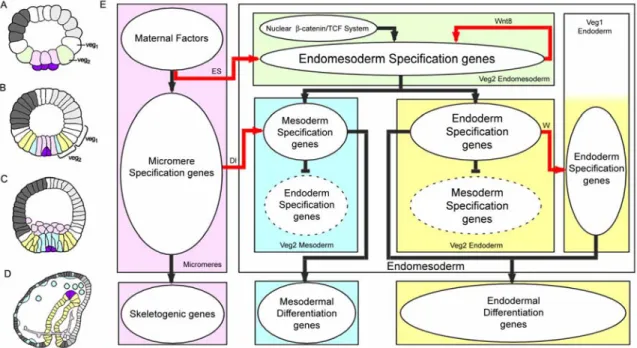
Figure 1.1 illustrates the process of endomesoderm specification in the sea urchin embryo (Fig. 1.1A-D), and it shows a diagram (Fig. 1.1E) that describes the specification events and the genetic functions that underlie this process.
Ultimately, the endomesoderm consists of the endodermal gut, the skeletogenic mesenchyme and several other mesodermal cell types, including pigment cells (Fig.
1.1D). By the seventh cleavage cycle (Fig. 1.1A), the cell lineages of typical sea urchin embryos have been segregated into a canonical set of territories, each of which is destined to give rise to certain distinct cell types (Hörstadius, 1939; Cameron et al., 1987, 1991), and in each of which a distinct set of genes is already running (reviewed by Davidson et al., 1998; Davidson, 2001). The upper or animal pole half of the embryo now consists of blastomeres that produce only the cell types ultimately found in the oral
and aboral ectoderm. The lower half consists of the veg1 ring, their sister cells of the veg2 ring immediately below, and the large and small micromeres at the vegetal pole. In the undisturbed embryo, the large micromeres (the population of cells colored lavender in the diagram) will produce all the cells of the skeletogenic mesenchyme lineage, and the progeny of veg1 and veg2 will produce the rest of the endomesoderm. At the ciliated swimming-blastula stage (Fig. 1.1B), the veg2 lineage has been segregated into two distinct domains: the inner veg2 ring consists of cells that will give rise to mesodermal cell types, including pigment cells; and the rest of the veg2 domain will give rise to endodermal cells (Ruffins and Ettensohn, 1993, 1996). At the mesenchyme blastula stage (Fig. 1.1C), the skeletogenic mesenchyme cells have ingressed into the blastocoel, leaving behind a now fully specified central disc of prospective mesodermal cell types, and peripheral to them, the endodermal precursors (reviewed by Davidson et al., 1998).
After this, the adjacent veg1 progeny will become specified as endoderm as well (Logan and McClay, 1997), and gastrular invagination ensues.
The mechanisms that trigger each one of the specification events that are symbolized by the colors in Fig. 1.1A-D are now reasonably well understood. The micromere lineage is autonomously specified as soon as these cells are formed at fourth cleavage (reviewed by Davidson et al., 1998). The spatial cues that trigger their specification are maternally localized. As soon as they are born, the micromeres emit a signal that, together with spatial cues that are autonomously localized, triggers the specification of the surrounding veg2 cells to endomesodermal fate (Ransick and Davidson, 1993, 1995). The segregation of veg2 between mesodermal and endodermal domains depends on a second signaling event from the micromeres that takes place at 7th-
9th cleavage, and is executed by the ligand Delta (Sherwood and McClay, 1999; Sweet et al., 1999; McClay et al., 2000; Sweet et al., 2002). The cells in the inner veg2 ring, which are exposed to the Delta signal from the micromeres, are specified as mesoderm.
The rest of the veg2 cells will acquire endodermal fate. The result is that the initial crude pattern of specification, which defines veg2 as endomesoderm, has now been refined into two distinct specification states. Finally, another signaling event from the veg2 endoderm triggers the specification of the surrounding veg1 also as endoderm (Logan and McClay, 1997; Ransick and Davidson, 1998).
Fig. 1.1. Endomesoderm specification in the sea urchin embryo. (A-D) Schematic diagrams of sea urchin embryos displaying specified domains, from Davidson et al. (2002b). The color coding shows the disposition of specified endomesoderm components: Lavender indicates skeletogenic lineage; dark purple indicates small micromere precursors of adult mesoderm; green indicates endomesoderm lineage that later gives rise to endoderm, yellow, and mesoderm, blue; light grey indicates oral ectoderm; dark grey indicates aboral ectoderm; white indicates regions yet to be specified at the stages shown. (A) 7th cleavage embryo (about 10 h after fertilization). (B)
Blastula stage embryo at about 9th cleavage (about 15 h after fertilization). (C) Mesenchyme blastula stage embryo (about 24 h after fertilization). (D) Late gastrula stage embryo (about 55 h after fertilization). The drawing shows the later disposition of all the endomesodermal cell types about midway through embryonic morphogenesis. (E) Process diagram describing endomesoderm specification events in the sea urchin embryo. Boxes represent domains of specification according to the color of their background. The color coding represents the same endomesoderm components as in the schematic diagrams A-D. Ovals in the boxes represent sets of genes that execute certain developmental function. Arrows indicate that the set of genes in the oval where the arrow originates triggers the developmental function executed by the genes in the oval where the arrow ends. In particular, red arrows represent signaling events. Barred lines indicate repression of the developmental function executed by the genes in the oval where the barred line ends. Developmental time in the process diagram runs from top to bottom in accordance with the stages represented by the schematic diagrams A-D. “ES” stands for “Early Signal”; “Dl” stands for “Delta”; “W” stands for “Wnt8.” Evidence is reviewed in Davidson et al.
(2002a), and from P. Oliveri, A. Ransick, D.R. McClay and E.H. Davidson, unpublished data.
The knowledge summarized in Fig. 1.1E provides us with the armature on which the network of gene interactions is subsequently built. It tells us what specification functions must be executed by the genes in each domain: for example we know that the genes in the lavender box (Fig. 1.1E) must be able to translate the maternally localized spatial cues into a skeletogenic program of differentiation, and they must also be able to cause expression of the ligand Delta; and that the genes in the blue box must be able to listen to the spatial information given by the Delta signal in order to create a state of specification on which the mesodermal differentiation program is then installed.
The process diagram of Fig. 1.1E also serves another purpose. It tells us how we can interfere specifically with a certain specification event or domain, which is an essential tool in the enterprise of building the regulatory network, as we see below.
Useful as the knowledge contained in Fig. 1.1E might be, it should be made clear that this knowledge by itself does not provide us with any real understanding of the developmental process. Figure 1.1E by itself fails to show us the explicit mechanisms of specification, the instructions followed by each cell on its way to becoming specified.
These instructions are encoded in the genomic DNA. It is the goal of the following to unravel the network of DNA-based interactions from which the instructions for development can be read.
Building the network of cis-regulatory interactions
In order to clothe with real genes the armature of interactions indicated in Fig. 1.1E, a major gene discovery effort was undertaken by performing several differential macroarray screens (Rast et al., 2000). The goal of each of these screens was to isolate cDNA transcripts that are differentially expressed in a given domain of the endomesoderm. To this end, different specification events were interfered with so as to generate populations of RNA transcripts lacking given classes of endomesodermal sequence, and these populations were compared to normal embryo RNA or to RNA from embryos in which the RNA populations contained larger amount of endomesodermal sequences than normal. By using a very sensitive subtractive hybridization technology on these populations of transcripts, probes were created in which sequences differentially expressed in the chosen endomesodermal domain were greatly enriched. These probes were then used to screen large-scale arrays of ~105 clone cDNA libraries (macroarrays) (Rast et al., 2000).
In order to determine the interactions among the different genes, a large-scale perturbation analysis was carried out, in which the expression of many genes was individually altered experimentally, and the effect on all other relevant genes in the network was then measured by quantitative polymerase chain reaction (QPCR) (Davidson et al., 2002a). Given the cis-regulatory interactions predicted by the QPCR experiments, direct cis-regulatory analysis is used to test the predicted network linkages, and in certain instances to unravel the key information processing functions executed by the relevant cis-regulatory elements.
THE CIS-REGULATORY NETWORK: THE CONTROL SYSTEM FOR THE SPECIFICATION PROCESS
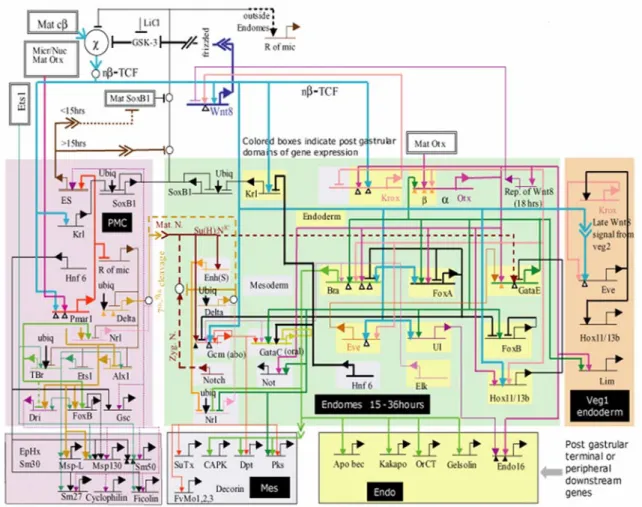
A model for the process of endomesoderm specification is shown in Fig. 1.2 in the form of a network diagram that combines all significant perturbation data; information on time and place of gene expression, as determined by whole mount in situ hybridization (WMISH) and QPCR measurements; cis-regulatory data where available; and all the underlying information of experimental embryology.
At each cis-regulatory element in the model predicted regulatory interactions with the products of other genes in the network are indicated. Therefore each one of these predicted interactions can be experimentally tested by determining the presence and function of the relevant binding sites in the relevant cis-regulatory elements. The importance of this point is worth emphasizing. It means that eventually the cis-regulatory network can be turned into a solid, experimentally confirmed structure.
Even though not all the cis-regulatory interactions that underlie the specification of the endomesoderm of the sea urchin embryo have yet been identified, and even though not all the identified interactions have yet been tested, the model of Fig. 1.2 allows us to see how the network of cis-regulatory interactions controls the specification process. The model shows how the cis-regulatory interactions control the specification functions that need to be executed for the different domains of the endomesoderm of the sea urchin to become what they become.
Fig. 1.2. Regulatory gene network model for endomesoderm specification from fertilization to just before gastrulation. This is a recent version of the model originally presented by Davidson et al. (2002a, 2002b). The current version of the model and the perturbation data on which it is based are available at www.its.caltech.edu/~mirsky/endomes.htm (End-mes Gene
Network Update) and www.its.caltech.edu/~mirsky/qpcr.htm (End-mes Network QPCR Data), respectively. Short horizontal lines from which bent arrows extend represent cis-regulatory elements responsible for expression of the genes named beneath the line. The arrows and barred lines indicate the inferred normal function of the input (activation or repression), as deduced from changes in transcript levels due to the perturbations. Each input arrow constitutes a prediction of specific transcription factor target site sequence(s) in the cis-regulatory control element. Dotted lines indicate inferred but indirect relationships. Arrows inserted in arrow tails indicate intercellular signaling interactions. Large open ovals represent cytoplasmic biochemical interactions at the protein level. The spatial domains are color coded as in Fig. 1.1, and genes are placed therein according to their loci of expression. The interactions at the top of the diagram, with no background color, are very early interactions. The rectangles in the lower tier of the diagram show downstream differentiation genes. “Ubiq” indicates an inferred ubiquitously active positive input. “Mat cβ” indicates maternal cytoplasmic β-catenin. “nβ/TCF” indicates nuclear β- catenin complexed with TCF. For further details see Davidson et al. (2002a, 2002b) and www.its.caltech./~mirsky/endomes.htm. For evidence see text, Davidson et al. (2002a, 2002b), Oliveri et al. (2002), Ransick et al., (2002), Rast et al., (2002), www.its.caltech./~mirsky/endomes.htm.
Interpreting the spatial cues: Specification of the micromeres
The network model of Fig. 1.2 indicates the mechanism by which maternal spatial cues in the micromeres are interpreted and translated into the specification state that is specific to the micromere lineage.
The genes tbr, alx and ets, are all known to activate a number of genes that are responsible for the differentiation of the micromere lineage into skeletogenic cells [Kurokawa et al., 1999; Fuchikami et al., 2002; Ettensohn et al., 2003 and www.its.caltech.edu/~mirsky/qpcr.htm (End-mes Network QPCR Data)]. Early in development, these three skeletogenic regulators are all kept silent everywhere in the embryo by a repressor gene (r of mic). At this time, delta, which is responsible for executing one of the micromere-specific developmental functions, is also repressed
everywhere in the embryo by the same repressor gene. Immediately after the micromeres are born at 4th cleavage, the pmar1 gene is activated specifically in these cells. This gene has a repressor function that shuts down the expression of “r of mic”. Now, delta, and the skeletogenic regulators tbr, alx and ets are allowed to be expressed exclusively in the micromeres, and as a result the skeletogenic program is set in train (Oliveri et al., 2002).
The mechanism just described ensures that once the pmar1 is activated, the micromere specification program will be installed without the need for any further spatial cues. If pmar1 is ectopically expressed everywhere in the embryo, the skeletogenic regulator tbr, the signaling ligand Delta, and the skeletogenic differentiation gene sm50 are all also expressed everywhere, and the whole embryo is now expressing the functions normally executed only by the cells of the micromere lineage (Oliveri et al., 2002, 2003).
The fact that pmar1 is sufficient to establish the skeletogenic program, together with the fact that pmar1 is activated by factors that are all either maternally present or autonomously localized in the micromere nuclei, tells us why the micromeres are autonomously specified. The most important general point is that the explanation of this embryological phenomenon is now provided in terms of the genomically encoded map of cis-regulatory interactions.
Refining the specification pattern: Specification of the pigment cells
The portion of the network in the diagram of Fig. 1.3 tells us the mechanism by which the pigment cells are specified and ultimately differentiated, according to the network model.
The pigment cells arise specifically from the mesodermal cells of the veg2 domain (Ruffins and Ettensohn, 1993, 1996). The Delta signaling ligand produced by the
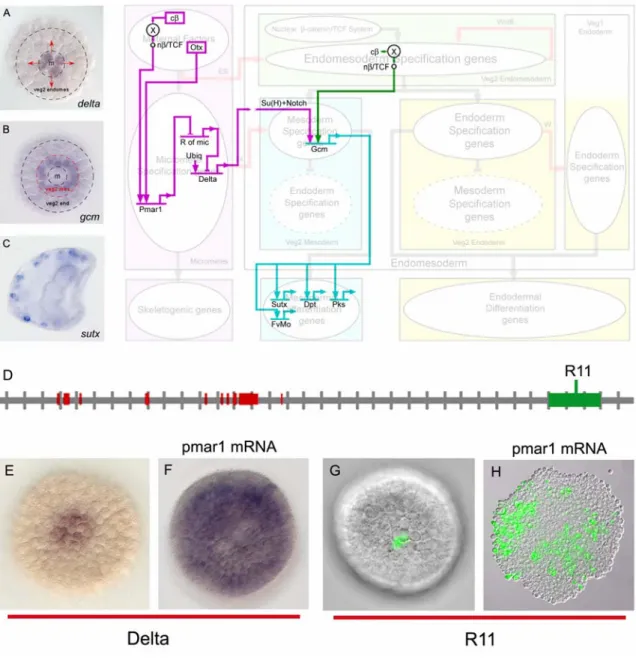
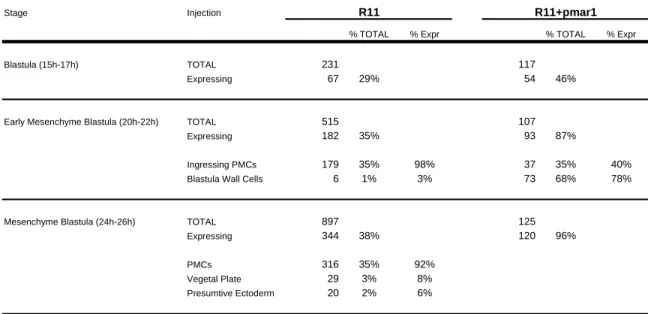
micromeres between 7th and 9th cleavage serves as the spatial cue that triggers the segregation of the mesodermal and endodermal fates of veg2 descendant cells (Fig. 1.3 A-B). Expression of the ligand Delta in the micromere descendants activates a Notch (N) receptor in the adjacent veg2 cells, which is required for normal specification of mesodermal fate in these cells (Sweet et al., 1999; McClay et al., 2000; Sweet et al., 2002). Localization of the Delta signal in the micromere descendants depends on the operation of the pmar1 repression system, as explained above and illustrated in the diagram of Fig. 1.3. The response of Delta to the pmar1 repression system depends on the cis-regulatory element named R11 (Fig. 1.3D-H) (R. Revilla-i-Domingo and E. Davidson, unpublished data). In normal embryos R11 drives expression of a reporter construct in the micromere descendants. When “r of mic” is repressed everywhere in the embryo by ectopic expression of pmar1, the delta gene is activated in every cell (Fig. 1.3 E-F), and in the same embryos R11 also drives expression of the reporter construct everywhere (Fig. 1.3 G-H) (R. Revilla-i-Domingo and E. Davidson, unpublished data).
Expression of the gcm gene begins in the single ring of mesoderm progenitor cells that directly receive the Delta micromere signal (Fig. 1.3B). As shown in the diagram of Fig. 1.3, activation of this gene depends on inputs from both the Notch signal transduction pathway, activated by the Delta signal, and (directly or indirectly) the nuclear β-catenin/TCF system (see diagram of Fig. 1.3), which is active in the whole of veg2 (Davidson et al., 2002a and A. Wikramanayake, unpublished data). The expression of gcm, therefore, reflects the creation of the new mesoderm-endoderm border, which did not exist before the Delta signal was received from the micromeres. The cis-regulatory element of gcm is responsible for integrating the spatial information provided by the
inputs from the Notch transduction pathway, and the β-catenin/TCF system. In normal embryos this element drives the expression of a reporter construct in a localized region in the vegetal plate. But if a portion of this element, containing binding sites for the Notch transduction pathway, is eliminated, expression of the reporter construct is expanded to a broader region that includes the whole of the veg2 domain (A. Ransick and E. Davidson, unpublished data). In other words, now the cis-regulatory element that controls gcm expression is 'blind' to the mesoderm-endoderm border established by the activation of the Notch transduction pathway.
Ultimately, the gene gcm is expressed in the pigment cells (a prominent subset of the veg2 mesodermal cell types), where it activates a number of differentiation genes (see diagram of Fig. 1.3), the products of some of which are likely to be required for synthesis of the red quinone pigment that these cells produce (Davidson et al., 2002b; Ransick et al., 2002; Calestani et al., 2003). If translation of gcm transcripts is blocked experimentally, the perturbed embryos show a perfectly normal morphology, except that they have no pigment cells (A. Ransick and E. Davidson, unpublished data).
The portion of the network depicted in Fig. 1.3 is a piece of the genetic program encoded in the cis-regulatory genomic sequence. It consists of a transcriptional apparatus, including R11 element, that localizes the Delta signal, and another transcriptional apparatus, including the Notch responsive element of the gcm gene, that interprets the signal. It explains why the cells in the inner ring of the veg2, and no others, give rise to pigment cells. And it also explains why elimination of expression of a single player in the program, gcm, results in the absence of the pigment cells. The overall function of this portion of the network is, first, to create a new domain of specification in
the embryo (the veg2 mesoderm), by setting a new border in the specification pattern;
and then to install the program for pigment cell differentiation in the cells of the new domain. Other similar network subelements not yet resolved are undoubtedly responsible for differentiation of additional mesodermal cell types.
Fig. 1.3. Segregation of the veg2 domain into mesodermal and endodermal territories and installation of the pigment cell differentiation program. The diagram shows key interactions, extracted from the model of Fig 1.2, that control the segregation of the veg2 domain and the
installation of the pigment cell differentiation program. The dimmed background shows the process diagram of Fig 1.1E to indicate the domains where the interactions shown happen, and the developmental functions that the genes shown execute. (A) Between 7th and 9th cleavage the micromeres express the signaling ligand Delta (Oliveri et al., 2002; Sweet et al., 2002). The figure shows a whole mount in situ hybridization photomicrograph, from P. Oliveri, displaying the expression of delta gene 12 h after fertilization (around 8th cleavage). “m” indicates micromeres domain. Red arrows indicate the signaling event from the micromeres to the surrounding veg2 endomesodermal cells. (B) The veg2 endomesodermal cells that receive the Delta signal from the micromeres become specified as mesoderm, and express the gene gcm; the rest of the veg2 endomesodermal cells become specified as endoderm (Sherwood and McClay, 1999; Sweet et al., 1999; McClay et al., 2000; Ransick et al., 2002; Sweet et al., 2002). The figure shows a whole mount in situ hybridization photomicrograph, modified from Ransick et al.
(2002), displaying the expression of gcm gene 12 h after fertilization (around 8th cleavage). The red dotted circle indicates the newly formed border that segregates the veg2 domain into mesodermal and endodermal territories. (C) Ultimately, a subset of the veg2 mesodermal cells differentiate into pigment cells, and express the gene sutx (Calestani et al., 2003), among other pigment cell differentiation genes. The figure shows a whole mount in situ hybridization photomicrograph, modified from Calestani et al. (2003), displaying the expression of sutx gene in a gastrula stage embryo. (D-H) The cis-regulatory element R11 controls the localization of delta gene expression in the micromeres. (D) R11 element consists of a sequence of genomic DNA near the coding sequence of the Delta gene. Each tic on the horizontal grey line representing genomic sequence demarcates 1 kb from the previous tic. 5' direction is to the left. Red blocks on the sequence indicate positions of the delta gene coding sequence. The green box on the sequence indicates the position of the R11 element. (E-F) pmar1 mRNA injection results in delta expression everywhere in the embryo. The figures show whole mount in situ hybridization photomicrographs, modified from Oliveri et al. (2002), comparing the expression of delta gene in normal blastula stage embryos (E), and embryos that have been injected with pmar1 mRNA (F).
(G-H) R11 element is responsible for localizing the expression of delta gene in the micromeres of normal embryos, and for driving the expression of the gene in every cell of embryos that have been injected with pmar1 mRNA (R. Revilla-i-Domingo and E. Davidson, unpublished data). The photomicrographs compare the expression of the GFP reporter gene in blastula stage embryos that have been injected with R11 reporter construct (G), and embryos that have been injected with pmar1 mRNA in addition to R11 reporter construct (H).
Stabilizing states of specification: The endoderm
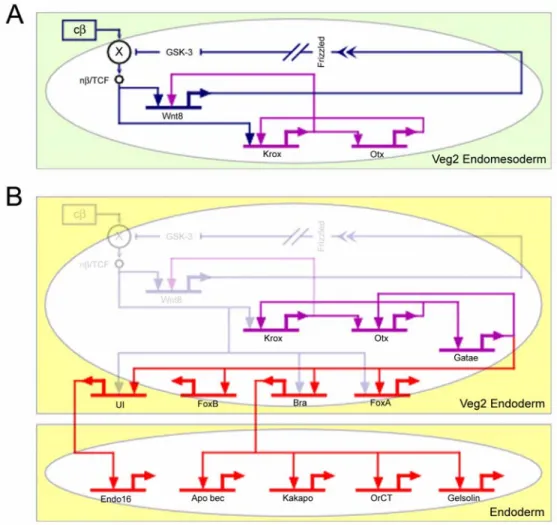
Figure 1.4 illustrates the process by which the veg2 endoderm is specified. The veg2 lineage is born at 6th cleavage. By this time, the two spatial cues that trigger the specification of veg2 as endomesoderm are already operating. These initial cues consist of the autonomous nuclearization of β-catenin, which is a cofactor of the Tcf transcription regulator required for Tcf to function as a gene activator, and the early micromere signal (Ransick and Davidson, 1993, 1995; Logan et al., 1999). Two regulatory subcircuits execute the process by which the zygotic transcriptional apparatus interprets these initial cues, and by which it establishes an endomesodermal state of specification (Fig. 1.4A).
The β-catenin/Tcf input activates the krox gene (Davidson et al., 2002b). This gene stimulates expression of wnt8 gene and one of the transcription units of the otx gene.
Wnt8 is a ligand which activates the β-catenin/Tcf system, and is itself a target of the
β-catenin/Tcf input. This implies an autoreinforcing Tcf control loop, which is set up within the endomesodermal domain once this is defined (Davidson et al., 2002a). So, the result of the stimulation of wnt8 expression, first by the β-catenin/Tcf system and later by krox, is to transfer control of the β-catenin/Tcf system from the autonomous cytoplasmic mechanism by which its activity was initiated to a zygotically controlled, intercellular signaling mechanism operating among the cells of the endomesoderm. The "community effect" (as defined by Gurdon, 1988; Gurdon et al., 1993) established by this regulatory subcircuit (dark blue connections in Fig. 1.4A) takes the cells out of a condition of alternative transcriptional possibility that is their initial condition, and locks them into a stable state of gene expression.
Fig. 1.4. Stabilization of the endomesoderm specification state and installation of the endoderm differentiation program. The diagram shows key interactions, extracted from the model of Fig 1.2, that control the stabilization of the endomesoderm state of specification and the installation of the endoderm differentiation program. (A) The box with green background shows the interactions that operate in the veg2 endomesoderm domain up to about 9th cleavage.
Nuclearization of β-catenin is autonomous, and results in the activation of two regulatory subcircuits. Dark blue subcircuit: Wnt8 intercellular signaling among cells of the veg2 domain stimulates the nuclearization of β-catenin and establishes a "community effect," which defines and locks the endomesodermal state of specification in the veg2 cells. Purple subcircuit: krox and otx cross-regulate, which results in a reinforcing loop that renders the endomesoderm state of specification independent of the initial inputs. (B) The box labeled “Veg2 Endoderm” shows the interactions that operate in the veg2 endoderm domain, from about 9th cleavage to mesenchyme blastula stage. Gatae is added to the krox-otx feedback loop (purple interactions), and together with β-catenin/TCF system, installs the endoderm specification program (red interactions). When
β-catenin/TCF/Wnt8 inputs disappear, the stabilization loop maintains the endodermal specification program active, which eventually results in the activation of endodermal differentiation genes (lower box in the diagram labeled “Endoderm”).
The otx gene stimulates expression of the krox gene. A regulatory subcircuit consisting of otx and krox cross-regulation produces a transcription-level stabilization of the endomesodermal regulatory state (purple connections in Fig. 1.4A) (Davidson et al., 2002a). The otx gene also provides an input into the gatae gene, which in turn has an input back into otx gene. This is a further positive feedback that links the gatae gene into the stabilization circuitry (purple connections in Fig. 1.4B). The gatae gene plays an important role in endoderm specification (red connections in Fig. 1.4B), since, together with the β-catenin/Tcf system, it is responsible for the activation of many of the known endodermal regulators, including the bra, foxA and ui genes (Davidson et al., 2002a and P. Y. Lee and E. Davidson, unpublished data). The FoxA transcription factor is a repressor that has multiple roles in the spatial control of gene expression patterns in the endoderm; Bra results in the activation of endodermal differentiation genes which are involved in cell motility and are needed for gastrulation and invagination to occur (Gross and McClay, 2001; Rast et al., 2002); the UI factor directly controls expression of endo- 16 (Yuh et al., 2001), which encodes a differentiation protein that is secreted in the lumen of the midgut. The crucial role that gatae plays in the specification of the endoderm explains the phenotype shown by embryos in which translation of the gatae transcripts has been blocked. This treatment produces a severe interference with endoderm specification and gut development (P. Y. Lee and E. Davidson, unpublished data).
During the late blastula stage, β-catenin disappears from the nuclei of the veg2 endodermal domain (Logan et al., 1999). But by this time, a network of stable intergenic interactions has been installed, so that the β-catenin inputs used earlier to set up transcriptional specification are no longer needed (Fig. 1.4B).
We see here that the cis-regulatory interactions control the operation of at least three different regulatory devices that are directly responsible for establishing at least part of the endoderm differentiation program. The first device consists of the "community effect," which first defines and then locks on the endomesodermal specification state in the veg2 domain (dark blue connections in Fig. 1.4A). The second device depends on a feedback loop, including krox and otx (purple connections in Fig. 1.4A), which generates a robust and resilient regulatory structure in the already defined endomesoderm domain.
The third device consists of the addition of gatae to the krox-otx feedback loop (purple connections in Fig. 1.4B), which ensures the operation of many endodermal regulatory genes in the endoderm. The result is a control system that drives the specification process forward as a progression of states, and it prevents it from reversing direction when the initial cues that trigger the specification process disappear. Progressivity and stability are fundamental properties of the developmental process. They derive from regulatory devices consisting of assemblages of cis-regulatory interactions.
UNDERSTANDING DEVELOPMENT AND EVOLUTION
Developmental and evolutionary processes both have their root in the heritable genomic regulatory programs that determine how the body plan of each species is built (Davidson,
2001). It has been clear for a long time that the evolution of body plans has occurred by change in the genomic programs for the development of these body plans (Britten and Davidson, 1971), and it is now clear that we need to consider this in terms of change in the regulatory devices that execute these programs. The bilaterians all rely on essentially the same repertoire of regulatory genes to control the developmental organization of their body plans. Analysis of cis-regulatory networks affords the means to focus on the significance of preserved uses of these genes, and on the exact consequences of differences in their use (Davidson, 2001).
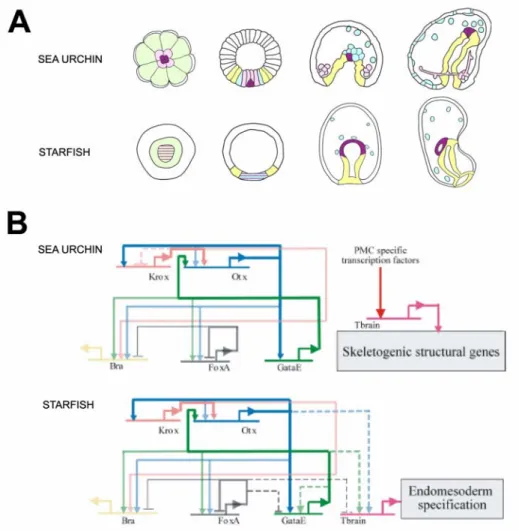
Figure 1.5 compares the way certain genes are utilized in the specification of the endomesoderm of two different bilaterians, namely, the sea urchin and the starfish. All genes in Fig. 1.5, except for tbr, are central elements that control the specification of the endoderm in the sea urchin (see Fig. 1.2 and Fig. 1.4). The tbr gene, on the other hand, is activated exclusively in the micromere derived skeletogenic cells (see Fig. 1.2) (Croce et al., 2001; Fuchikami et al., 2002; Oliveri et al., 2002). Its regulation depends on other genes specifically expressed in the micromere lineage (Oliveri et al., 2002), and in turn, it drives expression of larval skeletogenic differentiation genes (Davidson et al., 2002a;
Oliveri et al., 2002 and www.its.caltech.edu/~mirsky/endomes.htm). While the formation of the endoderm is at least superficially similar in the two species (Fig. 1.5A), starfish embryos do not have a micromere lineage, nor do they produce a larval skeleton (Fig. 1.5A).
Figure 1.5B shows that the cis-regulatory interactions that constitute the endodermal three-gene stabilizing loop in the sea urchin (see Fig. 1.4B), is found in identical form in the starfish (connections in bold in Fig. 1.5B) (Hinman et al., 2003).
This set of identical cis-regulatory interactions must serve conserved evolutionary roles, since the possibility of convergence is ruled out by the number of similar functional starfish and sea urchin cis-regulatory interactions.
Fig. 1.5. Comparison of sea urchin and starfish gene regulatory networks. The figure compares portions of the gene regulatory networks underlying the specification of the endomesoderm in the sea urchin and the starfish embryos. (A) Comparison of the fate maps.
Schematic diagrams of sea urchin embryos (top row) and starfish embryos [lower row, modified from Hinman et al. (2003)] at selected stages. Stages are (from left to right): cleavage/early blastula stage; blastula stage; gastrula stage; and early larval stage. Color coding indicates the fate of domains of cells through development: lavender indicates cells that will become skeletogenic;
green indicates cells that will contribute to mesoderm and endoderm; blue indicates cells that will become mesodermal; purple indicates cells of the mesoderm that specifically will become
coelomic cells; purple stripes indicate domains that might contain a subset of cells that will contribute exclusively to coelomic cells; yellow indicates cells that will become endodermal. (B) Comparison of portions of the underlying gene regulatory networks. The top diagram, corresponding to the sea urchin, is extracted from Fig. 1.2. The bottom diagram, corresponding to the starfish, is from Hinman et al. (2003). Regulatory connections are represented as described in Fig. 1.2. In this figure dashed lines indicate a regulatory connection observed in sea urchin not present in starfish, or vice versa. The positive feedback loops between krox, otx and gatae that are present in both echinoderms are highlighted in bold.
Sea urchins and starfish have diverged for at least 500 million years (Sprinkle and Kier, 1987; Smith, 1988; Bowring and Erwin, 1998). The reinforcing loop is therefore a regulatory device that was invented at least about 500 million years ago, and that has been conserved in at least two independently evolving lineages during all this time. 500 million years represents a very long genomic divergence, in the sense that comparisons of starfish and sea urchin DNA sequences around orthologous regions do not show any conservation distinguishable from random occurrence between the cis-regulatory elements, even when the genes are similarly regulated (V. Hinman and E. Davidson, unpublished data). The preservation of this regulatory device suggests that the function it serves in the specification process must be essential. As we have already seen, in the sea urchin the regulatory feedback loop between krox and otx genes generates a robust regulatory structure in the endomesoderm domain, and the addition of the gatae gene to this feedback loop ensures and maintains the operation of many endodermal regulatory genes after the initial transient inputs have disappeared (Davidson et al., 2002a and P.Y.
Lee and E. Davidson, unpublished data). In the starfish, gatae also drives the expression of many endodermal regulatory genes (Hinman et al., 2003), and in many other bilaterians, members of the Gata family of transcription regulatory genes are required for
gut development (Reuter, 1994; Maduro et al., 2002; Patient and McGhee, 2002). What makes the reinforcing loop especially useful, and hence likely to be preserved during evolution, may therefore be that it controls the installation and stabilization of the expression of the gatae gene in the endoderm (Hinman et al., 2003). Other intergenic feedback loops are used across the Bilateria to serve similar functions. For example a reinforcing feedback loop is found in the hox gene network that controls rhombomere specification in the mouse hindbrain (Nonchev et al., 1996; Barrow et al., 2000), in the regulatory network for tracheal placode specification in Drosophila (Zelzer and Shilo, 2000), and in specification of the oral ectoderm in sea urchin embryos (Amore et al., 2003), among others. It seems a general property of the developmental process to use feedback loops as a mechanism to achieve the progressivity of the process.
The tbr gene, on the other hand, is used in completely different ways in the starfish and sea urchin embryos (Fig. 1.5B). It is required for the formation of the archenteron in the starfish embryo, and its expression is under the control of endodermal regulators (Otx, Gatae) (Hinman et al., 2003), whereas it is involved solely in skeletogenic functions in the sea urchin embryo (Croce et al., 2001; Fuchikami et al., 2002; Oliveri et al., 2002 and www.its.caltech.edu/~mirsky/endomes.htm). The skeletogenic micromere lineage is a relatively recent echinoid invention (Wray and McClay, 1988; Tagawa et al., 2000). This suggests that in the sea urchin the skeletogenic use of tbr may have been coopted from an adult skeletogenic regulatory system, while an original embryonic endomesodermal regulatory element was lost (Hinman et al., 2003).
If indeed the larval skeletogenic lineage is the result of a cooption from the adult skeletogenic regulatory system, it represents an example of how a regulatory subroutine