Bishnupada Mandal I present to the HOD, Department of Chemical Engineering, for extending all necessary facilities for carrying out my research work. Chandramohan Somayaji of the Department of Mechanical Engineering, for their suggestions and input in my research work.
CURRICULUM VITAE
Research Papers in Journal
Manuscript under review
Research Papers in Conferences
ABSTRACT
The effects of various parameters on the mass transfer coefficient were expressed based on the flow patterns in the spiral coil reactor. With non-Newtonian fluid the mass transfer coefficient decreases with increasing fluid viscosity (SCMC concentration).
CONTENTS
118 4.8 Variation of mean residence time with superficial liquid velocity 119 4.9 Effect of superficial gas velocity on dispersion coefficient 120 4.10 Effect of superficial liquid velocity on dispersion coefficient 121 4.11 Effect of SCMC concentration on dispersion coefficient 121. 417 gas size. holdup in three-phase flow 175 6.5 Variation of the mass transfer coefficient with the superficial.
LIST OF TABLES
CHAPTER-1
BACKGROUND AND FORMULATION OF RESEARCH
Introduction
However, studies on the use of spiral wound tubes for hydrodynamics, residence time distribution (RTD), heat and mass transfer with non-Newtonian fluids are rare. Therefore, there is a scopeto investigate the effects of various dynamic and geometrical variables on hydrodynamics, RTD, heat and mass transfer with non-Newtonian fluids in multiphase flow system in spiral wound tubes.
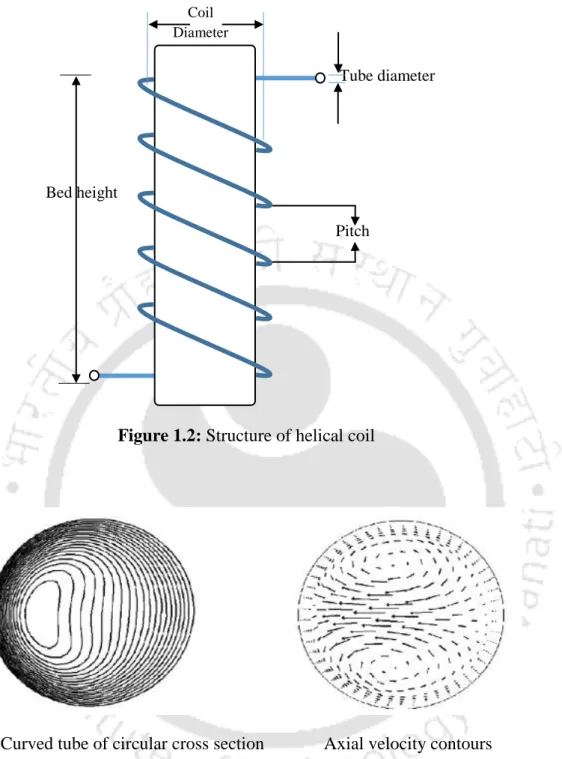
Curved coils (or) Tubes
Cross-sectional mixing of fluid elements occurs which results in increased heat and mass transfer coefficients and thus makes curved channels useful for heat exchangers and diffusion devices (Vashisth et al., 2008). The coil is a suitable device for boiling in the absence of gravity (Ali et al., 1968).

Hydrodynamics in helical coil
- Flow Pattern
- Pressure drop
- Void fraction (or) holdup of phase
- Mixing characteristics in helical coil
- Heat transfer in helical coil
- Mass transfer in helical coil
Therefore, the change in slope of the gas holdup curve can be identified as a regime transition point. Electrical conductivity method: Gas holdup can also be calculated by measuring the electrical conductivity of the liquid.
Scope of work
They found mass transfer coefficient 2 to 2.5 times in helical coils compared to straight tubes. The more detailed literature on mass transfer in helical coils is given in Chapter 6.
Formulation and outline of the work
Background and research formulation (v) Study of convective heat transfer of two-phase gas non-Newtonian flow in a vertical helical coil. Development of a correlation for the interpretation of heat transfer performance in a helical coil. vi) Study the fluid wall limited mass transfer based on the flow pattern under gas and non-Newtonian fluid flow conditions in a helical coil.
Significance of formulated research work
From the literature review the mass transfer coefficient in the spiral system is more than in the straight pipe. Mass transfer at the boundary wall of spirally wound circular tubes in the absence and presence of packed solids, Int.
CHAPTER-2
FLOW PATTERN AND ITS TRANSITIONS
Introduction
They did not interpret the flow patterns and his maps with non-Newtonian fluids. 1990) noted that there is a similar flow pattern between the helical coil and inclined tubes. In their study, the tube slope and tube curvature show similar effect to the flow patterns.
Theoretical background
- Analysis to predict flow patterns by using Probabilistic Neural Network (PNN)
The probability density function fk(x) corresponds to the concentration of class k samples around the unknown sample. The hidden layer consists of neurons equal to the total number of training variables.

Experimental
- Physical properties of the slurry system
- Particle size distribution
- Uncertainty analysis
The physical properties of the fluid (air, water and SCMC) used for this study are shown in Table 2.1. In the present study, the mean (x̅) and standard deviation (STDEV) of the repeated experiments were calculated as, respectively.

Results and discussion
- Flow pattern in two-phase system
- Flow pattern in three-phase system
- Prediction of flow pattern transition
- Analysis to predict the flow pattern transition by empirical correlation model With the present experimental data, flow patterns occurs in two transitions, i.e., plug-slug
- Prediction of flow pattern map by PNN model
Typical snapshots of different flow patterns in helical coil from the present experiment are shown in Figure 2.11. Flow pattern and its transitions Figure 2.12 shows the flow patterns observed at three different coil diameters at constant tube diameter (dt = 0.015 m), SCMC (2.0 kg/m3) and pitch difference (1.5). From these two figures it can be concluded that the trained PNN gives maximum average percentage accuracy in prediction (Figure 2.14b) at a spread constant value of 0.04 with regression coefficient of 0.993.

Conclusions
Two-phase frictional pressure drop of gaseous non-Newtonian fluid flow through helical coils in vertical orientation. Flow pattern transition, frictional pressure drop and holdup of gas non-Newtonian fluid flow in helical tube, Asia Pac. Series solutions for nonlinear partial differential equations with slip boundary conditions for non-Newtonian MHD fluid in porous space.
CHAPTER‐3
GAS HOLDUP AND PRESSURE DROP CHARACTERISTICS
Introduction
Ali and Seshadri (1971) reported that the pressure drop in a spiral coil tube is very large compared to an Archimedean spiral tube due to the compactness of the spiral coil. They found that the pressure drop of a negative logarithmic spiral coil shows greater resistance to flow. Mandal and Das (2003) studied two-phase pressure drop and holdup for gas-Newtonian liquid flow through vertical spiral coils.
Theory of frictional pressure drop
The schematic of the experimental setup used in the present investigation is given in Figure. Two pressure taps (PT1 and PT2) at the start and end of the coil are provided to measure pressure drop across the coil. The quick closing valves (Solenoid valves) SV1 and SV2 in the setup are placed at the two ends of the test section.

Results and discussion
- Variations of the two-phase pressure drop
- Effect of flow rate and concentration of SCMC on two-phase pressure drop
- Effect of tube to coil diameter ratio on two-phase pressure drop
- Effect of pitch length to coil diameter ratio on two-phase pressure drop
- Variations of the three-phase pressure drop
- Gas holdup and its analysis
- Frictional pressure drop and its analysis
- Analysis of frictional pressure drop by Lockhart–Martinelli (L-M) model
- Analysis of three-phase frictional pressure drop using Davis Correlation
- Prediction of friction factor at different flow patterns by correlation model
- Analysis of frictional pressure drop by Mechanistic model development Energy Balance Equation
- Correlations of friction factor multiplier ( l )
The variation of frictional pressure drop for three-phase system with Kieselguhr concentration is shown in Figure 3.6. From the values of the friction factor, the calculated friction pressure drop can be obtained from Eq. Gas interruption and pressure drop The friction factor can also be represented by the rate of energy loss due to wettability.

Conclusions
The surface tension decreases with increasing SCMC concentration leading to increased energy loss due to wetting. So as surface tension increases the friction factor and hence increases in friction losses. The variation of the friction factor with energy loss due to humidity is shown in figure 3.14.
Nomenclature
Measurement and correlation of the pressure drop in two-phase air-water flow in horizontal spiral pipes. Pressure drop for single- and two-phase flow of non-Newtonian fluids in spiral coils. An investigation and comparative study of the pressure drop in two-phase air-water flow in vertical spiral pipes.
CHAPTER-4
MIXING CHARACTERISTICS
Introduction
Trivedi and Vasudeva (1975) reported the experimental study of dispersion of solute in helical coils under laminar flow conditions by the tracer method. From the literature it is found that in helical coil studies on flow pattern based mixing properties with Newtonian and non-Newtonian fluids are very scarce. The present work shows the mixing properties in helical coil using Newtonian and non-Newtonian fluid.
Theory to analyze mixing characteristics
- Models for analyzing mixing characteristics
- Method for evaluation the axial dispersion coefficient from RTD data
The literature review shows that the study of the dispersion coefficient in the liquid phase is in most cases carried out using an axial dispersion model. Here Ez is the axial dispersion coefficient (m2/sec), A is the tube cross-sectional area (m2), CT is the concentration of the tracer at each location z in the spiral coil, Ui is the interstitial or true velocity of the tracer element in tube. Using the method of moments, the average residence time (tm) of the parameters and the Peclet number (Pe) can be estimated from the axial dispersion model.

Experimental
Variance represents the square of the spread of the distribution as it passes through the test section. Mixture characteristics The values of the parameters a and b (Eq. 4.21) for various SCMC+ NaCl solutions are given in Table 4.1. Relative uncertainty is calculated from the standard uncertainty and mean of the corresponding data set.

Results and discussion
- Residence time distribution
- Effect of superficial velocity on dispersion coefficient
- Effect of geometrical variables on dispersion coefficient
- Development of correlation model to predict the intensity of mixing
From the Figure 4.10 it is also observed that the value of dispersion coefficient is higher at higher liquid flow rate. It was observed that the increase in tube diameter, the dispersion coefficient decreased at constant two-phase flow. While the coil diameter is increased, the curvature and the number of turns also decrease, resulting in a decrease in the distribution coefficient.

Conclusion
Ez Axial diffusion coefficient (m2/s) FT Volumetric flow rate of tracer (m3/s) g Acceleration due to gravity (m2/s) K Conductivity meter reading (μ S/m) L Characteristic length (m). Effect of tube curvature ratio on the residence time distribution of multiple particles in helical tubes. Effect of coil pitch and cross-sectional ellipticity on RTD for diffusion-free laminar flow in spiral tubes.
CHAPTER-5
HEAT TRANSFER CHARACTERISTICS
Introduction
Heat Transfer Characteristics reasonably high Dean number, where the asymptotic behavior of the flow and heat transfer. They paid sufficient attention to the heat transfer in the thermal entry region as well as in the fully developed thermal region. They reported that helical coiled tubes compared to straight tubes remarkably improved the heat transfer rate.
Theoretical background
Although an improvement in energy efficiency is possible from the topological and configuration point of view, much more is still needed from the heat transfer fluid point of view. From the literature, it can be seen that substantial experimental data are much less in the literature on heat transfer characteristics in spiral wound tubes with two-phase flow systems (gas-non-Newtonian liquid). Thus, setting the heat flux value (q) in Eq. 5.1) the heat transfer coefficient (h) can be calculated.
Experimental
By adding the values of different concentrations of SCMC used in the experiment, the Cp values of the solution were calculated from the fitted equation. The thermal conductivity of the SCMC solution was calculated using a correlation developed from the experimental data of Carezzato et al. By compiling the values of different concentrations of SCMC used in the experiment, the corresponding values of thermal conductivity of the solution were calculated from the correlation.

Results and discussion
- Variation of heat transfer coefficient with liquid flow rate
- Variation of heat transfer coefficient with gas flow rate
- Variation of heat transfer coefficient with SCMC concentration
- Variation of heat transfer coefficient with tube diameter
- Development of correlation model
- Comparison of heat transfer coefficient of helical coil with straight tube
Also with the increase in the air flow rate, the heat transfer coefficient of the air-SCMC system gradually increases. As the tube diameter increases, the surface area of the coil increases and consequently the heat transfer coefficient decreases. In general, the heat transfer coefficient has been seen to increase as the viscous heat generation increases.

Conclusion
It was also seen that non-Newtonian fluids (SCMC) played an important role in enhancing heat transfer. As the concentration of SCMC increases the heat transfer coefficient in the spiral coil system increases significantly. A correlation has been developed to predict the heat transfer coefficient, the study may be useful to further understand the two-phase heat transfer characteristics in the spiral coil system.
Entrance region heat transfer in a uniform wall-temperature helical coil with transition from turbulent to laminar flow. Experimental studies on heat transfer to Newtonian and non-Newtonian fluids in helical coils with laminar and turbulent flow. Heat transfer coefficients from Newtonian and non-Newtonian fluids flowing in laminar regime in a helical coil.
CHAPTER-6
MASS TRANSFER CHARACTERISTICS
Introduction
In their study the mass transfer coefficient was found to be affected by particle diameter and height difference (p/Dc). 2011) studied the wall-fluid mass transfer in spiral spiral tubes with packing materials. Due to higher mass transfer in coil coil, more studies are required for the same. There is a lack of study on mass transfer with non-Newtonian fluid in the spiral system.
Experimental
- Experimental setup and operating conditions
- Measurement of mass transfer coefficient
The inner walls of the coils were equipped with m-diameter copper point electrodes to estimate the mass transfer coefficient. The value of the limiting current is obtained from the profile of the current (i) and the applied potential (E). When the limiting phase of the current in a polarized electrode is reached, the concentration of ionic species on the electrode surface (Cs) becomes zero.