저작자표시-비영리-변경금지 2.0 대한민국 이용자는 아래의 조건을 따르는 경우에 한하여 자유롭게
l 이 저작물을 복제, 배포, 전송, 전시, 공연 및 방송할 수 있습니다. 다음과 같은 조건을 따라야 합니다:
l 귀하는, 이 저작물의 재이용이나 배포의 경우, 이 저작물에 적용된 이용허락조건 을 명확하게 나타내어야 합니다.
l 저작권자로부터 별도의 허가를 받으면 이러한 조건들은 적용되지 않습니다.
저작권법에 따른 이용자의 권리는 위의 내용에 의하여 영향을 받지 않습니다. 이것은 이용허락규약(Legal Code)을 이해하기 쉽게 요약한 것입니다.
Disclaimer
저작자표시. 귀하는 원저작자를 표시하여야 합니다.
비영리. 귀하는 이 저작물을 영리 목적으로 이용할 수 없습니다.
변경금지. 귀하는 이 저작물을 개작, 변형 또는 가공할 수 없습니다.
A Dissertation for the Degree of Doctor of Philosophy
Targeting Macrophages in the Microenvironment of
Inflammation and Cancer
염증 및 종양 미세환경에서 큰포식세포 표적화 연구
By
Juha Song, D.V.M.
August 2020
College of Veterinary Medicine
Department of Veterinary Pathology and Preventive Medicine (Laboratory Animal Medicine)
Graduate School of Seoul National University
Targeting Macrophages in the Microenvironment of
Inflammation and Cancer
염증 및 종양 미세환경에서 큰포식세포 표적화 연구
By
Juha Song, D.V.M.
August 2020
College of Veterinary Medicine
Department of Veterinary Pathology and Preventive Medicine (Laboratory Animal Medicine)
Graduate School of Seoul National University
1. ABSTRACT
Macrophages are highly abundant in cancer- and inflammatory-associated microenvironments, and their presence at the site of disease modulates these microenvironments towards disease-favorable conditions. Tissue-resident macrophages adapt to their surroundings, allowing them to perform functions specific to their local microenvironment. For this reason, macrophages should be analyzed and targeted in the context of the disease-specific microenvironment. In this study, I aimed to examine the microenvironmental changes in choroidal neovascularization (CNV), an inflammatory eye disease, and in ovarian cancer. I sought to investigate the characteristics of the infiltrating macrophages, based on which I suggest strategies for the development of therapeutic interventions. Herein, I have revealed that inflammation beyond homeostasis-maintaining parainflammation in the retinal pigment epithelium (RPE) results in the suppression of mitochondrial metabolism and perturbations of glucose, lipid, and amino acid metabolic pathways. Indeed, for the first time, I was able to demonstrate increased lactic acid levels in the RPE-choroid complex in an experimentally-induced CNV mouse model. Lactic acid, a glycolytic end-product, facilitated neovascularization by enhancing the pro-angiogenic properties of the infiltrating macrophage population. Blocking lactic acid signaling in macrophages significantly reduced CNV, suggesting that it is a promising strategy for future CNV treatment (Chapter 1). Next, using a zebrafish tumor metastasis model, I also found that substantial numbers of macrophages were recruited to areas surrounding the ovarian cancer cells implanted. Monocytes
recruitment, macrophage activation, and interaction with cancer cells during early dissemination were significantly enhanced through the factor inhibiting HIF (FIH)-G9a signaling axis in ovarian cancer cells. Indeed, secretome analysis of cancer-derived supernatants revealed an overall upregulation of cytokines, such as transforming growth factor β1 (TGFβ1) and vascular endothelial growth factor A (VEGFA), fostering a pro-tumorigenic and pro- metastatic tumor microenvironment. Based on a reliable model, I have also developed a potential therapeutic strategy that can block cancer intravasation and metastasis (Chapter 2). Together, my results provide valuable insight into the disease mechanisms in inflammatory disease and cancer research, paving the way for future mechanistic studies.
Keywords: microenvironment, macrophage, inflammation, choroidal neovascularization, ovarian cancer
Student number: 2015-30482
2. GENERAL INTRODUCTION
The microenvironment in a variety of disease states is influenced by both pathological processes and a patient’s overall health status [1]. Initiation of changes at the microenvironmental level can have both local and systemic implications [2]. Consequently, it is critical to understand the various models of disease microenvironments and their potential consequences so as to appropriately diagnose the disease, and fine-tune the treatment strategy accordingly [1]. Typically, when thinking of pathological processes that have a strong microenvironmental component, cancer and chronic inflammatory diseases, such as arthritis, stand out. Associated microenvironments show similar tendencies of being pathologically driven by inflammation, thereby sharing common characteristics among the encapsulated microenvironments [1].
Macrophages are highly abundant in cancer- and inflammatory-associated microenvironments, and their presence at the site of disease modulates these microenvironments towards disease-favorable conditions. [3]. In fact, although “macrophage activation” is the term commonly used in this context, however, numerous experimental evidences have shown that this activated phenotype is highly dynamic, depending on the stimulus driving recruitment and activation, and the corresponding locations where these processes are initiated [4]. The phenotypic heterogeneity of macrophages generated in vitro coincides with the wide array of phenotypes that occur in vivo [5]. Tissue- resident macrophages adapt to their surroundings, allowing them to perform functions specific to their local microenvironment [3, 5]. For this reason,
macrophages should be analyzed and targeted in the context of the disease- specific microenvironment.
In this study, I aimed to unravel the microenvironmental changes facilitating the pathological progression of choroidal neovascularization (CNV), an inflammatory eye disease, and of ovarian cancer. I sought to analyze the characteristics of the infiltrating macrophages, based on which I suggest strategies for the development of therapeutic interventions. First, using the latest proteome and phosphoproteome profiling approaches, I was able to reveal that inflammation beyond homeostasis-maintaining parainflammation in the retinal pigment epithelium (RPE) results in the suppression of mitochondrial metabolism and perturbations of glucose, lipid, and amino acid metabolism pathways. Accordingly, I was able to detect increased lactic acid levels in the RPE-choroid complex in an experimentally-induced CNV mouse model. Lactic acid, a glycolytic end-product, facilitated neovascularization by enhancing the pro-angiogenic properties of infiltrating macrophage population.
Blocking lactic acid signaling in macrophages significantly reduced CNV, suggesting that it is a promising strategy for future CNV treatment. Next, using a zebrafish tumor metastasis model, I also found that substantial numbers of macrophages were recruited to areas surrounding the ovarian cancer cells implanted. Monocytes recruitment, macrophage activation, and interaction with cancer cells during early dissemination were significantly enhanced through the FIH-G9a signaling axis in ovarian cancer cells. Indeed, secretome analysis of cancer-derived supernatants revealed an overall upregulation of cytokines, such as transforming growth factor β1 (TGFβ1) and vascular endothelial growth factor A (VEGFA), fostering a pro-
tumorigenic and pro-metastatic tumor microenvironment. Based on a reliable model, I have also developed a potential therapeutic strategy that can block cancer intravasation and metastasis. Together, my results provide valuable insight into the disease mechanisms in inflammatory disease and cancer research, paving the way for future mechanistic studies.
3. CONTENTS
1. Abstract ... 3
2. General introduction ... 5
3. Contents ... 8
4. List of tables and figures ... 9
5. List of abbreviations ... 11
6. Chapter 1. ... 13
6.1. Introduction. ... 14
6.2. Materials and Methods. ... 17
6.3. Results. ... 32
6.4. Discussion. ... 59
7. Chapter 2 ... 67
7.1. Introduction. ... 68
7.2. Materials and Methods. ... 71
7.3. Results. ... 79
7.4. Discussion. ... 104
8. References ... 107
9. Abstract in Korean ... 119
4. LIST OF TABLES AND FIGURES
CHAPTER 1. Finding a Macrophage Targeting Strategy in Inflammatory Disease
Figure 1. Experimental setup and workflow to investigate lipopolysaccharide (LPS)-stimulated ARPE-19 proteome and phosphoproteome … 42 Figure 2. Reproducibility of global proteomic quantification ……… 44 Figure 3. Overview of the LPS-stimulated ARPE-19 proteome and
phosphoproteome ……… 45 Figure 4. Visualization of changing proteins and their biological pathways …46 Figure 5. HCL analysis of the identified phosphoproteins with differential
phosphorylation intensities ……… 47 Figure 6. HCL analysis of the identified phosphoproteins with differential
phosphosite intensities ……… 48 Figure 7. Network analysis of proteins related to inflammation-driven
pathology of ARPE-19 cells ………49 Figure 8. Western blot analysis of proteins and phosphoproteins included in the pathways related to inflammation-driven pathogenesis ………50 Figure 9. Lactic acid is increased in RPE-choroid regions of CNV-induced
mice ……… 51 Figure 10. Lactic acid induces VEGF expression in macrophages ………52 Figure 11. Lactic acid enhances VEGF expression in THP-1 macrophages…53 Figure 12. Lactic acid-stimulated THP-1 macrophages facilitate angiogenesis
………54 Figure 13. Macrophage infiltration and their VEGF secretion are increased in RPE-choroid regions in CNV mice ………55 Figure 14. Blocking lactic acid uptake attenuates CNV ………56 Figure 15. Schematic summary ……… 58
CHAPTER 2. Finding a Macrophage Targeting Strategy in Cancer
Figure 1. Establishment of a multicolor-based system to monitor interactions between cancer cells, macrophages, and microvessels ………86 Figure 2. Macrophages interact with cancer cells during metastasis …………87 Figure 3. Macrophages are associated with ovarian cancer cells during metastasis in G9a-axis-dependent manner ………88 Figure 4. Stable knockdown of FIH-1 in SKOV-3 G9a-WT cells ………90 Figure 5. Macrophages are associated with ovarian cancer cells during metastasis in FIH-G9a axis-dependent manner ………91 Figure 6. Characterization of macrophages and neutrophils in the region of CHT in developing zebrafish embryo ………92 Figure 7. Lineage-specific depletion of macrophages by the morpholino-
mediated knockdown of Pu.1 ……… 93 Figure 8. Myeloid cells depletion reduces metastasis of SKOV-3 cells…… 94 Figure 9. FIH-G9a acis promotes recruitment and differentiation of THP-1
monocytes ………96 Figure 10. FIH-G9a axis upregulates CD206 expression in THP-1
macrophages ………97 Figure 11. Activated THP-1 macrophages facilitate metastasis of SKOV-3 …
……… 98 Figure 12. Activated mouse bone-marrow-derived macrophages (BMDM) facilitate metastasis of SKOV-3 control cells ………99 Figure 13. Differential protein secretome analysis in SKOV-3 control and NQ
cells ……… 100 Figure 14. Human cytokine profile changes in SKOV-3 control and NQ cells
………102 Figure 15. A proposed mechanism of FIH-G9a axis-induced macrophage
activation and metastasis in ovarian cancer ……… 103
5. LIST OF ABBREVIATIONS
RPE: retinal pigment epithelium
AMD: age-related macular degeneration CNV: choroidal neovascularization
BrM: Bruch’s membrane
MCT: monocarboxylate transporter
VEGF: vascular endothelial growth factor LA: lactic acid
IB4: isolectin B4
MFI: mean fluorescence intensity TMT: tandem-mass tag
LPS: lipopolysaccharide
α-CHC: alpha-cyanohydroxycinnamic acid ECAR: extracellular acidification rate OCR: oxygen consumption rate
FDR: false discovery rate
PCA: principal component analysis DEP: differentially expressed protein DPP: differentially phosphorylated protein HCL: hierarchical clustering
GSEA: gene set enrichment analysis ER: endoplasmic reticulum
GO: gene ontology
HIF1α: hypoxia-inducible factor 1α ICAM-1: intracellular adhesion molecule 1 OXPHOS: oxidative phosphorylation
PMA: 12-myristate 13-acetate FIH: factor inhibiting HIF
TAM: tumor-associated macrophage
EMT: epithelial-to-mesenchymal transition PVS: perivitelline space
CM: conditioned media
BMDM: bone marrow-derived macrophage Tg: transgenic
MO: morpholino
PDGFC: platelet-derived growth factor C FGF: fibroblast growth factor
MMP: matrix metalloproteinase iNOS: inducible NO synthase
6. CHAPTER 1
Finding a Macrophage Targeting Strategy in Inflammatory Disease
; Lactic acid upregulates VEGF expression in macrophages and facilitates choroidal
neovascularization
6.1. INTRODUCTION
The RPE is a hexagonal pigmented cell layer located between the retina and choroid [6]. As part of blood-ocular barrier, the RPE helps maintain retinal homeostasis and visual function through mutualistic physical and metabolic interactions with the retina, and supports immune privilege by producing cell- surface and soluble inhibitory molecules such as CD86 and TGFβ [7-10].
Perturbations caused by aging, genetic predisposition, or environmental insults result in a wide range of retinal dystrophies such as age-related macular degeneration (AMD) [11, 12]. Importantly, many studies have noted that the allostatic overload imposed during RPE pathogenesis results in inflammation [13-15]. Although low-grade para-inflammation exerts a cytoprotective effect against local stress, overwhelming and persistent inflammatory processes caused by complex biological disturbances, such as oxidative stress, complement abnormalities, and drusenoid dsposits, are known to instigate the recruitment and activation of immune cells, exacerbating metabolic and pathobiological changes to the RPE [15]. However, the precise mechanisms causing these destructive changes to the RPE remain unclear. An improved understanding of RPE-specific inflammatory responses that determine disease progression is necessary.
CNV, a wet form of AMD, is a leading cause of visual impairment and legal blindness in people older than 50 years [11]. Newly formed blood vessels extend anteriorly through breaks in Bruch’s membrane and invade the subretinal space, resulting in hemorrhage, fluid exudation, and, eventually, photoreceptor degeneration [16]. Experimental data suggest that CNV results
from responses of the RPE to heterogeneous stressors, including aging, smoking, or genetic predisposition, creating microenvironments that promote abnormal neovascularization [17]. A number of efforts have been undertaken to discover reliable indicators of CNV development. Of note, recent findings suggest that an assessment of altered metabolic states could be a comprehensive means for identifying CNV progression. However, few studies have evaluated the metabolic influence on CNV pathogenesis [18-22].
The high-sensitivity tandem mass tag (TMT) labeling approach coupled with high-resolution mass spectrometry is a recently developed proteome technique that can identify thousands of proteins with improved coverage and accuracy [23]. In this study, by employing a TMT label-based quantitative approach using the human RPE cell line ARPE-19, I sought to elucidate differential expression patterns in the proteome and phosphoproteome of ARPE-19 cells exposed to lipopolysaccharide (LPS) compared to control cells.
By doing so, I aimed to identify how aberrant pathways induce the RPE degeneration phenotype. After choosing a promising target metabolite expected to be involved in the pathobiology, I evaluated its value as a therapeutic target using an in vivo laser-induced CNV mouse model. Here, I demonstrate that lactic acid levels were significantly increased in laser- induced CNV mice. Through in vitro and in vivo studies, lactic acid was found to serve as a pro-angiogenic agent by increasing the VEGF content of macrophages, but not that of other surrounding cells. This was effectively inhibited by blocking of lactic acid uptake through treatment with the monocarboxylate transporter 1 (MCT1) blocker, α-cyanohydroxycinnamic acid (α-CHC). Finally, α-CHC–injected CNV mice showed significantly
reduced neovascular lesions compared with vehicle-treated mice. Thus, blockade of lactic acid signaling in macrophages may have anti-angiogenic effects and should thus be considered for future therapeutic application in CNV.
6.2. MATERIALS AND METHODS
Cell Line Culture and Reagents
Human ARPE-19 cells were purchased from the ATCC (CRL-2302, Manassas, VA, USA) and cultured in Dulbecco’s modified essential medium and Ham’s F12 (DMEM/F12, 1:1, Gibco, Carlsbad, CA, USA) supplemented with 10% fetal bovine serum (FBS, Gibco), 2 mM L-glutamine (Gibco), and 1%
penicillin-streptomycin (Gibco) at 37 ℃ under 5% CO2 in a humidified incubator. For proteomic and phosphoproteomic analysis, cells were seeded onto a 100-mm dish tissue culture plate (3.5 × 10⁶ cells per well; Corning GlassWorks, Corning, NY, USA) and differentiated in DMEM/F12 media with reduced serum (1% FBS) for 7 days. For in vitro experiment, cells were seeded in 24-well tissue culture plates (1.5 × 10⁵ cells per well; Corning GlassWorks) and maintained for 7 days. The culture medium was changed every 2 days. Polarized monolayer cultures showing TEER greater than 40 Ωcm2 were used for the downstream experiments. Human umbilical vein endothelial cells (HUVECs; Lonza Ltd., Basel, Switzerland) were purchased and cultured in endothelial growth medium-2 (EGM-2) (Lonza). Human acute monocytic leukemia THP-1 cell line was maintained in RPMI media containing 10% FBS (Gibco). Differentiation of THP-1 cells into macrophages was performed by incubation with 15 ng/mL phorbol 12-myristate 13-acetate (PMA) (Sigma-Aldrich Corp., St. Louis, MO, USA) for 2 days at 37℃ with 5%
CO2.
Immunofluorescence Staining
After fixed with 4% paraformaldehyde for 15 min at room temperature, ARPE-19 cells were washed with PBS containing 0.3% Triton X-100 (PBST) three times and blocked at 37 °C for 1 h in PBST supplemented with 5% FBS (Gibco). Then, the cells were incubated with the following primary antibodies at 4°C overnight: rabbit anti-ZO-1 (Santa Cruz Biotechnology Inc., Santa Cruz, CA, USA), mouse anti-Na+K+ATPase (Santa Cruz Biotechnology Inc.), and mouse anti-RPE-65 (Novus Biologicals, Littleton, CO, USA). Cells were washed 3 times for 5 min with PBST and incubated with Alexa Fluor 488- labeled goat anti-rabbit IgG (Molecular Probes, Eugene, OR, USA) and Alexa Fluor 635-labeled goat anti-mouse IgG (Molecular Probes) for 1 h at room temperature. Stained cells were examined under Olympus FV1000 Confocal Scanning Scope (Olympus, Tokyo, Japan).
Sample Preparation for Proteomic and Phosphoproteomic analysis
ARPE-19 cells were stimulated with different concentrations of LPS (from Salmonella enteritidis, Sigma) for the indicated periods (45 min and 24 h; n = 3). Unchallenged cells (denoted as 0 min) were used as controls. Then, LPS- treated and control ARPE-19 cells were immediately washed twice and harvested with 1 mL of ice-cold PBS containing protease inhibitor and phosphatase inhibitor (GenDepot, Barker, TX, USA). Cells were stored at -80℃
for the downstream proteomic and phosphoproteomic analysis.
Protein Digestion
Cell lysates were digested using the Filter Aided Sample Preparation (FASP) method [24, 25]. First, cell pellets were lysed with the lysis buffer (4% SDS,
1 mM DTT, and 0.1 M HEPES pH 7.5). Protein concentration was determined using the BCA reducing compatible kit (Thermo Fisher Scientific, Rockford, IL, USA). After acetone precipitation with 200 μ g of protein, pellets were resolved with the SDT buffer (4% SDS, 2 mM TCEP, and 10 mM CAA in 0.1 M HEPES, pH 7.5) and heated on a heat block at 95℃ for 15 min. Samples were then mixed with 200 μL of UA solution (8 M UREA in 0.1 M HEPES, pH 7.5). Next, the samples were subjected to a 30 kDa Amicon Ultracel filter (Millipore, Burlington, MA, USA) and centrifuged at 14,000 × g for 15 min.
After two buffer exchanges with UA solution, further buffer exchanges were performed with 40 mM of HEPES pH 7.5 three times. Protein digestion was performed overnight at 37℃ using a trypsin/LysC mixture at a 100:1 protein to enzyme ratio (w/w). Peptides were collected by centrifugation.
TMT 10-Plex Labeling
Before TMT labeling, the peptide concentration of each sample was measured using a tryptophan assay [26]. TMT 10-plex labeling was then performed with some modifications to the manufacturer’s protocol [24]. Peptides were labeled with TMT 10-plex reagents, such that peptides from control replicates were conjugated to tags 126, 127N, and 127C, LPS treated (45 min) replicates with tags 128N, 128C, and 129N, and LPS treated (24 h) replicates with tags 129C, 130N, and 130C, then pooled sample with tag 131. The TMT reagent that dissolved in 100% of acetonitrile (ACN) was added to 300 μg of peptide along with ACN to give a final concentration of 30% v/v. After incubation at room temperature for 1 h, the TMT-labeled samples were pooled at a 1:1:1:1:1:1:1:1:1:1 ratio. The pooled sample was dried almost
completely and desalted using a C18 solid-phase extraction (SPE) column (Waters).
High-pH Peptide Fractionation
The desalted pooled peptides were fractionated using an Agilent 1260 bioinert HPLC (Agilent, Santa Clara, CA, USA) equipped with an analytical column (4.6 mm × 250 mm, 5 μm particle) as described previously [24, 27]. High-pH peptide fractionation was performed with a 50 min gradient of 5-35% Solvent B at a flow rate of 0.2 mL/min using Solvent A (15 mm ammonium hydroxide) and Solvent B (15 mm ammonium hydroxide in 90% ACN). Totally, 96 fractions were collected every minute from 1 to 50 min. Subsequently, 96 fractions were non-contiguously pooled into 24 fractions. From each pooled fraction, we collected 5% of the fraction into an HPLC vial for global proteome analysis by LC-MS/MS [23]. For enrichment of phosphopeptide, the remaining 95% of each fraction were combined into 12 fractions.
Phosphopeptide Enrichment Using TiO2
Phosphopeptide enrichment was carried out as described in Humphrey SJ, et al. 2018 [28] with some modifications. Briefly, dried peptide fractions were resuspended using loading buffer composed of 6% (v/v) TFA and 80% ACN.
TiO2 beads (Titansphere, GL Sciences Inc., Tokyo, Japan) were subsequently added to the peptides at a ratio of 10:1 beads/protein and incubated in a thermomixer at 2000 rpm for 30 min at 40℃. After centrifugation for 1 min at 3500 × g, the supernatant (containing non-phosphopeptides) was aspirated and discarded. Beads were suspended in the wash buffer (60% ACN and 1%
TFA). Washes were performed by a centrifugation four times with 1 mL of the wash buffer. Beads that were suspended in 100 μL of the transfer buffer (60%
ACN and 0.1% TFA) were transferred to the top of a C8 StageTip, and centrifuged for 3-5 min at 3000 rpm. Phosphopeptides were eluted two times with 30 μL of the elution buffer (40% ACN and 15% ammonia solution) and collected by centrifugation into clean PCR tubes. Eluents were dried in a SpeedVac and acidified by the addition of 10% TFA. Phosphopeptides were desalted by loading onto a C18-SDB-RPS stageTip as described previously [29]. StageTips were washed with 0.2% TFA, and phosphopeptides were eluted with 60 μL of elution buffer (80% ACN and 5% NH4OH). Samples were immediately concentrated in a SpeedVac for 30 min at 45℃. Desalted peptides were resuspended in LC injection buffer (2% ACN and 0.1% formic acid) for LC-MS/MS analysis.
Mass Spectrometric Analysis and Database Search
Peptide samples were analyzed using a Q-Exactive plus mass spectrometer (Thermo Fisher Scientific, Bremen, Germany) coupled with an Easy-nLC system (Thermo Fisher Scientific, Odense, Denmark) as described previously [27]. Peptides were resuspended in 2% ACN and 0.1% formic acid and separated on a two-column system with a trap column and an analytical column (EASY-Spray column, 2 m particle size, 100 Å pore size, 75 μm id
× 50 cm length, Thermo Fisher Scientific). Peptides were separated with a linear gradient of 8-32% solvent B (80% ACN and 0.1% formic acid) over 180 min at a flow rate of 300 nL/min. Spray voltage was set to 2.1 kV. Full MS was acquired with a mass range of 350-1800 m/z at a resolution of 70,000 at
m/z 200. MS2 scans were acquired at a resolution of 35,000. The top 15 precursor mass were selected in a data dependent acquisition (DDA) mode for MS/MS fragmentation by higher-energy collisional dissociation (HCD) at 32%
normalized collision energy (NCE). The dynamic exclusion duration was set at 40 s and the isolation width was 0.7 Th with no offset. The resulting MS/MS spectra were searched against the UNIPROT human protein database (Uniprot release 2014_12, 88, 657 entries) with the SEQUEST-HT algorithm in Proteome Discoverer 2.2 (Thermo Fisher Scientific, Bremen, Germany). A maximum of two missed cleavage sites was allowed. Mass tolerances for precursor ions and fragment ions were set to 20 ppm and 0.02 Da, respectively. Carbamidomethylation of cysteine residues (+57.021 Da) and TMT tags on lysine residues and peptide N-termini (+229.163 Da) were set as fixed modification. Oxidation of methionine residues (+15.995 Da) and phosphorylation of serine, threonine, and tyrosine residues (+79.966 Da) were set as variable modifications. The false discovery rate (FDR) was determined using the percolator node. The FDR was set to 0.01 at the peptide spectral match (PSM), peptide, and protein levels. Only the PSMs that contained all ten reporter ions were considered for quantification. Proteins were quantified by summing reporter ion intensities across all matching PSMs.
Normalization was performed based on the total reporter ion intensity in each channel. The mass spectrometry proteomics data have been deposited to the ProteomeXchange Consortium via the PRIDE [30] partner repository with the dataset identifier PXD018257 (proteome) and PXD018260 (phosphoproteome).
Bioinformatics Analysis
Statistical analysis for proteomic data was performed using the Perseus software [31]. Student’s t test was employed for the proteome data set to identify statistically significant (permutation-based FDR at 5%) differences in expression at the protein levels, and for the phosphoproteome data set to identify statistically significant (p < 0.05) differences at the phosphorylation levels. For the hierarchical clustering analysis, multiple sample tests using one-way ANOVA was conducted (p < 0.05). Gene ontology (GO) annotation and pathway enrichment analysis were implemented with ClueGO plugin [32]
of Cytoscape tool. Protein quantification data were also analyzed using gene set enrichment analysis (GSEA), and shown with density plots depicting the abundance of a gene set relative to the entire dataset (https://www.gsea- msigdb.org/gsea/msigdb/collections.jsp). Protein interaction network analyses of the significantly altered proteome and phosphoproteome in RPE data sets were performed with Cytoscape (v3.7.1) [33] software using the STRING database [34].
Cell Treatments
Confluent ARPE-19 monolayer cells maintained in 24-well plates were incubated with 10 mM L(+)-Lactic acid (Sigma), in the presence or absence of 3 mM monocarboxylate transporter blocker α -CHC (Sigma) for the designated time periods. HUVECs were seeded in 24-well plates at a density of 1 × 10⁵/well. When the cells reached 60% to 70% confluence, cells were exposed to 10 mM L(+)-lactic acid with or without 3 mM α-CHC. THP-1 cells plated in 24-well plates at a density of 3 × 10⁵/well and differentiated
into the macrophages by PMA treatment were incubated with 20 mM L(+)- Lactic acid with or without 3 mM α-CHC.
Animals
Female wild-type C57BL/6J mice (Samtako Co., Gyeonggi, Korea) between 7 and 8 weeks of age were used in this study. The study protocol was approved by the Seoul National University Animal Care and Use Committee (Approval No. SNU-160114-1). All animal experiments were conducted in accordance with the guidelines of the ARVO Statement for the Use of Animals in Ophthalmic and Vision Research.
Metabolite Extraction
RPE-choroid tissues were isolated from mice and metabolite extraction was performed according to a previously described method with minor modifications [35]. Briefly, freshly isolated tissues were homogenized in 100 μL 1 M perchloric acid (PCA) solution and incubated on ice for 30 minutes.
After centrifugation at 15,871 × g for 15 minutes, 2 M KOH (0.25 μL per 1 μ L PCA) was added to the supernatant to neutralize the PCA. After centrifugation at 15,871 × g for 15 minutes again, the resulting supernatant was subsequently used for lactate measurement.
Lactate Measurement
Lactate concentration was measured using a Lactate Colorimetric/
Fluorometric Assay Kit (BioVision, Milpitas, CA, USA) according to the manufacturer’s protocol.
ECAR and OCR Measurements
The ECAR (in mpH/min) and OCR (in pmol/min) were measured using the Seahorse XF-24 metabolic extracellular flux analyzer (Seahorse Bioscience, Billerica, MA, USA). ARPE-19 cells were seeded at a density of 5 × 10⁴ cells per well in Seahorse cell plates and differentiated for 7 days. On the day of analysis, cells were washed two times with glucose free assay media (Seahorse Bioscience), and the ECAR and OCR in response to different concentrations (25, 50, and 100 μg/mL) of LPS were assessed in glucose- containing assay media. Experiments with the Seahorse system were performed according to the assay protocol consisted of repeated cycles of 2 min mixture; 2 min wait; and 4-5 min measurement. The ECAR and OCR were recorded and then calculated.
Cell Viability Assay
ARPE-19 cells were seeded 100 μL in a 96-well plate at a density of 2.5 × 10⁴ cells per well, and maintained in DMEM/F12 media with reduced serum (1%
FBS) for 7 days. The culture medium was changes every 2 days. The cells were stimulated with various concentrations of LPS for 24 h, and maintained in a humidified incubator at 37℃ in 5% CO2. On the day of analysis, 10 μL of 5 mg/mL 3-(4,5-Dimethylthiazol-2-yl)-2,5-diphenyltetrazolium bromide (MTT, Sigma) was added to each well and incubated for an additional 4 h.
After being centrifuged at 2400 rpm for 5 min, the supernatant was aspirated carefully. Then, 100 μL dimethylsulfoxide (DMSO) was added to each well and incubated for 20 min to dissolve the formazan crystals. The absorbance
was recorded at 560 nm with a microculture plate reader (Becton-Dickinson Labware, Lincoln Park, NJ, USA).
RNA Isolation and Real-Time RT-PCR
Total RNA was extracted from cells with Trizol (Invitrogen, Carlsbad, CA, USA) following the manufacturer’s instructions. RNA concentration/quality was assessed by NanoDrop spectrophotometer (NanoDrop Technology, Wilmington, DE, USA). Equal amounts of RNA were reverse transcribed into cDNA with Reverse Transcription kits (Enzynomics, Daejeon, Korea) and gene expression was determined by quantitative real-time PCR using SYBR Green PCR Master Mix (Applied Biosystems, Foster City, CA, USA) on an ABI PRISM 7900 (Applied Biosystems). The relative mRNA expressions of each sample were normalized by β-actin and RPL37A and Student’s unpaired t- test was used for statistical analysis. Sequences of primers used for amplifications were as follows: β-actin: FP, 5’-ATTGCCGACAGGATGCAGAA-3’;
RP, 5’-GCTGATCCACATCTGCTGGAA-3’. RPL37A: FP, 5’- ATTGAAATCAGCCAGCACGC-3’; RP, 5’-AGGAACCACAGTGCCAGATCC-3’. VEGFA:
FP, 5’-ATTGAAATCAGCCAGCACGC-3’; RP, 5’-AGGAACCACAGTGCCAGATCC-3’.
Laser-Induced CNV in Mice
Female C57BL/6J mice, aged 7 to 8 weeks, were anesthetized with an intraperitoneal injection of ketamine-xylazine (10 mg/kg), and the pupils were dilated with 1% tropicamide (Alcon Laboratories Inc., Fort Worth, TX, USA).
Treatment with 831-nm 106 diode laser photocoagulation (75 μm spot size, 0.1-second duration, 120 mW) was delivered to each 3, 6, 9, and 12 o’clock
position of two disc-diameters from the optic disc by using an indirect head set delivery system of a photocoagulator (OcuLight; Iridex, Mountain View, CA, USA) and a handheld +78-diopter lens. The bubbling or pop sensing with laser photocoagulation was considered to be successful rupture of Bruch’s membrane. These cases of successful rupture were included in this study. To evaluate the anti-angiogenic effect of blocking lactate uptake in macrophages, we injected 2 μL 3 mM α-CHC dissolved in PBS intravitreally 1 day after laser coagulation, when macrophages begin to infiltrate the burned area.
ELISA
ARPE-19 cells were treated with LPS for 24 h. The media was collected, centrifuged at 2500 rpm for 5 min to remove particulates, and stored at -80℃
until ELISA was performed. The protein concentration of the cells in each well was measured using bicinchoninic acid (BCA) protein assay kit (Thermo, Waltham, MA, USA) for the normalization of downstream cytokine quantification. Cytokine production from LPS-treated ARPE-19 cells was measured using the Duoset ELISA kit (R&D System, Minneapolis, MN, USA) according to the manufacturer’s instructions.
Cells were treated with lactic acid for 24 hours. The media was collected, centrifuged at 587 × g for 5 minutes to remove particulates and stored at - 80℃ until ELISA was performed.
Retina and RPE-choroid tissues were isolated from naive or CNV (3 days after laser) mice, and homogenized in ice-cold RIPA lysis buffer (Thermo Scientific) containing 1% protease inhibitor cocktail and 1% phosphatase cocktail (GenDepot). After centrifugation at 15,871 × g for 15 minutes, the
supernatant was used for ELISA assay. The secretion of VEGF was measured by use of the ELISA Duoset system (R&D Systems) according to the manufacturer’s instructions.
Western Blotting
The cells were harvested with the 1X sample buffer (Biosesang, Seongnam, GG, Korea) containing a protease inhibitor and phosphatase inhibitor cocktail (GenDepot). Then, the total cell lysates were sonicated for 30 s and heated to 100℃ for 10 min. The proteins were separated on 8% polyacrylamide gels followed by transfer onto polyvinylidene difluoride (PVDF) membranes (Merck Millipore, Burlington, MA, USA). ICAM-1 (Santa Cruz Biotechnology Inc.), HMOX-1 (Santa Cruz Biotechnology Inc.), phosphor-β-catenin (Ser552; Cell Signaling Technology, Danvers, MA, USA), β-catenin (Santa Cruz Biotechnology Inc.), and β-actin (Santa Cruz Biotechnology Inc.) were used at 1/2000 dilutions.
Immunohistochemistry
THP-1 cells differentiated with 15 ng/mL of PMA for 48 hours were treated with lactic acid for 18 hours, and fixed for 15 minutes in 4% paraformaldehyde.
After blocked in 5% FBS in PBS containing 0.3% Triton X-100 for 1 hour, cells were incubated at 4℃ overnight with the following primary antibodies:
FITC-conjugated CD68 (KP1; Santa Cruz Biotechnology, Inc.) and APC- conjugated anti-mouse VEGF (C-1, Santa Cruz Biotechnology, Inc.). The cells were rinsed and washed three times with PBS. Finally, to stain nuclei, cells were treated for 15 minutes with 3 μ M of the nuclear stain 4’,6-
diamidino-2-phenylindole (DAPI). The stained cells were observed under a Olympus FV1000 Confocal Scanning Scope. The VEGF intensity was measured using ImageJ software (http://imagej.nih.gov/ij/; provided in the public domain by the National Institutes of Health, Bethesda, MD, USA).
Three days after laser photocoagulation, eyes were enucleated from mice and fixed for 1 hour in 4% paraformaldehyde. After removal of the retina, RPE- choroid tissues were incubated with rat anti-mouse F4/80 (Bio-Rad, Richmond, CA, USA) and APC-conjugated anti-mouse VEGF (C-1; Santa Cruz Biotechnology, Inc.) at 48℃ overnight. The flat-mount was washed with PBS 10 times for 10 min on an orbital shaker at room temperature and then incubated with Alexa-Fluor 488-labeled goat anti-rat IgG (Molecular Probes) for 1 h on an orbital shaker at room temperature. The stained tissues were examined under an Olympus FV1000 Confocal Scanning Scope. The areas of infiltrated macrophage and secreted VEGF were measured using ImageJ software. Histology Fixed globes after laser induction were embedded in paraffin and processed for standard hematoxylin and eosin (H&E) staining to assess standard morphology. Stained sections were digitized using a light microscopy (Labophot; Nikon, Tokyo, Japan).
CNV Quantification
For the assessment of CNV, RPE-choroid tissues isolated from the eyes 7 days after laser were stained with Alexa-Fluor 594-conjugated isolectin B4 (Molecular Probes) to visualize CNV. Images acquired with Olympus FV1000 Confocal Scanning Scope were processed in IMARIS imaging software (Bitplane, Zurich, Switzerland) to quantify IB4-positive CNV volume.
Flow Cytometry
THP-1 cells differentiated with 15 ng/mL of PMA for 48 hours were treated with lactic acid for 18 hours. After fixed and permeabilized, cells were stained with APC-conjugated anti-mouse VEGF (C-1; Santa Cruz Biotechnology, Inc.). Labeled cells were analyzed using LSR-II cytometer (BD Biosciences, San Jose, CA, USA), and the data were analyzed using FlowJo Software (version 7.6.2; Ashland, OR, USA).
Laser-treated eyes were enucleated microsurgically 1, 3, 7, 14, and 21 days after laser treatment. After removing the anterior segment and vitreous humor, the posterior segment containing the retina and RPE-choroid was subsequently dissociated enzymatically for 1 hour with 1 mg/mL type I collagenase (Sigma) in the presence of 50 units/mL DNase I (Sigma). Single- cell suspension in PBS was washed by centrifugation at 685 × g for 5 minutes, and then cell pellets were suspended with 200 μL FACS buffer containing 1% BSA and 0.1% sodium azide. For surface staining, the following antibodies were used: Q655-conjugated anti-mouse CD45 (clone: 30-F11;
eBioscience, San Diego, CA, USA), PE-conjugated anti-mouse F4/80 (clone:
BM8; eBioscience), APC eFluor 780-conjugated anti-mouse CD11b (clone:
M1/70; eBioscience), V450-conjugated anti-mouse Gr-1 (clone: RB6-8C5;
eBioscience), FITC-conjugated anti-rat CD206 (clone: MR5D3; AbD Serotec, Raleigh, NC, USA). To detect intracellular cytokines, cells were fixed and permeabilized in BD Perm/Wash buffer (BD Pharmingen, San Diego, CA, USA) before incubation with the following antibodies: APC-conjugated anti-mouse VEGF (C-1, Santa Cruz Biotechnology, Inc.). Labeled cells were analyzed
using LSR-II cytometer (BD Biosciences), and the data were analyzed using FlowJo Software (version 7.6.2).
Tube Formation Assay
Growth factor-reduced Matrigel (Corning) was thawed at 4℃ overnight. Each well of a prechilled 24-well plate was coated with 100 μ L Matrigel and incubated at 37℃ for 40 minutes. HUVECs (3 × 10⁴ cells) were suspended in 100 μL EGM-2 media and seeded with 400 μL macrophage conditioned media. After 12 hours of incubation at 37℃ with 5% CO2, endothelial cell tube formation was visualized with Calcein AM (Corning) and then imaged using a Leica CTR6000 fluorescence microscope (Wetzlar, Germany). The number of capillary-like structures was quantified by manual counting of low-power fields (×10). Five independent fields were assessed for each well, and the average number of branches per field (magnification, ×10) was determined.
Statistical Analysis
All results are expressed as the means ± SEM and visualized using Prism version 6 (Graphpad Software, La Jolla, CA, USA). The student’s unpaired t test (two-tailed) was used to calculate statistical significance between experimental groups. p < 0.05 was defined to be statistically significant.
6.3. RESULTS
Induction of Inflammation on ARPE-19 Monolayer for Proteomic Analysis For proteomic analysis to understand the molecular mechanisms causing pathological progression in RPE, polarized monolayer culture of ARPE-19 cells was performed. The expressions of junctional protein ZO-1, visual cycle protein RPE65, and polarity protein Na+K+ATPase were identified using immunofluorescence staining (Figure 1A). To determine the concentration of LPS that could elicit both metabolic and pro-inflammatory responses in RPE, extracellular acidification rate (ECAR)/oxygen consumption rate (OCR) and inflammatory cytokine levels were assessed with different concentrations of LPS. I observed that 50 μg/mL of LPS significantly increased the ECAR and OCR after treatment and facilitated the secretion of inflammatory cytokines IL-6, TNFα, and IL-12 in ARPE-19 cells, with no morphological changes but an apparent decrease in cell viability, indicating inflammation-driven pathological progression had begun within 24 h (Figures 1B-E). In addition, ARPE-19 cells showed significant metabolic changes between 30 min and 1 h after LPS treatment, implying that important signaling cascades has been initiated between these two time points. Therefore, I decided to investigate proteome and phosphoproteome changes in 50 μg/mL LPS-treated ARPE- 19 cells to verify inflammation-driven pathology at the following time points;
at 45 min for early signal transduction events and at 24 h for late proteome changes. The 10-plex TMT isobaric labeling quantitative proteomic method with high pH reversed phase (high pH-RP) chromatography was used to identify alterations in both abundance and phosphorylation status in protein
extracts (Figure 1F). The data obtained from comparative MS analysis were processed with various bioinformatics tools.
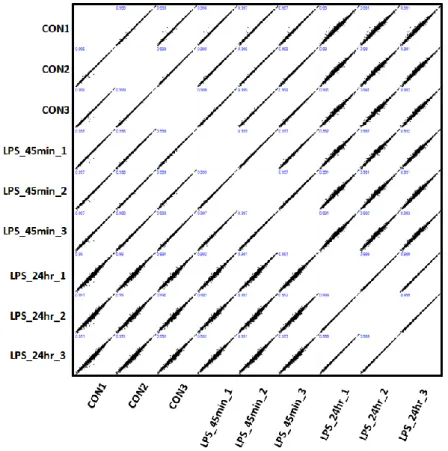
Quantitative Proteomic and Phosphoproteomic Analyses of ARPE-19 Cells The reproducibility of proteome results obtained from three biological replicates of each group was evaluated by comparing the relative protein quantification. Multi-scatter plots with Pearson’s correlation coefficients between approximately 0.991 and 0.999 demonstrated strong reproducibility between biological replicates in each experimental group (Figure 2). The principle component analysis (PCA) of the data set from both the ARPE-19 proteome and phosphoproteome also showed good clustering of the biological replicates, as well as clear separation between LPS-treated and untreated control (0 min; Figure 3A). Using a false discovery rate (FDR) of 1%, I identified 130,878 unique peptides from 8984 proteins with average sequence coverage of 31% (Figure 3B). Among the differentially expressed proteins (DEPs), a subset of 261 proteins showed more than a 1.5-fold change in abundance after LPS challenge (adjusted p < 0.05). For data sets of phosphopeptides, after internal normalization based on total amounts, they were further normalized to the corresponding protein abundance for each phosphopeptides. Analysis to examine the difference of phosphorylation status between control and LPS-treated ARPE-19 cells led to the identification of 20,632 unique phosphopeptides from 3207 phosphoproteins with 3103 phosphorylation sites (Figure 3C). Among these, 618 phosphopeptides corresponding to 466 proteins, and 2774 phosphopeptides corresponding to 1358 proteins were differentially regulated after LPS challenge for 45 min and
24 h, respectively (p < 0.05). In comparison of proteomic and phosphoproteomic data, we found that 2561 proteins overlapped between proteins and phosphoproteins (Figure 3D). Frequency distributions showed that most phosphoproteins were not significantly affected by LPS stimulus at either early or late time points as the average log2-fold changes centered around zero (Figure 3E). Distribution patterns of statistical significance (-log p values) and magnitude of change (log2 fold change) for all proteins and phosphoproteins identified at each time point were visualized using volcano plots (Figure 3F).
Functional Annotation of the Identified Proteins
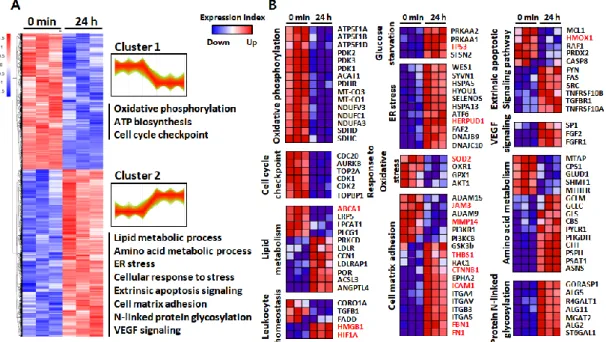
To investigate biological processes associated with inflammation-driven pathology, I performed a hierarchical clustering (HCL) analysis and gene ontology (GO) enrichment analyses. HCL analysis revealed two separate groups comprising of up- and down-regulated proteins, as compared to the untreated control (Figure 4A). The DEPs in each time point were annotated and functionally classified using the ClueGO plugin of the Cytoscape tool that can decipher GO and pathway annotation networks with a hypergeometric test and study functional correlations among pathways by the kappa coefficient calculation [36]. In contrast to the DEPs at 45 min, where few significant changes (q < 0.05) were observed except for KIAA1522, the 4192 DEPs at 24 h were grouped into multiple pathways. GO analysis of the identified proteins showed strong downregulation of proteins related to mitochondrial metabolism and the cell cycle checkpoint. In contrast, perturbations in lipid
and amino acid metabolism, and overall upregulation in cell–matrix adhesion, endoplasmic reticulum (ER) stress, and extrinsic apoptotic signaling were observed after LPS challenge (Figure 4A). The 261 proteins that showed more than a 1.5-fold change in abundance in response to LPS challenge also grouped multiple pathways including response to reactive oxygen species and DNA damage response. To obtain functional protein profiles associated with the differential expression patterns, I also conducted gene set enrichment analysis (GSEA) by ranking gene products according to a differentiability statistic (e.g., ratio of expression in LPS-treated versus control) using GSEA’s Molecular Signature Database (https://www.gsea- msigdb.org/gsea/msigdb/collections.jsp; Figure 4B). Interestingly, with significant metabolic perturbations, two important pathways regulated by the 153 up- and downregulated proteins in our study were essential for leukocyte homeostasis and the cell–matrix adhesion. In particular, the high-mobility group box 1 (HMGB1) and hypoxia-inducible factor 1α (HIF1α), known as pro-angiogenic and pro-inflammatory factors in RPE, showed increased abundance during inflammation in the RPE. Intracellular adhesion molecule 1 (ICAM-1), fibronectin-1 (FN1), fibrillin-1 (FBN1), and thrombosponin-1 (THBS1), all associated with cellular adhesion and especially known to be increased in high-risk RPE, were also upregulated. In addition to the strong downregulation of matrix metallopeptidase 14 (MMP14), a critical enzyme for maintaining the physiological balance between synthesis and disintegration of structural elements of Bruch’s membrane (BrM), junctional adhesion molecule 3 (JAM3), which regulates the recruitment of N-cadherin and ZO-1 to tight junction formation, was also decreased by inflammation (Figure 4B).
Phosphoproteome Analysis
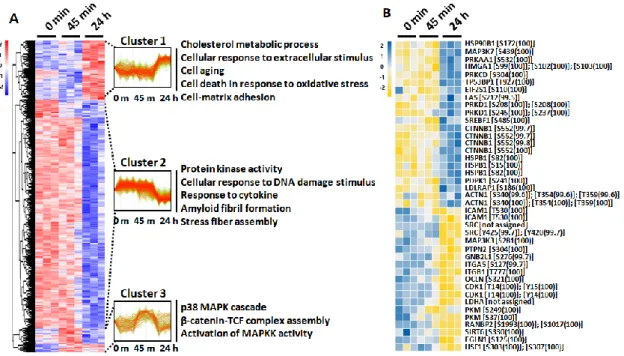
To further investigate the LPS-induced signal pathways governed by protein phosphorylation and dephosphorylation, I first performed HCL analysis using a phosphoproteome data set. Interestingly, clustering of the phosphoproteome revealed a clear segregation into three clusters, reflecting three distinct patterns of phosphorylation progression by LPS challenging (Figure 5A).
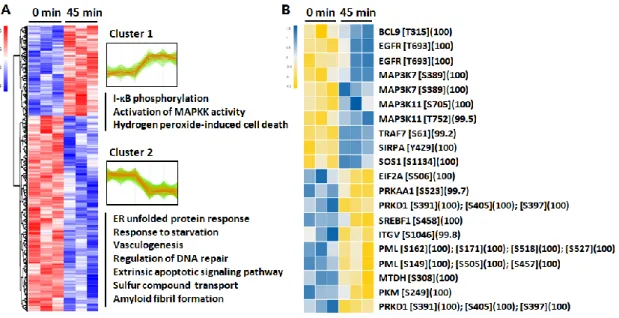
Differentially phosphorylated peptides (DPPs) of cluster 1 (449 of 2376, 18.90%), which exhibited increased phosphorylation at 24 h post-challenge, were selectively enriched for several GO terms, including cholesterol metabolic process, cell aging, cell–matrix adhesion, and cell death. DPPs of cluster 2 (1742 of 2376, 73.32%), which exhibited dephosphorylation at 24 h post-challenge, were enriched for GO terms including protein kinase activity, cellular response to DNA damage, and response to cytokine. Finally, DPPs of cluster 3 (185 of 2376, 7.79%) that exhibited phosphorylation at 45 min after LPS challenge were enriched for GO terms including the p38 MAPK cascade and β-catenin-TCF complex assembly (Figure 5A). For detailed identification of early phosphorylation events after LPS challenge, I reperformed HCL analysis using phosphoproteome data sets of 0 min and 45 min (Figure 6A). Among the two distinct clusters, DPPs of cluster 1 (196 of 618, 31.88%) that exhibited phosphorylation at 45 min after LPS challenge were also enriched for I-κB phosphorylation and cell death, whereas cluster 2 (422 of 618, 68.45%) was enriched for GO terms including ER stress and regulation of DNA repair. The significantly altered phosphorylation status of key protein components after stimulation with LPS for 45 min and 24 h was visualized using a heatmap with identified phosphosites (Figure 5B).
Interestingly, protein kinase C delta (PRKCD) involved in NF-κB activation was phosphorylated at residue Ser-304 (100%). In addition, β-catenin (CTNNB1), involved in the regulation of inflammation via crosstalk with NF- κB, was phosphorylated at residue Ser-552 (99.8%) after LPS challenge for 24 h, whereas occludin (OCLN), whose phosphorylation has been known to occur in the maintenance of tight junction integrity, was identified to be significantly dephosphorylated at residue Ser-321 (100%). The significantly altered phosphorylation status of key protein components by stimulation with LPS for 45 min was also identified with phosphosites in Figure 6B.
Protein Interaction Network of LPS-Treated ARPE-19 Cells
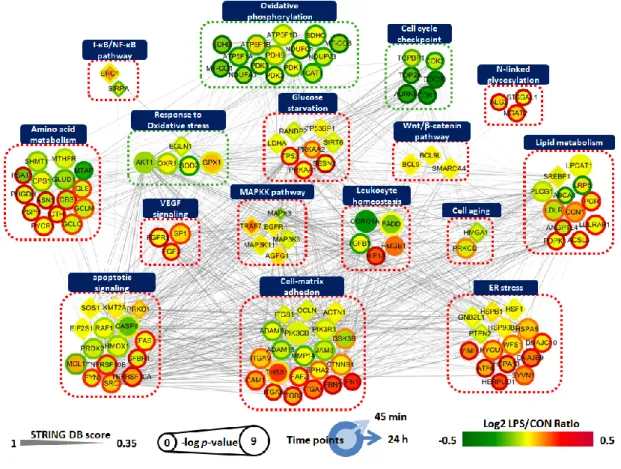
To examine the relationship between the significantly altered proteome and phosphoproteome, I constructed a protein–protein interaction (PPI) network using Cytoscape software. The separated analysis of the proteomics and phosphoproteomics datasets were depicted in one-dimensional views of cellular processes by integrating the information regarding protein abundances, activation status, and molecular interactions, with the goal of determining their complex interplay during inflammation-driven pathogenesis. In this network modeling, I focused on the 106 DEPs and 30 DPPs that were selected based on the GSEA and ClueGO database (Figure 4B, Figure 5B, Figure 6B). As shown in Figure 7, a total of 136 nodes were largely interconnected with 1094 edges, suggesting they are multifunctional and interdependent. These nodes were grouped and represented by 16 GO-biological process terms that were closely associated with RPE pathobiology.
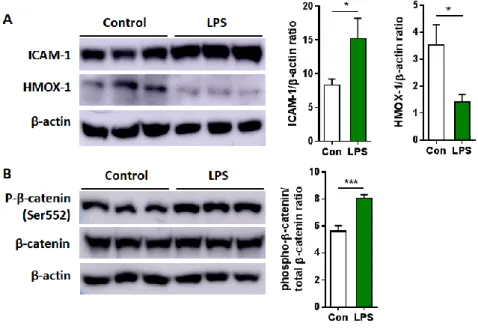
Finally, to validate our MS-based quantification of protein and phosphoprotein, I performed Western blot analysis for the two proteins (ICAM-1 and heme oxygenase-1, HMOX-1) and one phosphoprotein (β-catenin) that were involved in distinct pathways. Consistent with the proteome data, ICAM-1 was shown to be upregulated, while HMOX-1 was downregulated after LPS treatment for 24 h (Figure 8A). The phosphorylation of β-catenin at Ser- 552 residue was also identified as increased by LPS challenge for 24 h (Figure 8B). These findings indicate that the TMT labeling-based proteomic and phosphoproteomic analysis performed in this study possesses sufficient analytical power to confidently reveal changes in protein and phosphoprotein levels relevant to inflammation-driven pathology.
Elevated Lactic Acid Levels in RPE-Choroidal Region of CNV
CNV was induced by laser burn and RPE-choroid tissue was isolated for metabolite extraction (Figure 9A). CNV lesions at day 1 were stained with H&E and found to have broken RPE layers and Bruch’s membrane rupture compared with unlasered controls (Figures 9B, 9C). To evaluate the lactic acid concentration in CNV, metabolites extracted from RPE-choroid tissues were analyzed by ELISA. As shown in Figure 9D, lactic acid levels in RPE- choroid tissues were significantly increased compared with unlasered controls.
Lactic Acid Induces Macrophages to Become Pro-angiogenic
During CNV development, crosstalk of RPE with immune cells and the vascular system has been reported to be a key event in CNV development [17].
Increased production of VEGFA by cells participating in these processes has
been implicated as the main contributor to abnormal angiogenesis, and has therefore been a therapeutic target for neovascular AMD [11, 37].
Considering previous studies on the signal-inducing ability of lactic acid, we wondered whether lactic acid affects VEGF secretion by cell types in the eye.
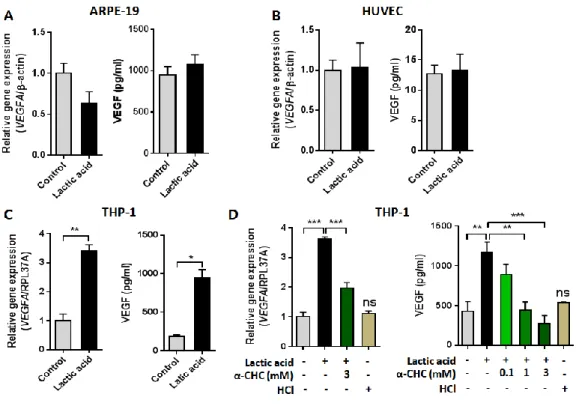
To directly study the contribution of lactic acid to the VEGF expression of RPE, endothelial cells, and infiltrated macrophages, we conducted in vitro cell line experiments using ARPE-19, HUVEC, and PMA-differentiated THP-1 macrophages. Cells were treated with 20 mM lactic acid. VEGFA mRNA and VEGFA protein expression were assessed by real-time RT-PCR and ELISA, respectively. Gene transcript and protein expression for VEGFA in ARPE-19 and HUVECs did not change after lactic acid treatment (Figures 10A, 10B);
however, PMA-differentiated THP-1 macrophages showed significant increase in VEGFA mRNA expression and peaked at 12 hours post- stimulation by more than 3-fold (Figure 10C). Secreted VEGF also significantly increased by approximately five times in THP-1 macrophages incubated with lactic acid for 24 hours, which was reduced by pretreatment of 3 mM monocarboxylate transport blocker, α-CHC (Figure 10D). This was further confirmed by analyzing VEGF content of THP-1 macrophages after incubation with lactic acid for 18 hours using flow cytometry and immunofluorescence staining technique (Figure 11). Importantly, THP-1 macrophages exposed to media acidified to pH 4.5 with HCl did not show any significant changes in VEGF expression, indicating that VEGF upregulation by lactic acid is not due to the acidification of culture media.
Then, to identify whether lactic acid–stimulated macrophages promote angiogenesis, I performed HUVEC tube formation assay. PMA-differentiated
THP-1 macrophages were stimulated with 20 mM lactic acid for 12 hours, and media was then changed. Tube-forming ability of supernatant collected after 24-hour incubation was compared with that of nonstimulated cells and α-CHC–pretreated cells. As shown in Figure 12, enhanced endothelial tube formation was observed in lactic acid–conditioned media compared with that of non-treated media, whereas supernatant of α-CHC–pretreated lactic acid–
stimulated macrophages exhibited clear reduction in the amount of tube formation of HUVECs. A 5-fold increase in number of branches formed by lactic acid–conditioned media was also substantially reduced by α-CHC and lactic acid co-treated conditioned media (Figure 12C), indicating that macrophages exposed to lactic acid are programmed to be pro-angiogenic.
Infiltration and VEGF Expression of Macrophages in CNV
To investigate the effect of lactic acid in vivo, I first assessed macrophage infiltration into CNV lesions by flow cytometric analysis. The number of recruited macrophages (CD45+CD11b+Gr1-F4/80+) increased at 1 day after laser and peaked at 3 days with an increase of more than 10-fold compared with that of nonlasered controls (Figures 13A, 13B). Intracellular VEGF content per single macrophage cell at day 3 after laser treatment was significantly upregulated compared with that of unlasered controls (Figures 13C, 13D), providing further evidence of the pro-angiogenic properties of macrophages.
Inhibitory Effect of α-CHC on Neovascularization
The effect of lactic acid on VEGF expression in macrophages and subsequent aberrant neovascularization was confirmed by intravitreal injection of monocarboxylate transporter (MCT) blocker α-CHC 1 day after CNV induction. Injection of 2 μL 3 mM α-CHC resulted in significant reduction of VEGFA contents in macrophages at 3 days after laser shot (Figures 14A, 14B). Flatmount immunofluorescence staining also showed the significant reduction of VEGF-positive area (383,738 ± 196,716 μm2) within F4/80- stained macrophage area compared with controls (523,378 ± 165,071 μm2) (Figures 14C, 14E), although the area of infiltrated macrophages showed no significant changes (Figure 14D). The VEGF levels in RPE-choroid tissues at day 3 (2120.5 ± 286.4 VEGF pg/tissue g) and isolectin B4 (IB4)-positive endothelial cells at day 7 (141,472.9 ± 49,186.4 μm3) after laser burn were both substantially reduced by α-CHC injection (1138.9 ± 109.7 VEGF pg/tissue g and 74,160.6 ± 12,339.5 μm3, respectively) (Figures 14F–H), suggesting that modulation of macrophages by blocking lactic acid transport has a promise for CNV therapeutics (Figure 15).
Figure 1. Experimental setup and workflow to investigate lipopolysaccharide (LPS)-stimulated ARPE-19 proteome and phosphoproteome. (A) Immunofluorescence images of polarized ARPE-19 cells stained for ZO-1 (red) and RPE65 (green) or Na+K+ATPase (green). Scale bar: 25 μm. (B, C) Real-time measurements of extracellular acidification rate (ECAR) and oxygen consumption rate (OCR) for assessing metabolic responses to different concentrations of LPS in ARPE-19 cells. (D) Cell viability measurement of ARPE-19 cells stimulated with different concentrations of LPS for 24 h. (E) Cytokine production of ARPE-19 cells treated with different concentrations of LPS for 24 h. Bars indicate means ± SEM. *p <
0.05, **p < 0.01, ***p < 0.001, ****p < 0.0001. (F) Pipeline for the tandem- mass tag (TMT)-based proteomic/phosphoproteomic approach to LPS- treated ARPE-19 cells.
Figure 2. Reproducibility of global proteomic quantification. Multi-scatter plot of label-free protein intensities between different replicates of the samples was depicted with the Pearson correlation coefficient values.
Figure 3. Overview of the LPS-stimulated ARPE-19 proteome and phosphoproteome. (A) Principal component analysis (PCA) of quantified proteins at total protein level and quantified phosphopeptides from three different treatment groups in triplicate. (B, C) Results of proteome/phosphoproteome experiments. (D) Venn diagram of the overlap of proteins identified in proteome profiling experiments with phosphoproteins identified in phosphoproteomic experiments. (E) Log fold-change distribution histogram comparing proteome (red) and phosphoproteome (blue) identified at two treatment time points. (F) Volcano plots from different group comparisons.
Blue dots represent p < 0.1, |log2(fold change)| > 0, purple represent p <
0.05, |log2(fold change)| > 0, and red represent p < 0.01, |log2(fold change)| > 0. Black dotted line means p-value (adjusted) threshold of 0.05 to filter the statistically significant results.
Figure 4. . Visualization of changing proteins and their biological pathways. (A) Hierarchical cluster (HCL) analysis of differentially expressed proteins upon 24 h treatment of 50 μg/ml LPS, according to their abundance profile with significantly enriched biological process gene ontology (GO) terms within clusters. (B) Heat maps of the most enriched proteins between groups that strongly contributed to pathway enrichment scores (ES) in gene set enrichment algorithm (GSEA). The unique proteins significantly altered by LPS treatment were marked in red.
Figure 5. HCL analysis of the identified phosphoproteins with differential phosphorylation intensities. (A) HCL analysis of significantly altered phosphosites upon treatment of 50 μg/mL LPS for 45 min and 24 h, according to their abundance profile, with significantly enriched biological process GO terms within clusters. (B) Heat map showing phosphorylation status of 41 phosphosites that were significantly changed among three time point measurements.
Figure 6. HCL analysis of the identified phosphoproteins with differential phosphosite intensities. (A) HCL analysis of significantly altered phosphosites upon 45 min treatment of 50 μg/ml LPS, according to their abundance profile with significantly enriched biological process GO terms within clusters.
(B) Heat map showing phosphorylation status of 16 phosphosites that were significantly changed between two time point measurements.
Figure 7. Network analysis of proteins related to inflammation-driven pathology of ARPE-19 cells. A total of 136 differentially expressed proteins and phosphoproteins involved in differentially regulated biological processes were grouped according to their function. Circle indicates DEP and diamond indicates DPP. Node colors represent an increase (red) and decrease (green) in LPS-treated ARPE-19 cells for 45 min (center) and 24 h (boundary) compared to untreated controls. The color bar represents the gradient of log2 protein ratios. The size of a node represents log10(p-value). The edges represent PPIs obtained from the STRING database [34]. Pathways with red dotted lines indicate clusters upregulated by LPS and pathways with green dotted lines indicate clusters downregulated by LPS. All are indicated by gene symbol.
Figure 8. Western blot analysis of proteins and phosphoprotein included in the pathways related to inflammation-driven pathogenesis in ARPE-19 cells.
ARPE-19 cells were challenged with 50 μg/ml LPS for 24 h. (A) Representative western blot protein bands and histograms for ICAM-1 and HMOX-1 normalized to β-actin. (B) Representative western blot protein bands and histograms of phospho-β-catenin (Ser552) normalized to total form. Bars indicate means ± SEM. *p < 0.05, ***p < 0.001.
Figure 9. Lactic acid is increased in RPE-choroid regions of CNV-induced mice.
(A) Schematic image describing CNV inducing and lactic acid measurement. (B, C) Representative retinal histology before injury (B) and 1 day after injury (C). H&E stained. n = 6. Broken RPE is marked by the asterisk. IPL, inner plexiform layer; INL, inner nuclear layer; OPL, outer plexiform layer; ONL, outer nuclear layer; PIS, photoreceptor inner segment; POS, photoreceptor outer segment. Scale bars: 50 lm. (D) Lactate concentrations of RPE-choroid regions measured by a lactate colormetric/fluorometric assay kit. n = 6. Bars indicate means ± SEM. *p < 0.05.
Figure 10. Lactic acid induces VEGF expression in macrophages. (A-C) Expression analysis by qPCR and ELISA of VEGF in ARPE-19 (A), HUVEC (B), and PMA-differentiated THP-1 macrophages (C) was conducted following incubation with control or 20 mM of lactic acid (LA)-treated medium. (D) Expression analysis of VEGF in THP-1 macrophages was conducted following incubation with lactic acid ± MCT blocker α-CHC and acidic pH necessary for the effect of lactic acid. Data are representative of three independent experiments. Bars indicate means ± SEM. *p < 0.05, **p <
0.01, ***p < 0.001.
Figure 11. Lactic acid enhances VEGF expression in THP-1 macrophages. (A, B) FACS analysis of PMA-differentiated THP-1 macrophages following stimulation of 20 mM lactic acid for 18 h was conducted. Representative histogram (A) and MFI values (B) are shown (n=3 per group). Bars indicate means ± SEM. *p < 0.05 (C) Representative images of immunofluorescence staining of DAPI (blue), CD68 (green), and VEGF (red) in THP-1 macrophages following 20 mM lactic acid treatment are shown (n=3 per group). Scale bar = 50 μm.
Figure 12. Lactic acid-stimulated THP-1 macrophages facilitate angiogenesis.
(A) Schematic image describing tube formation assay. HUVECs were seeded onto Matrigel-coated plates with control THP-1 supernatant, lactic acid- stimulated THP-1 supernatant in the presence or absence of α-CHC. (B) Representative images of capillary-like structures stained with Calcein AM are shown. (C) Total branching points were calculated using ImageJ software.
Data are representative of three independent experiments. Bars indicate means ± SEM. ***p < 0.001. Scale bar = 100 μm.
Figure 13. Macrophage infiltration and their VEGF secretion are increased in RPE-choroid regions in CNV mice. (A, B) Posterior eyecups of mice after induction of CNV were enzymatically dissociated and analyzed by flow cytometry for macrophage markers (A). The percentages of macrophages infiltrating the eye are shown (n = 5 per group) (B). (C, D) VEGF expression by macrophages at 3 days after laser was analyzed by flow cytometry.
Representative histograms are shown (n = 5 per group) (C). Percentage of VEGF MFI was calculated in the indicated populations (D). Bars indicate means ± SEM. *p < 0.05, **p < 0.01, ***p < 0.001.