저작자표시-비영리-변경금지 2.0 대한민국 이용자는 아래의 조건을 따르는 경우에 한하여 자유롭게
l 이 저작물을 복제, 배포, 전송, 전시, 공연 및 방송할 수 있습니다. 다음과 같은 조건을 따라야 합니다:
l 귀하는, 이 저작물의 재이용이나 배포의 경우, 이 저작물에 적용된 이용허락조건 을 명확하게 나타내어야 합니다.
l 저작권자로부터 별도의 허가를 받으면 이러한 조건들은 적용되지 않습니다.
저작권법에 따른 이용자의 권리는 위의 내용에 의하여 영향을 받지 않습니다. 이것은 이용허락규약(Legal Code)을 이해하기 쉽게 요약한 것입니다.
Disclaimer
저작자표시. 귀하는 원저작자를 표시하여야 합니다.
비영리. 귀하는 이 저작물을 영리 목적으로 이용할 수 없습니다.
변경금지. 귀하는 이 저작물을 개작, 변형 또는 가공할 수 없습니다.
이학석사 학위논문
간암의 방사선 치료에 의한 exosome의 분비 조절 및 exosomal miRNA 기능연구
Research on exosome secretion and exosomal miRNA function by radiotherapy in hepatocellular carcinoma
울산대학교 대학원 의 과 학 과
이 승 민
[UCI]I804:48009-200000505108 [UCI]I804:48009-200000505108
Research on exosome secretion and exosomal miRNA function by radiotherapy in hepatocellular
carcinoma
지 도 교 수 하 창 훈
이 논문을 이학석사학위 논문으로 제출함
2021년 8월
울산대학교 대학원 의 과 학 과
이 승 민
이승민의 이학석사학위 논문을 인준함
심사위원 노 진 경 (인)
심사위원 백 찬 기 (인)
심사위원 하 창 훈 (인)
울 산 대 학 교 대 학 원
2021년 8월
i
Abstract
Tumor-derived exosomal microRNAs are key elements of the cell-cell communications response to lots of stimuli. However, various functions of the exosome in tumor suppression by radiotherapy (RT) are not clearly understood. Our study showed a previously unknown interaction of p53 and histone deacetylase 5 (HDAC5) by radiation exposure in hepatocellular carcinoma (HCC). HDAC5 and p53 interacted by exposure to radiation, which increased exosome release and altered microRNAs' composition within exosomes. Also, we have described the intercommunication occurring between irradiated and untreated cells via exosomal microRNAs that affect tumor proliferation. In particular, the expression of exosomal microRNA 151a-3p (miR-151a-3p) was markedly reduced by radiation treatment. We confirmed that inhibition of exosomal miR-151a-3p promotes suppression of non-irradiated cancer cells, thereby increasing RT sensitivity. In conclusion, our present findings demonstrated HDAC5 is a key component of the p53-mediated release of exosomes resulting in tumor suppression through exosomal miR-151a-3p in response to radiation. Finally, we highlight the important role of exosomal miR-151a-3p as a biomarker in enhancing RT sensitivity.
Key Words: Exosome; microRNA; HDAC5; p53; radiotherapy; hepatocellular carcinoma
ii
Contents
Abstract··· i
List of figures··· iii
Introduction··· 1
Materials and methods ··· 4
Results ··· 12
1. Modulation of p53 and HDAC5 by RT.--- 12
2. Intercommunication between p53 and HDAC5 by RT resulting in increasing the expression of TSAP6, exosome modulating protein. --- 16
3. Exosome secretion in a p53-dependent manner by RT. --- 19
4. Alteration of exosomal miRNA’s expressions by RT in HCC. --- 22
5. Radioresistance increased by miR-151a-3p. --- 27
6. EMT-like phenotype activation and tumor progression via miR-151a-3p.--- 30
7. Modulation of tumor growth by miR-151a-3p in the invivo xenograft model.--- 33
Discussion··· 37
Conclusion ··· 41
References ··· 42
국문요약··· 45
iii
List of Figures
Figure 1. Modulation of protein p53 and HDAC5 expression by radiation exposure in hepatocellular carcinoma. ∙∙∙∙∙∙∙∙∙∙∙∙∙∙∙∙∙∙∙∙∙∙∙∙∙∙∙∙∙∙∙∙∙∙∙∙∙∙∙∙∙∙∙∙∙∙∙∙∙∙∙∙∙∙∙∙∙∙∙∙∙∙∙∙∙∙∙∙∙∙∙∙∙∙∙∙∙∙∙∙∙∙∙∙∙∙∙∙∙∙∙∙∙∙∙∙∙∙∙∙∙∙∙14
Figure 2. Interaction of HDAC5 and p53 by radiation exposure in HepG2 cells, and characterization of the exosome secretion pathway and the released exosomes that are altered by this union. ∙∙∙∙∙∙∙∙∙∙∙∙∙∙∙∙∙∙∙∙∙∙∙∙∙∙∙∙∙∙∙∙∙∙∙∙∙∙∙∙∙∙∙∙∙∙∙∙∙∙∙∙∙∙∙∙∙∙∙∙∙∙∙∙∙∙∙∙∙∙∙∙∙∙∙∙∙∙∙∙∙∙∙∙∙∙∙∙∙∙∙∙∙∙∙∙∙∙∙∙∙∙∙∙∙∙∙∙∙∙∙∙∙∙∙∙∙∙∙∙∙∙∙17
Figure 3. Time-dependent measurement and identification of the difference in exosome size and release amount determined by the p53 gene in liver cancer cells. ∙∙∙∙∙∙∙∙∙∙∙∙∙∙∙∙∙∙∙∙∙∙∙∙∙∙∙∙∙∙∙∙∙∙∙∙∙21
Figure 4. The expression analysis of exosomal miRNAs altered by irradiation in liver cancer cells and the clinical meaning exploration and identification of candidates using bioinformatics analysis. ∙∙∙∙∙∙∙∙∙∙∙∙∙∙∙∙∙∙∙∙∙∙∙∙∙∙∙∙∙∙∙∙∙∙∙∙∙∙∙∙∙∙∙∙∙∙∙∙∙∙∙∙∙∙∙∙∙∙∙∙∙∙∙∙∙∙∙∙∙∙∙∙∙∙∙∙∙∙∙∙∙∙∙∙∙∙∙∙∙∙∙∙∙∙∙∙∙∙∙∙∙∙∙∙∙∙∙∙∙∙∙∙∙∙∙∙∙∙∙∙∙∙∙∙∙∙∙∙∙∙24
Figure 5. Cell dysfunction according to radiation exposure is regulated by miR151a-3p. ∙∙∙∙∙∙∙28
Figure 6. The ability of miRNA151a-3p to tumorigenesis. ∙∙∙∙∙∙∙∙∙∙∙∙∙∙∙∙∙∙∙∙∙∙∙∙∙∙∙∙∙∙∙∙∙∙∙∙∙∙∙∙∙∙∙∙∙∙∙∙∙∙∙∙31
Figure 7. Increased tumor progression in a nude mice subcutaneous tumor transplant model overexpressing miRNA 151a-3p.∙∙∙∙∙∙∙∙∙∙∙∙∙∙∙∙∙∙∙∙∙∙∙∙∙∙∙∙∙∙∙∙∙∙∙∙∙∙∙∙∙∙∙∙∙∙∙∙∙∙∙∙∙∙∙∙∙∙∙∙∙∙∙∙∙∙∙∙∙∙∙∙∙∙∙∙∙∙∙∙∙∙∙∙∙∙∙∙∙∙∙∙∙34
Figure 8. A schematic image of Radiation-induced exosomal miRNA-151a-3p restrain hepatocellular carcinoma progression. ∙∙∙∙∙∙∙∙∙∙∙∙∙∙∙∙∙∙∙∙∙∙∙∙∙∙∙∙∙∙∙∙∙∙∙∙∙∙∙∙∙∙∙∙∙∙∙∙∙∙∙∙∙∙∙∙∙∙∙∙∙∙∙∙∙∙∙∙∙∙∙∙∙∙∙∙∙∙∙∙∙∙∙∙36
1
Introduction
The Exosomes are extracellular vesicles of 30-150 nm in size that are released outside of the cell, which structurally constitutes a phospholipid bilayer membrane, so there is no possibility of being broken down by various enzymes in the body. Cancer cells secrete 10 times more exosomes than normal cells, and include growth factors, chemokines, miRNAs, etc. inside exosomes to regulate the microenvironment around cancer, and promote the growth and communication of cancer cells1, 2. The exosomes released from cancer cells are absorbed by neighboring cells or distant cells and can modulate the functions of properties such as invasion and metastasis of cancer cells, angiogenesis, and drug resistance, and adversely affect the overall tumor microenvironment. 3Recent studies on miRNA contained within exosome have been actively conducted 4, 5. After release, tumor-derived exosomal microRNAs (miRNAs) regulate such functions as retaining tumor growth, invasion, metastasis and therapy-resistance in tumor cells through cell-cell communication within the tumor derived exosome. Therefore, exosomal miRNAs have an essential function to mediate tumor progression and can likely be applied as a promising biomarker in the diagnosis and prediction of cancer6 3. Post-release tumor-derived exosomal miRNA has the ability to maintain tumor growth, invasion, metastasis and resistance to treatment through cell-cell communication within cancer cells. Adjust.
Tumor-derived exosomes. Therefore, exosomal miRNAs have essential functions to mediate cancer progression and can be applied as promising biomarkers for cancer diagnosis and prediction.
p53 is a tumor suppressor that is very important in cancer and regulates cell-cycle control, aging, apoptosis, and genomic stability in response to various external stresses. Lately, it has been shown that different stresses trigger different dynamic patterns of p53 levels. In response to DNA breakage caused by γ-irradiation, the p53 level represents a series of pulses with a fixed amplitude and frequency. These pulses of p53 levels determine cell fate as a role leading
2
to cell cycle arrest and death 7, 8. Recent studies have shown that p53 modification is temporarily regulated by histone deacetylase 5 (HDAC5)9. It is believed that various post- translational modifications of p53 play an important role in determining p53 promoter specificity toward its various target gene sets. During post-translational modifications, Acetylation of p53 at lysine 120 of the DNA binding domain has been associated with p53- mediated apoptosis 10. Further, p53 is activated by various stimuli and transmits signals downstream. Among them, Tumor Suppressor-Activated Pathway Protein 6 (TSAP6) is known to be activated downstream of p53 and increases the release of exosomes. TSAP6 is a direct downstream transcriptional target gene of p53 and is essentially involved in the secretion of exosomes. So, exosomes can be regulated by the p53 response 11, 12.
Histone acetylation/deacetylation plays a critical role in the regulation of gene expression 13
14. In particular, HDAC5, One of class II HDACs, has been implicated in modulating interactions with various transcriptional cofactors and confers responsiveness to gene expressions. Previous studies have shown that tumor suppressor p53 is activated by DNA damage that causes genotoxicity, and as a temporary regulator, HDAC5 interacts with p53 and HDAC5 in the early stages of stress, thereby deacetylating p53. The pro-apoptotic target gene, modulated by p53, is transactivated by k120 deacetylation of p53 by HDAC5, which determines the fate of the cell as a regulator of p53 modification9, 15. However, little is known about the role of HDAC5 in response to radiation therapy in tumor.
Radiotherapy (RT) is one of the most commonly used therapeutic methods that can suppress the proliferation of cancer cells. Radiation is short-wave energy that can directly damage the DNA in cells. About half of cancer patients receive radiation therapy. Radiation therapy has the advantage of being able to further increase the effectiveness of treatment in combination with chemotherapy and surgery. However, there may be some side effects that reduce sensitivity to RT and become radiation resistant. Lately, radiation treatment technology has
3
been rapidly developed. In recent years, the goal of RT is to improve the quality of life of patients by reducing the side effects of treatment. In particular, in hepatocellular carcinoma (HCC), RT has become a key treatment that prevents the progression of cancer and helps surgical treatment. RT is the most effective treatment for local tumor metastasis in patients who potentially need liver resection or transplantation16, 17.
Here, we showed our findings regarding tumor-derived exosomes, including the miRNA delivering mechanism. We then described the interactions that occur between irradiated and untreated cells via exosomal miRNAs that affect tumor proliferation. HDAC5 and p53 interacted by exposure to radiation, the effect of which increased exosome release and altered the composition of miRNAs within exosomes. In particular, the expression of exosomal miRNA 151a-3p was decreased, which is the result of irradiation. As a result of the experiment, miRNA 151a-3p overexpression caused cancer progression, anti-apoptosis and anti-cell cycle arrest effects, resulting in increased radioresistance. We highlight that inhibition of miRNA 151a-3p is a potential biomarker that can increase the sensitivity of RT.
4
Materials and Methods
Cell culture, X-Radiation treatment
HepG2, SK-Hep1 was purchased from the American Type Culture Collection (Rockville, MD) (ATCC HTB-177). Hep3B was purchased by Korea Cellular Bank (seoul, Korea). It was cultured in DMEM (Corning) with 10% fetal bovine serum, 4.5 g/L glucose, L-glutamine, sodium pyruvate, and 100 U/mL of penicillin and streptomycin, and maintained at 37°C in a humidified chamber containing 5% CO2. Radiation was exposed with 2Gray, 4Gray a using X-RAD320 (1Gray/min at 320KV, 12.5mA, 50cm SSD (HVL≈ 4mm Cu)) equipment.
Exosome purification
Radiation and non-radiation exosomes purified using ultracentrifugation methods. 1 × 10⁶ cells were seeded in 100 mm dishes and allowed to recover for overnight. Then, the cells were washed twice with pre-warmed PBS, and the culture medium was replaced with exosome-free medium supplemented with 5% exosome-depleted FBS (SBI). The Radiation exosome is treated 4Gray Radiation using X-RAD 320 (1Gray/min at 320KV, 12.5mA, 50cm SSD (HVL≈
4mm Cu)) equipment. The medium was gathered and subjected to gradient centrifugation.
Briefly, the medium was first centrifuged at 1000g for 10 min, at 3000g for 30 min, then centrifuged in a Beckman Coulter Optima™ L-XP Ultracentrifuge System at 100,000 gavg at 4 for 90 minutes with a SW 28 Swinging-Bucket Rotor (k-factor: 71) to pellet exosomes.
The supernatant was carefully removed, and crude exosome-containing pellets were resuspended in 1 mL of ice-cold PBS and pooled. A second round of ultracentrifugation [100,000 gavg at 4 for 90 minutes with a Type SW 28 Swinging-Bucket Rotor (k-factor: 71)]
was carried out, and the resulting exosome pellet resuspended in 500 μl of PBS. 16
Western blot analysis
The cells were collected, washed with PBS, and lysed in lysis buffer containing protease
5
inhibitors (GenDEPOT, USA). After determining the protein concentration with a Bradford Protein Assay Reagent (Bio-Rad), equal amounts of protein were separated on 10% SDS- PAGE, electrically transferred to nitrocellulose membrane, and blocked with 5% skim milk and 5% BSA. The membranes were incubated with anti-HDAC5 (1:1000; Cell Signaling Technology, USA), anti-p53 (1:2000; Santacruz, USA), anti-p21 (1:2000; Cell Signaling Technology), anti-Puma (1:2000; Cell Signaling Technology), anti-STEAP3 (1:1000;
Proteintech, USA), anti-Maspin (1:1000; Cell Signaling Technology), anti-CD63 (1:1000;
Santacruz), anti- CD81 (1:1000; Santacruz), anti-HSP90 (1:1000; BD bioscience), anti-BCL2 (1:1000; Cell Signaling Technology), anti-E-cadherin (1:1000; Agilent Dako), anti-Twist1 (1:1000; abcam), N-cadherin (1:1000; Cell Signaling Technology), Vimentin (1:1000;
Calbiochem) or anti-beta-actin (1:1000; Santacruz) primary antibody overnight shaking at 4 °C. After washing twice, the membranes were then incubated with horseradish peroxidase (HRP)-conjugated anti-rabbit and anti-mouse secondary antibody (Jackson ImmunoResearch Inc. USA) at room temperature for 1 hour. Finally, the membranes were incubated with WESTSAVE-UP western blotting substrate (Youngin frontier, Korea), and images were visualized using ChemiDoc imaging system (Bio-Rad, USA) and recorded.
Duolink proximity ligation assay (PLA)
The DuoLink® In Situ Red Starter Kit Mouse/Rabbit (DUO92101, Sigma-Aldrich, Darmstadt, Germany) was used to detect interacting target proteins. Cells were seeded in eight-well chamber removable slides (ibidi GmbH Am Klopferspitz, Germany) and cultured 24hours.
Then, HepG2 cells were exposed to 4 g of radiation, and after 12 hours, the slides were washed with cold 1xPBS and fixed in 4% paraformaldehyde for 30 minutes. Then slides were blocked with Duolink Blocking Solution in a pre-heated humidified chamber for 30 min at 37°C. The primary antibody to detect HDAC5 and p53 was added to the slides and incubated overnight at 4°C. Then slides were washed with 1×Wash Buffer A and subsequently incubated with the two PLA probes (1:5 diluted in antibody diluents) for 1 h, then the Ligation-Ligase solution
6
for 30 min, and the Amplification-Polymerase solution for 100 min in a pre-heated humidified chamber at 37°C. Before imaging, slides were washed with 1×Wash Buffer B and mounted with a cover slip using Duolink In Situ Mounting Medium with DAPI. Fluorescence images were acquired using a zeiss LSM 780 confocal microscope.
Transmission electron microscopy (TEM)
In order to photograph exosomes, 0.1M of exosome pellets were fixed in 2.5% glutaraldehyde in 0.1 M cacodylate solution (pH 7.0) for 1 hour and then fixed in 2% osmium tetroxide for another hour. (4°C) After dehydration using the graded acetone series, embedding was performed through Spurr's medium (Electron Microscopy Sciences). The resulting section sample was cut at 60 nm with an ultramicrotome (RMC MTXL, USA), followed by double staining using 2% uranyl acetate for 20 minutes and citrate for 10 minutes. Prepared sections were photographed at 80 kV using Hitachi H-7600 TEM (Hitachi, Japan) equipment.
Exosome size distribution and concentration measurement.
To determine exosome size distribution and concentration, nanoparticle tracking-based analyses were performed using a NanoSight (NS500) apparatus (Malvern Instruments Ltd.).
Samples were diluted to provide counts within the linear range of the instrument. The videos of 1-minute duration were recorded for each sample, with a frame rate of 30 frames per second.
Particle movement was analyzed by NTA software (NTA 2.3; NanoSight Ltd.) according to the manufacturer's protocol. The NTA software was optimized to first identify and then track each particle on a frame-by-frame basis. 18, 19
Small RNA sequencing RNA isolation
HepG2-derived Exosomal small RNA was extracted using a miRNeasy Mini Kit (Qiagen Korea Ltd.) according to the manufacturer’s instructions. RNA quality was assessed by Agilent 2100 bioanalyzer using the RNA 6000 Pico Chip (Agilent Technologies, Amstelveen, The
7
Netherlands), and RNA quantification was performed using a NanoDrop 2000 Spectrophotometer system (Thermo Fisher Scientific, Waltham, MA, USA).
Library preparation and sequencing
For control and radiation induced HepG2-drived exosomal small RNAs, the construction of the library was performed using NEBNext Multiplex Small RNA Library Prep kit (New England BioLabs, Inc., USA) according to the manufacturer’s instructions. Briefly, for library construction, total RNA from each samples were used 1ug to ligate the adaptors and then cDNA was synthesized using reverse-transcriptase with adaptor-specific primers. PCR was performed for library amplification and libraries were carried out clean-up using QIAquick PCR Purification Kit (Quaigen, Inc, German) and AMPure XP beads (Beckmancoulter, Inc., USA). The yield and size distribution of the small RNA libraries were assessed by the Agilent 2100 Bioanalyzer instrument for the High-sensitivity DNA Assay (Agilent Technologies, Inc., USA). High-throughput sequences were produced by NextSeq500 system as way of single- end 75 sequencing (Illumina, SanDiego, CA., USA).
Data analysis
Sequence reads were mapped by bowtie2 software tool in order to obtain bam file. Mature miRNA sequence is used as a reference for mapping. Read counts mapped on mature miRNA sequence were extracted from the alignment file using bedtools v2.25.0 (Quinlan AR, 2010) and Bioconductor 20 that uses R statistical programming language (R development Core Team, 2016). Read counts were used in order to determine the expression level of miRNAs. Quantile normalization method was used for comparison between samples. For miRNA target study, miRWalk 2.0 21 was performed. Functional gene classification was performed by DIANA 22.
Exosomal small RNA sequencing arrays were prepared, hybridized, and scanned at the local authorized Illumina array service provider (Ebiogen, Seoul, South Korea).
8
TCGA(The Cancer Genome Atlas) and GEO(Gene Expression Omnibus) Database analysis
The two gene expression profiling data sets (GSE74618, GSE147889) we analyzed were downloaded from the NCBI GEO database.23 The GSE74618 database consists of 218 human HCC tumours samples, 10 adjacent cirrhotic non-tumoral tissue samples, and 10 healthy liver samples. We used adjacent cirrhotic non-tumoral tissue samples and healthy liver samples as controls and compared them with human HCC tumours samples. The GSE1477889 database consists of 97 samples of HCC tumours and 97 samples of the same patient's surrounding chronic hepatitis tissue. Surrounding chronic hepatitis tissue was used as a control and compared with HCC tumour samples. Two data sets were analyzed as volcano plots and mean difference plots, respectively, using the GEO2R analysis tool. TCGA (The Cancer Genome Atlas) data analysis was performed using oncomiR (WashU Pan-Cancer miRNome Atlas) online bioinformatics tool.24 Among the TCGA data, the analysis was conducted using the LIHC (Liver Hepatocellular Carcinoma) database (n=366), and the days' survival rate graph of liver cancer patients was exhibited.
Kyoto encyclopedia of genes and genomes (KEGG) pathway enrichment analyses KEGG is a database that contains genetic information on the human genome, biological cell signalling pathways, and various diseases and chemicals. The KEGG pathway analysis of exosomal miRNA was analyzed using the DIANA-miRPath v3.0 analysis tool. DIANA- miRPath v3.0 is a KEGG-based miRNA pathway prediction tool that actively interacts with the major miRNA analysis tools, DIANA-microT CDS and TargetScan v6.2 database, to analyze the target pathway.22
miRNA Transfection
Cells were seeded in 6-well plates at 1 × 10⁵ cells/mL/well before the transfection and radiation. On the following day, After HepG2 cells were exposed 4gy of radiation using X-
9
RAD 320 and transfection was performed when the cells had reached approximately 80%
confluence. miRCURY LNA miR-151a-3p mimic (miRCURY LNA miRNA Mimic, MIMAT0000757) were purchased from QiAGEN (Qiagen Korea Ltd.). And scrambled miRNA control were purchased from BIONEER (Seoul, Korea). The final concentrations of miRNA were 50-100nM Transfections were conducted with Lipofectamine 3000 (Invitrogen) according to the manufacturer’s instructions.
Quantitative real time reverse transcription polymerase chain reaction(qRT-PCR) Total RNA was extracted using a miRNeasy Mini Kit (Qiagen Korea Ltd.) in the manufacturers' protocols. For the quantification of matured cellular and exosomal miRNAs, the extracted total RNA was polyadenylated with a poly(A) tailing kit (Ambion, Austin, TX) prior to reverse transcription. And was reverse transcribed to cDNA using PrimeScript™
Reverse Transcriptase (Takara Bio Inc.). The cDNA samples were used for quantitative RT- PCR analysis in triplicate to determine the expression levels of miR-151a-3p using a TB Green® Premix Ex Taq™ (Takara Bio Inc.) and CFX96 Detection System real-time PCR instrument.
Proliferation assay
The cell proliferation assay was performed using the Chromo-CK Cell Viability Assay KIT (monobio seoul, korea) according to the manufacturer’s instructions. Transfected cells were harvested at the designated times after seeding. Briefly, the reagent (10 μl/well) was added to 100 μl of medium containing cells in each well of a 96-well plate and incubated for 1 hours at 37 under humidified 5% CO2 in air. For colorimetric analysis, absorbance at 450 nm was recorded using an ELx800 Absorbance Microplate Reader (SpectraMax 340PC Microplate Reader, Molecular Devices, USA). Each experiment was repeated at least 3 times.
Migration invasion assay
Tumor cell migration and invasion were analyzed in 24-well plates with 8-μm pore size
10
polycarbonate membranes (BD, NJ, USA). For invasion assays, the membranes were coated with diluted Matrigel (BD, NJ, USA) to form matrix barriers. HepG2 were transfected with 151a-3p or negative control. For the migration and invasion assays, the cells (5×10^4 for migration, 1×10^5 for invasion) were resuspended in 200μl of serum-free DMEM at 24 hours post-transfection and added to the upper compartments of the chambers, and the lower compartments were filled with 600μl of DMEM with 10% FBS (different substrates were added accordingly). After incubation at 37°C for 10 hours (migration) or 24 hours (invasion), the cells remaining on the upper surfaces of the membrane were removed. The cells on the lower surfaces of the membrane were fixed, stained with crystal violet and counted under a light microscope. Each experiment was repeated at least 3 times.
Analysis of cell cycle
The Transfected cells were collected and resuspended after radiation exposure. Annexin V- fluorescein isothiocyanate (FITC) and propidium iodide (PI) staining assays were conducted to detect the percentage of apoptotic (FITC-stained) and necrotic (PI-stained) cells in a given population. Analyses were performed by a FACS canto flow cytometer (BD Biosciences, Franklin Lakes, NJ, USA) according to the manufacturer’s instructions. The procedures were repeated in triplicate. 25
Analysis of cell apoptosis
The Transfected cells were collected and resuspended with cold PBS after radiation exposure.
And fixed in cold 70% ethanol added dropwise to the cell pellet while vortexing. Stored at - 20 for overnight. Cells were rehydrated with PBS for 10 min at RT and then cells were stained with propidium iodide (PI) staining solution contained with 50 μg/ml PI (BD Biosciences, Franklin Lakes, NJ, USA), 100 μg/ml RNase A, DNase and protease-free (Thermo Scientific) in 1X binding buffer. Analyses were performed by a FACS canto flow cytometer (BD Biosciences, Franklin Lakes, NJ, USA) according to the manufacturer’s
11 instructions. The procedures were repeated in triplicate.
Subcutaneous tumor xenograft models
BALB/c nude mice (5-week old male) were purchased from the Charles River Laboratories, Inc (Wilmington, Massachusetts). The fodder was feed to the normal rodent laboratory animal feed. 5x10^6 HepG2 cells in total volume 100ul were injected into the right flank of a 5-week- old nude mouse in a 1:1 ratio with Matrigel (corning 356234). After the average of the transplanted solid cancer size increased by more than 100 mm3, the invivo-jetPEI/target miRNA complex was treated. invivo-jetPEI was used as an efficient carrier for delivering miRNA and was mixed with 5% glucose solution at a ratio of miRNA 10ug / invivo-jetPEI 1.2ul and treated in a total dose of 100 ul. The invivo-jetPEI/target miRNA complex was administered 3 times every 3 days by intratumoral injection. Tumor size was measured using a standard ABS digimatic caliper (CD-15AX) every 3 days after transplantation. Tumor volume was measured using the following formula: ∏ x 4/3 x larger diameter x smaller diameter square. At the time when the volume of the largest tumor of the implanted nude mice in the experimental group exceeded 1000 mm3, the tumor was separated after sacrifice, the weight of the tumor was measured, and expression of the target protein in cancer tissue was analyzed.
Statistical analysis
Each experiment in our study was repeated three times. Mathematical data are expressed as mean ± d. Unless indicated, the differences between two groups were analyzed using a Student's t-test (two-tailed). Unless otherwise noted, significant numerical differences between the two groups were analyzed using Student's t-test (two-tailed). The overall survival curve was graphed using the Kaplan-Meier method and compared through the log-rank test.
Differences were evaluated statistically significant at P< 0.05. All statistical analysis was performed using SPSS13.0 software (SPSS, Chicago, IL, USA).
12
Result
1. Modulation of p53 and HDAC5 by RT
An experiment was conducted to verify that protein p53 and HDAC5 were modulated by radiation in HCC. Radiation doses were treated in 2gy and 4gy using radiation equipment X- RAD 320 to observe the expression of HDAC5 and p53 when radiation was treated in three types of hepatic cancer cells. The interaction of HDAC5 and p53 by DNA damage has been previously described9. However, the interaction of HDAC5 and p53 in HCC by radiation is not yet known. HepG2 and SK-Hep1 are p53 wild types (p53+/+) and Hep3B are p53 deletion types (p53-/-). The amount of expression of each protein was measured through the Western Blot in order of 6 hours, 12 hours, 18 hours, and 24 hours (Figure. 1A-F). In HepG2, the expressions of HDAC5 and p53 were significantly increased from 6 hours compared to the control group by radiation 2gy and 4gy. Later, at 2gy of radiation, HDAC5 showed a time- dependent decrease again. However, HDAC5 and p53 were significantly increased in radiation 4gy regardless of time. This shows that the expression of HDAC5 and p53 and its downstream is regulated by irradiation in HepG2 (Figure. 1A,B). SK-Hep1 increased the expression of HDAC5 24 hours after 2gy irradiation. However, in 4gy, it was reduced compared to the control group. p53 and its downstream showed a significant increase by irradiation, but HDAC5 did not show a significant expression pattern (Figure. 1C, D). Finally, Hep3B showed an independent increase in HDAC5 expression without p53 after irradiation. As a result, it was confirmed that among p53 and HDAC5 increased by irradiation, HDAC5 independently increased protein expression (Figure. 1E, F).
Subsequent experiments were conducted on HepG2, which showed the most significant change by RT among the three liver cancer cells. To check the relationship between HDAC5 and p53, a HepG2 cell line that p53-/- was created using the CRISPER CAS9 system. The
13
target site of Human p53: TGTAACAGTTCCTGCATGGG was investigated by the NGS method. The insertion/deletion frequency was 99.98% (T insertion:19.9%, CCTG deletion:18.8%, AT insertion:19.5%), and the elimination of the p53 gene was confirmed to be close to perfection. The radiation was exposed for p53+/+, p53-/-cells and measured the protein expression of HDAC5 and p53, p21, Puma with western blot. The expression of p53, p21 did not almost appear because p53 was deleted. Regardless of p53 identified an increase in the expression of HDAC5. As a result, it was confirmed that the expression of HDAC5 was increased by irradiation regardless of the expression of p53 in cells, which showed the most significant expression by irradiation, and the relationship between HDAC5 and p53 was identified (Figure. 1G, H). Using FACS equipment, it was confirmed that cell cycle arrest and apoptosis are induced in p53+/+, p53-/-cells by radiation treatment. In p53+/+cell, powerful cell cycle arrest in the G2/M phase was observed from 6 hours after irradiation and gradually switched to G1 phase cell cycle arrest as time passed. A similar cell cycle alteration was observed in p53-/-cell, but it was verified that the effect was smaller than that of p53+/+cell.
Also, p53-/-cell had significantly less apoptosis 48 hours after irradiation than p53+/+cell. It showed stronger cell cycle arrest and apoptosis at p53+/+cell compared to p53-/-cell. (Data not shown.)
14
2Gy
radiation (hrs) untreated 6 12 18 24 untreated 6 12 18 24 4Gy
120 53 21 43
HDAC5 p53 p21 actin
120 53 21 43
HDAC5 p53 p21 actin HepG2
SK-Hep1
0 2 4
6 p53
p21 HDAC5
untr eated 6 12 18 24 (h)
**
** ** *
**
** ** **
** **
*** ***
0 2 4 6
untr eated 6 12 18 24 (h)
***
* **
*** ** **
*** *** *** *
**
A
2Gy
radiation (hrs) untreated 6 12 18 24 untreated 6 12 18 24 4Gy
B
C
D
MW ▼ MW ▼
Hep3b 120
53 21 43
HDAC5 p53 p21 actin 2Gy
radiation (hrs) untreated 6 12 18 24 untreated 6 12 18 24 4Gy
E
F
MW ▼
G
radiation (hrs) untreated 12 24 untreated 12 24
p53+/+ p53 -/-
120 53 21
43
HDAC5 p53 p21
acti n
23 Puma
Protein relative expression
HepG2
H
MW ▼
15
Figure 1. Modulation of protein p53 and HDAC5 expression by radiation exposure in hepatocellular carcinoma.
Radiation was exposed to 2Gy and 4Gy, and the protein expression of p53, P21, and HDAC5 were confirmed by Western blot analysis in a time-dependent manner up to 24 hours per six hours after exposure. (A-F). Using the CRISPER CAS9 system, a cell line with p53-/- in HepG2 was produced and the expression of HDAC5, p53, P21 and PUMA was confirmed through Western blot analysis after radiation exposure. The expression of each protein was quantified by b-actin. (G, H)
16
2. Intercommunication between p53 and HDAC5 by RT resulting in increasing the expression of TSAP6, exosome modulating protein
To identify the more accurate interaction between p53 and HDAC5, this was investigated using the duolink PLA assay. When the cells were not exposed to radiation, no red dots were found to interact, and 4Gy of radiation revealed multiple red dots, the interaction between p53 and HDAC5. It has been demonstrated that radiation exposure induces a significant increase in the interaction of p53 and HDAC5 in cells (Figure. 2A). Using western blot validated whether TSAP6 (Tumor Suppressor Activation Pathway 6), an exosome-modulated protein in the direct downstream of p53 and controlled by p53 is increased by RT11, 12. The expression of TSAP6 was verified with a western blot at 12 hours and 24 hours after exposure to 4Gy of radiation.
Our results showed that the interaction between HDAC5 and p53 was enhanced by radiation, and the downstream TSAP6 of p53 was also significantly increased (Figure. 2B, C).
The characteristics of exosomes derived from p53+/+, p53-/-cells were identified. Exosomes secreted by cells were observed using an electron microscope. (Figure. 2D) Western blot analysis showed that microvesicles released from p53+/+, p53-/-cells expressed exosome markers CD63, CD81, and HSP90. All exosome markers have been demonstrated18. We also identified the discriminating expression of protein maspin (mammary serine protease inhibitor), which is released by p53 dependently through exosome by radiation exposure 11. Inside p53+/+cell derived exosomes, it was found that the expression of maspin was increased by radiation. However, p53-/-cell derived exosomes demonstrated no expression of maspin by radiation exposure. (Figure. 2E, F) The expression of maspin inside the exosome induced by radiation exposure is regulated by the expression of p53. p53 directly binds to the p53 gene- consensus binding site present in the maspin promoter, through activating the maspin promoter and inducing maspin expression19.
17 HepG2 Untreated 4 Gy
HDAC5 + p53DAPI
A
✱
✱
✱
B
TSAP6 (STEAP3) B-actin radiation (hrs) untreated 12 24 untreated 12 24
p53+/+ p53 -/-
43 55
C
D
p53+/+ p53 -/-
43kDa 75kDa 40kDa
26kDa 37kDa 90kDa
E
HSP90 (BD)
CD81 (SC) CD63 (SC)
Cell lysates Exosomes
Maspin (CST)
actin
F
- + - +
p53+/+ p53 -/-
(4Gy) MW ▼
MW ▼
18
Figure 2. Interaction of HDAC5 and p53 by radiation exposure in HepG2 cells, and characterization of the exosome secretion pathway and the released exosomes that are altered by this union.
The interaction between HDAC5 and p53 was confirmed after radiation exposure using Duolink proximity ligation assay in HepG2 (A). The expression of TSAP6 (STEAP3) by radiation exposure was confirmed by Western blot analysis. The expression of TSAP6 (STEAP3) was quantified by b-actin (B,C). Electron microscopy was used to image resuspended exosome particles isolated from HepG2 (D).The expression of exosome marker protein HSP90, CD63, CD81 and Maspin with each sample 10ug after radiation exposure was verified with western blot analysis.(E,F).
19
3. Exosome secretion in a p53-dependent manner by RT
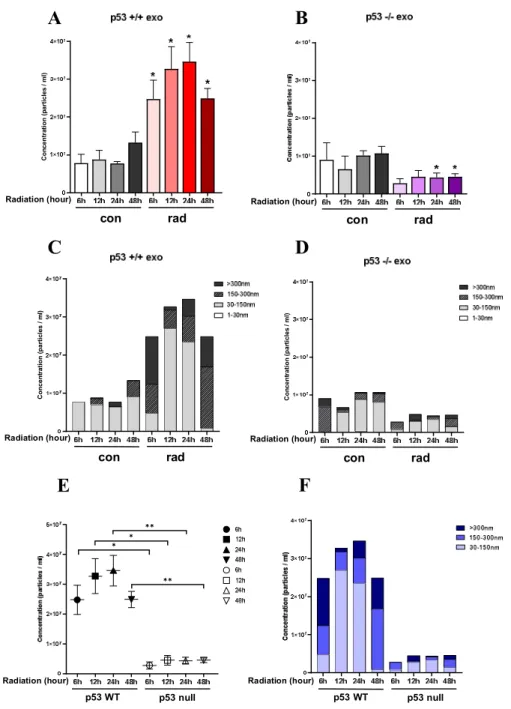
After exposure to radiation, experiments were conducted to demonstrate that the secretion of exosome changes over time. The number of cultured p53+/+cells and p53-/-cells was equal to 5x10⁶. Experiments were conducted at 6, 12, 24, and 48 hour intervals after exposure to 4Gy of radiation, and exosomes released at each hour were extracted by ultracentrifugation. The qualitative and quantitative comparison and analysis of the isolated exosomes were performed using the Nanosight NT300 equipment. (Data not shown.) As a result of the analysis, the Exosome showed a heterogeneous exosomal population with a diameter of 30-300 nm or more.
These results suggest that the isolated exosomes had high purity and satisfy the size, density, structure, and characteristics of vesicles secreted by cells18. p53+/+cells manifested a significant increase in the secretion of overall vesicles when exposed to radiation of 4Gy. As a result of comparing the total vesicles by each secreted time, it was found that the volume of secreted vesicles increased more than twice when exposed to radiation. In particular, 24 hours after exposure to radiation, the total quantity of vesicle secretion was found to be more than three-fold that of the control, and the most vesicle secretion exhibited at this time (figure. 3A).
Conversely, p53-/-cells exhibited a decrease in the volume of vesicle secretion after exposure to radiation. From 6 hours to 48 hours, the quantity of vesicle released in all experimental groups was significantly decreased compared to the control (figure. 3B). The secreted extracellular vesicles were analyzed qualitatively by separating them into 30-150nm, 150- 300nm, and >300nm by size. The p53+/+cells secreted Exosome size part (30-150nm) was the most significant increase of 12 hours after radiation exposure. As time passed after exposure to radiation, the variation of vesicles was characterized by a change in the direction of increasing their size. It was verified that exosome-sized vesicles were noticeably reduced in vesicles 48 hours after exposure to radiation (figure. 3C). In the same way, p53-/-cells derived exosome was analyzed by dividing each size. The exosome-sized vesicles released after
20
irradiation were also rapidly reduced (figure. 3D). The exosomes of p53+/+ and p53-/-cells released after irradiation were analyzed qualitatively and quantitatively. (figure. 3E, F) This experiment proved that the secretion of extracellular vesicles was increased by radiation exposure. Among them, 30-150nm-sized exosomes proved to be increased or decreased by p53 dependency. This result suggests that the expression of p53 induced by RT increases exosome secretion through the TSAP6 pathway.
21
Concentration (particles / ml) Concentration (particles / ml)
A B
C D
E F
Concentration (particles / ml)
✱
✱
✱✱
✱✱
con rad con rad
con rad con rad
p53 WT p53 null p53 WT p53 null
Radiation (hour) Radiation (hour)
Radiation (hour) Radiation (hour)
Radiation (hour) Radiation (hour)
Figure 3. Time-dependent measurement and identification of the difference in exosome size and release amount determined by the p53 gene in liver cancer cells.
Time-dependent measurements were made to determine whether the secretion of extracellular vesicles (EV) changes after radiation exposure using Nanosight's Nanoparticle Tracking Analysis (NTA) (A-B). Based on the analyzed nanosight data, three parts (30-150nm, 150- 300nm, >300nm) were displayed by vesicle size (C,D).The secretion of EVs for the presence or absence of p53 genes after radiation was analyzed qualitatively and quantitatively (E,F).
22
4. Alteration of exosomal miRNA’s expressions by RT in HCC
After the release in a cell, exosomes are taken up by neighboring or distant cells, and the miRNAs contained within modulating such processes as interfering with tumor immunity and the microenvironment, possibly facilitating tumor growth, invasion, metastasis, angiogenesis, and drug resistance. Therefore, exosomal miRNAs have a significant function in regulating tumor progression. Exosomal miRNA bioinformatics analysis was conducted to find a variation in the miRNA configuration inside Exosome after radiation exposure. The variation of miRNA in exosome secreted from the radiation exposed cell and miRNA in exosome secreted from without radiation exposure was analyzed through Heatmap utilizing MeV software (Small RNA sequencing, miRNA-Seq Only Analysis Program developed by Dana- Farber Cancer Institute in the United States). Handling the miRNA's fold change values analyzed, the graph was composed in descending order (figure. 4A). It has been confirmed that 33 miRNAs have significantly reduced due to irradiation among 156 miRNAs that have inside exosome (figure. 4B). Among the miRNAs with reduced expression, we analyzed using the hepatocellular carcinoma GEO data set to identify the miRNAs associated with the progression of hepatocellular carcinoma. The GEO data set was downloaded from NCBI Gene Expression Omnibus. As a result of analysis utilizing the HCC miRNA GEO data set (Spain, GSE74618), it was verified that 4 specific miRNAs (miR-151a-3p, miR-106b-5p, miR-183- 5p, miR-452-5p) were significantly increased in tumor tissues compared to normal (figure. 4C)
20. The HCC miRNA GEO data set (Spain, GSE74618) was re-validated using another HCC miRNA GEO data set (Japan, GSE147889) to confirm the accuracy of the analysis results (figure. 4D). To ascertain the relationship between the four miRNAs (miRNA151a-3p, miRNA 106b-5p, miRNA183-5p, miRNA 452-5p) with increased expression in HCC and the survival rate of liver cancer patients, we analyzed using OncomiR Cancer miRNome Atlas. As a result of OncomiR analysis, it was found that the higher the expression of miRNA151a-3p, miRNA 106b-5p, miRNA183-5p, and miRNA 452-5p in the tumor tissues of liver cancer patients, the
23
significantly decreased the survival rate of liver cancer patients (figure. 4E)21. We performed the KEGG pathway analysis to find out which molecular biological processes the four miRNAs, which were directly related to the prognosis of liver cancer patients, affect cancer.
Among the analysis results performed, the cell cycle, a mechanism directly related to radiation therapy, and the p53 signaling pathway, the central target of our study, was ascertained to be significant signaling mechanisms. Also targetscan(http://www.targetscan.org/vert_72/) analysis tool was used to analyze the target protein of each miRNA. As a result of the target analysis of miRNA, it was discovered that miRNA151a-3p can bind to the p53 mRNA target region with a high probability (figure. 4F). Likewise, in previous studies, it has been reported that miRNA 151a-3p was bioinformatically analyzed as a target miRNA of p53 and binds to the p53 mRNA target region, thereby inhibiting the expression of p53 in cells 22, 23. We considered miRNA 151a-3p interesting and continued the study, and it was confirmed that miRNA 151a-3p is deeply related to tumorigenesis of various cancers. As expected, miRNA 151a-3p had a great correlation with the prognosis of liver cancer patients. So, it has been confirmed that miRNA 151a-3p is a respectable relation to tumorigenesis and survival of Liver Hepatocellular carcinoma (LIHC). The expression of miRNA 151a-3p in cell and exosome after radiation exposure was analyzed using qRT-PCR. The quantification of miRNA 151a-3p was quantified using miR-Let7a24. Cellular miRNA 151a-3p decreased by 1/2 after radiation exposure, whereas exosomal miRNA 151a-3p decreased by more than 1/4 after radiation exposure. (figure. 4G,H) As a result, miRNA 151a-3p had a significant relationship with the poor survival of HCC. It also after irradiation in hepG2, a HCC cell line, demonstrated a significant decrease in the expression of miRNA 151a-3p inside the cellular and exosome.
24
P = 3.84E-07
P < 0.001 P = 4.1E-06
P < 0.02
A
Normal exo
B
C
Radiation exo
-33
(21.1%)
156 123
(79.9%)
P < 0.01 P < 0.05
P =1.92E-05 P =2.35E-06
D
25
E TCGA(LIHC)
miR-106b-5p
miR-183-5p miR-452-5p
miR-151a-3p
Control Radiation Relative miR-151a-3p/Let-7a-5p (fold change)
✱
G
Control Radiation 0
5 10 15
exosome
✱
H
F
26
Figure 4. The expression analysis of exosomal miRNAs altered by irradiation in liver cancer cells and the clinical meaning exploration and identification of candidates using bioinformatics analysis.
Before and after radiation exposure, exosomal miRNA was arranged into a fold change value and analyzed as a graph and ven diagram (A,B).Applying the GEO data set, the expression difference between normal and cancer of each candidate miRNA was analyzed. (C,D). To investigate the clinical significance of each candidate, it was analyzed using OncomiR Cancer miRNome Atlas and patient survival was expressed by Kaplan-Meier analysis (E).The target protein prediction analysis of the major candidate miR-151a-3p was performed by the Targetscan analysis tool (F). The modulation of a miR-151a-3p the radiation exposure was analyzed by qRT-PCR in the cell and the exosome (G,H).
27
5. Radioresistance increased by miR-151a-3p.
We investigated the radioresistance of miR-151a-3p. A protein related to cell apoptosis and cell cycle arrest that can be caused by radiation was verified 24 hours after the transfection of negative control and miRNA151a-3p in the cell through the western blot. Cancer repression gene p53 significantly reduced. A Decrease of P21 which inhibits cyclin-dependent phosphorylation to stop cell cycle has been identified. The BCL-2 controlling the Mitochondrial Outer Membrane Permeabilization Pore, which creates a channel that increases the permeability of the mitochondrial outer membrane, has been increased. And Puma associated with apoptosis has been reduced (Figure. 5A, B). Based on the results of Fig 5. A- B, the cell cycle arrest analysis experiment was conducted using FACS to verify the function of miRNA151a-3p in cell cycle arrest induced by radiation exposure. 24 hours after miRNA151a-3p transfection, 4Gy radiation was exposed to the cell. After six hours, the cell cycle of each experimental group was analyzed (Figure. 5C). The G2/M phase arrest was increased in the N.C group and the 4Gy positive group. In the miR-151a-3p group, the G2/M phase arrest was reduced relatively (Figure. 5D). Also, it has been confirmed that miRNA151a- 3p has a function to inhibit cell apoptosis induced by radiation exposure. As a result of the experiment, the miRNA151a-3p group significantly reduced total cell apoptosis compared to the N.C. and 4Gy positive groups (Figure. 5E,F).
28
C D
PI
Annexin V
E F
Non-radiated 4Gy+miR-151a-3p
4Gy+miR-N.C 4Gy
✱
✱
✱ 4Gy
4Gy+miR-N.C 4Gy+miR-151a-3p
p53 p21 BCL2 PUMA
0.0 0.5 1.0 1.5 2.0
miR-NC miR-151a-3p
✱✱✱ ✱✱
✱✱✱
✱
B
✱
✱
✱✱✱
✱✱
✱
✱✱✱
A
Puma P53
P21
actin BCL-2
4Gy
4Gy+miR-N.C 4Gy+miR-151a-3p
MW ▼ 53
21
26
23
43
Non-radiated
Non-radiated
29
Figure 5. Cell dysfunction according to radiation exposure is regulated by miR- 151a-3p.
Western blot analysis was performed to confirm that p53 and its downstream P21, PUMA, and BCL-2, which are closely related to cancer suppression, are modulated by miR151a-3p. (A,B) Cell cycle arrest assay using FACS was performed by PI staining to confirm that cell cycle arrest induced by radiation exposure was modulated by miR151a-3p. The Cell cycle was analyzed by dividing into G1, S, and G2 / M phases. (C,D)To confirm that cell apoptosis induced by radiation exposure is modulated by miR151a-3p, it was analyzed using FACS by Annexin V (FITC), PI staining. (E,F)
30
6. EMT-like phenotype activation and tumor progression via miR-151a-3p.
The expression of EMT marker protein was verified 24 hours after the transfection of negative control and miRNA151a-3p in the cell through the western blot. E-cadherin, a representative epithelial phenotype marker, was reduced in the miRNA151a-3p group. There was a significant increase in the mesenchymal phenotype marker vimentin and N-cadherin moving inversely to E-cadherin, and a noticeable increase in the expression of Twist1 associated with p53 metastasis (Figure. 6A, B) 25, 26. For functional evaluation that induces the progression regarding cancer of miR-151a-3p, proliferation assay, Transwell migration, and invasion assay were implemented. A significant increase in proliferation was identified in the miRNA151a- 3p 100nM group, depending on the concentration of miRNA151a-3p (figure. 6C). Similarly, the cell movement and the increase in metastasis were identified depending on the concentration of miRNA151a-3p in cell migration, Invasion assay using transwell (figure. 6D).
The moved and metastasized cells were dyed and expressed in a graph after counting (figure.
6E). So, evidence of the above data has demonstrated that miRNA151a-3p can induce EMT- like phenotype and increase cell proliferation.
31
✱
✱
✱
✱✱
✱
Migration
Control miR-151a-3p 50pmole/ul
Invasion
miR-151a-3p 100pmole/ul
C
E
✱✱
✱
✱
✱
B A
TWIST1 E-cadherin
actin Vimentin N-cadherin
D
MW ▼ 135
21
140
58
43
32
Figure 6. The ability of miRNA151a-3p to tumorigenesis.
That the representative Epithelial-mesenchymal transition (EMT) marker of E-cadherin, Twist1, Vimentin, N-cadherin is regulated by the miR151a-3p was confirmed by Western blot analysis. (A,B)The cell proliferation according to the concentration of the miR-151a-3p was analyzed by MTT assay. (C)Cell migration and invasion ability according to the concentration of miR-151a-3p were analyzed using transwell assay. (D,E)
33
7. Modulation of tumor growth by miR-151a-3p in the invivo xenograft model.
To confirm the tumor progression ability of miRNA151a-3p in vivo, a nude mouse subcutaneous xenograft model experiment was conducted. HepG2 cells were injected 5x10^6 subcutaneously in the flank of nude mice. Thereafter, miRNA-NC and miRNA-151a-3p /in vivojet-PEI complexes were injected three times at 3 days intervals using the established in vivojet-PEI transfection reagent to increase the expression of miRNA 151a-3p in cells27. In the in vivo experiment, the size of the tumor was significantly increased in miR-151a-3p compared to miRNA-NC, and the growth rate of the tumor was also faster (figure. 7A-C). In addition, in western blot analysis in tumor tissue, miRNA-151a-3p significantly inhibited the expression of p53, P21, and Puma α/β (figure. 7D, E). Comprehensive results of the experiment showed that overexpression of miR-151a-3p decreased the expression of the target protein in the tumor, and as a result, promoted tumor progression in the xenograft model.
34
miR-NC miR-151a-3p 0
500 1000 1500 2000
✱
A
B
miR-NC miR-151a-3p
injection ✱
C
D
20mm
miR-NC miR-151a-3p
p53
Actin 53
MW ▼
43
18-24 Puma α/β
p21 21
miR-NC miR-151a-3p 0.0
0.5 1.0
1.5 ✱ ✱
E
35
Figure 7. Increased tumor progression in a nude mouse subcutaneous tumor transplant model overexpressing miRNA 151a-3p
Acceleration of tumor growth by overexpression of miRNA 151a-3p in a subcutaneous xenograft model.(n = 5) (A-C) Representative images at day 18 post-transplantation with a subcutaneous xenograft nude mouse model injected with miR 151a-3p/miR-NC. (A)After the mice were sacrificed on the 18th day, the tumor was separated and the size was compared, and the weight of the tumors of each group was measured and plotted. (B) In the subcutaneous xenograft model, miR-151a-3p, miR-NC, and invivo jet-PEI complex were injected three times every three days from the third day after tumor transplantation, and the size of the tumors of each group was measured every three days. (C)The expression of the p53 and downstream in tumor tissues was investigated by Western blot. (D,E)
36
HDAC5
Total secreted exosome Exosomal miR-151a-3p
Ac
P21 PUMA
P53
miR-151a-3p Radiotherapy
Donor cell
Recipient cell
Cell cycle arrest apoptosis P21 PUMA
P53
TSAP6 (STEAP3)
Exosome- secretion
Cell cycle arrest apoptosis
Figure. 8 A schematic image of Radiation-induced exosomal miRNA-151a-3p restrain hepatocellular carcinoma progression
By radiation, HDAC5 and p53 in HCC cells increase the secretion of exosomes as a result of the interaction. The exosomal miRNA-151a-3p inside the secreted exosome functions to infiltrate the surrounding recipient cells and promote the progression of cancer.
37
Discussion
In-depth studies have shown that exosomes, which are widely present in various body fluids, contain many types of proteins, miRNAs, and various small molecules 4. After secretion, exosomes are absorbed by adjacent or distant cells, and the miRNAs in them regulate processes such as promoting tumor growth, invasion, angiogenesis, and resistance to radiotherapy (RT). Therefore, miRNAs are promising as biomarkers in clinical targeted therapies in regulating cancer progression.28. Exosomes can be considered as modulators that target and bind underlying genetic molecules in the pathways regulating RT. RT is one of the important treatments for preventing tumor progression, and through various mechanisms, it affects target cancer tissue and surrounding cancer cells. Among them, p53 plays a key role in the suppression of cancer through RT 29,30.
Our current study demonstrated a previously unknown interaction of p53 and HDAC5 in HCC by radiation exposure. Moreover, the expression of both proteins was confirmed in a time-dependent manner by radiation exposure. We confirmed that HDAC5 expression was increased by RT in p53-/-HepG2 cells, indicating that HDAC5 is an up-regulator of p53. These findings show that HDAC5 plays an important role in p53-mediated exosome release by radiation.
As previously studied, TSAP6 is known as a protein that regulates the secretion of exosomes
12. TSAP6, exosome secretion modulating protein through P53, has increased expression in a radiation exposure environment. Changes of exosomes after radiation exposure were qualitatively and quantitatively analyzed by Nanoparticle Tracking Analysis (NTA). The presence or absence of the p53 gene dramatically changed exosomes' secretion depending on the time of radiation exposure. In the previous figure, p53+/+ TSAP6 was most expressed after 12 hours of radiation exposure, and secretion of exosome was also most secreted after 12 hours of radiation exposure. On the contrary, the expression of TSAP6 by radiation exposure in the
38
p53-/-cells did not change, and the secretion of exosomes after radiation exposure decreased.
This suggests that TSAP6 is clearly involved in exosome secretion and that TSAP6 is regulated by changes in p53 resulting from radiation exposure. We photographed exosomes separated for exosome characterization using electron microscopy and analyzed western blot of exosome marker protein. Among the exosome marker proteins, Mammary Serine Protease Inhibitor (maspin) is a protein regulated by the p53 gene and functions to suppress cancer, and many studies are underway. Previous studies have confirmed that maspin inside the exosome is increased by radiation exposure in the lung cancer cell line11. We found that the expression of maspin increased significantly within the exosome secreted from p53+/+cells after radiation exposure. Besides, we confirmed that the expression of maspin did not increase in the p53-/- cells. Maspin is mounted on the exosome and released outside the cell, indicating that it functions to suppress tumor progression in surrounding cancer cells. Maspin is expected to suppress the cancer progression of the recipient cell.
The exosome is loaded with various substances (ex, protein, mRNA, miRNA., etc.) and plays an important role in communication between cells. Among them, miRNA is a potential biomarker, and many studies are underway 31 32. As a short RNA strand of the 18-22base pair, it binds to specific mRNAs with the same sequence and inhibits the gene's protein expression.
After radiation exposure, changes in the miRNA composition balance inside the exosomes were observed. The change of miRNA inside exosome altered by radiation was thought to be the starting point for communication between cancer cells and changes in the cancer microenvironment. Therefore, we generally performed a small-RNA sequencing to determine the miRNAs' overall expression in exosomes rele