In this work, we aim to investigate the effects of visualization duplication on visual analysis strategies, interaction behaviors, and analysis performance. Through quantitative and qualitative analysis, we found that the doubling of visualization is related to the number of views and insights generated and the accuracy of the visual analysis.
Introduction
Each participant was assigned to one of two groups: 1) the duplication group (DG) who had access to tool with visualization duplication, or the 2) control group (CG), which used an identical version of the tool except without the duplication function . In addition, we observe that participants with the duplication feature showed interesting annotation usage and interaction patterns.
Related Work
However, no significant results were observed in terms of time spent and confidence level of the participants. Arguably, the spread pair and PCP are one of the most popular pairs used for visual analysis. Then, additional attributes are represented with different colors, shapes, sizes and point orientations to better support efficient analysis.
Johansson et al. discuss evaluation, categorization and guidelines for future research on PCPs, while Heinrich and Weiskopf present a state-of-the-art report on PCPs [19]. Examining participants' analytical processes used to gain insight through provenance can reveal participants' knowledge generation processes, such as how a given tool helps participants gain insight. This type of research, which aims to understand participants' reasoning process by visualizing and analyzing participant interactions, is referred to as insight provenance research (e.g.
In particular, to infer high-level strategies as well as low-level interaction patterns, we capture the types (what), the quantities (how much) and the methods (how) of participants' insight acquisition processes through notes and interaction logs. following the insight measurement metrics proposed by Guo et al.
Visual Tool Design
Overview
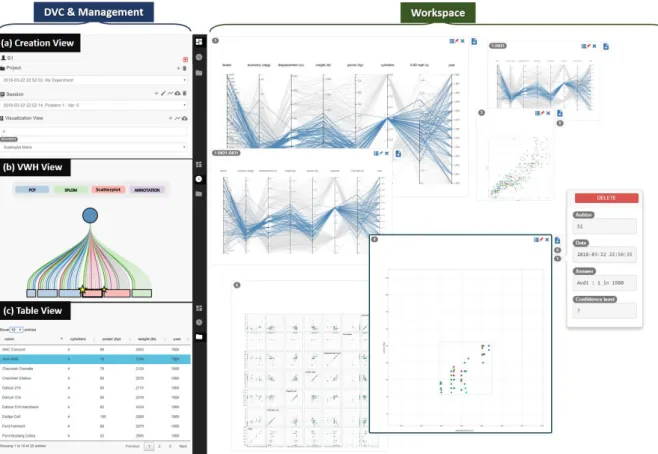
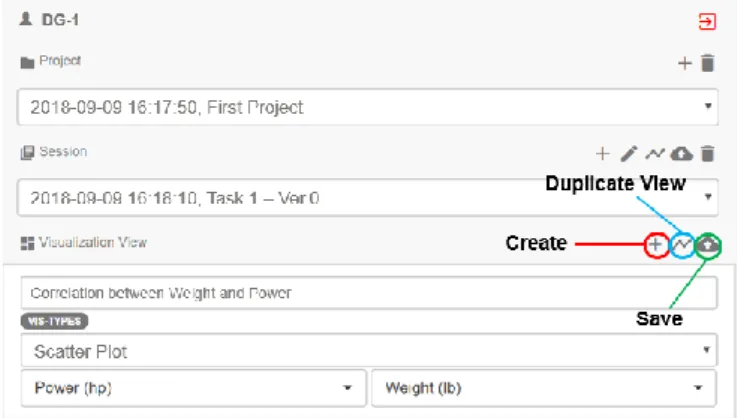
Project” was used in our experiment to distinguish participants - each participant worked on a project consisting of multiple sessions. . participants were asked to create "a session", wherever a new task starts. To create a visualization, participants must 1) click the "+" symbol, 2) select parameters (eg visualization name, visualization type) and "Save".
Creation View and Table View
The participant primarily performed visual exploration brush and looked for the item on the board before responding to the final response.
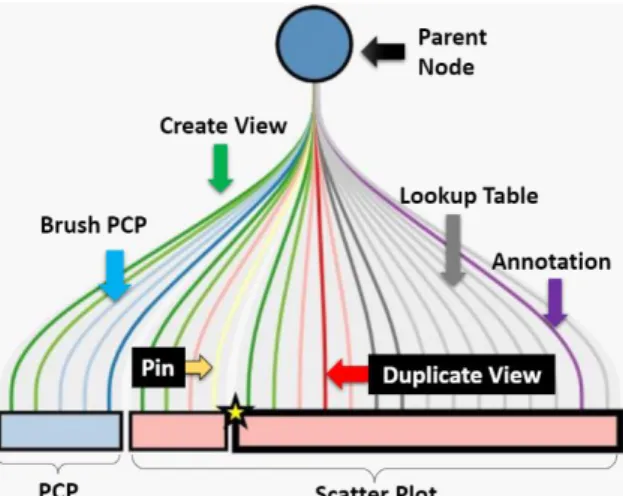
Visual Work History (VWH)
The participant created three views (1 PCP and 2 Scatterplots), one of which was created using duplication. When the participant performs more actions (eg brushes) on the same view, new links are added to the right of the existing links and the leaf increases its width proportionally. If the participant creates a new view (whether from the default method or VD), a new leaf is added to the right and a new link, indicating 'creation view'.
When the participant makes a note, the view adds a star symbol in the upper left corner of the sheet, and the size of the star is proportional to the number of notes.
Visualization Workspace
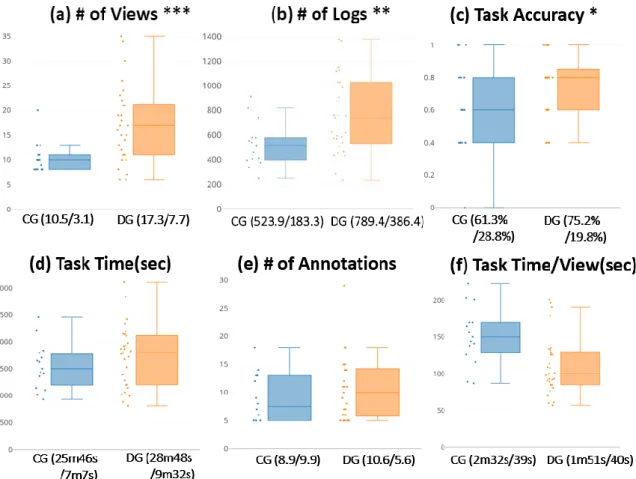
Participants who have access to duplication generate more views than those who do not (RQ1). Participants who have access to duplication solve data analysis tasks with higher accuracy than those who do not (RQ2). Participants who have access to duplication take less time to solve data analysis tasks than those who do not (RQ2).
Participants who have access to duplication generate more insights than those who do not (RQ1, RQ2). Participants who have access to duplication use the pin interaction more often than those who do not (RQ1). Participants who have access to duplication are more confident in their analysis processes and results than those who do not (RQ3).
Participants who have access to duplication perform more interactions than those who do not (RQ1).
Dataset and Analysis Tasks
For example, T3 in Table 1 can be solved with a PCP in a view by moving two axes and filtering by power. Alternatively, two views can be used with one PCP view for clearing and another distribution view to find an answer. T4 could not be easily solved at a glance because it would require a high cognitive load to remember the filtered scores and counts.
Procedure
Participants, Equipment and Measures
Among the 35 participants in the DG, we noticed that 5 participants did not use duplication in solving all tasks. As a result, we ultimately had a sample of 44 participants for analysis, with 15 participants in the CG and 29 participants in the DG. Instead of using a screen capture tool that could unexpectedly interrupt the experiment, we wrote a lightweight logger to record all of the participants' interactions.
We recorded participants' voice and screen activities using high-resolution video cameras to rate verbal throughput. During the experiment, we measured three numerical criteria for evaluation: the task completion time, accuracy (the number of correct answers divided by five), and the confidence score per task based on the 7-point Likert scale (7 is the most confident). We recorded all participant interactions and captured screen activities along with participant verbal reports (transitions) through the think-aloud protocol.
In the next section, we describe how we coded participants' activities from the diaries into insight categories and analyzed the diaries and video-audio recordings to derive high-level interaction patterns and analysis strategies.
Coding Insights and Interaction Patterns
When a participant spoke in the video, each coder determined whether it could be considered an insight. When the coders did not reach agreement, a final insight score was produced by averaging the scores. The correlation between the rating scores and types of insights and the coders' scores was 80.97%, indicating that the coders were consistent in their rating [22].
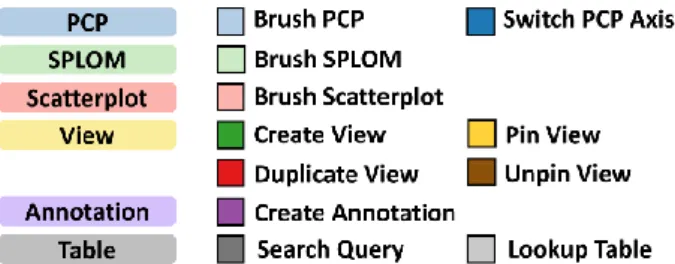
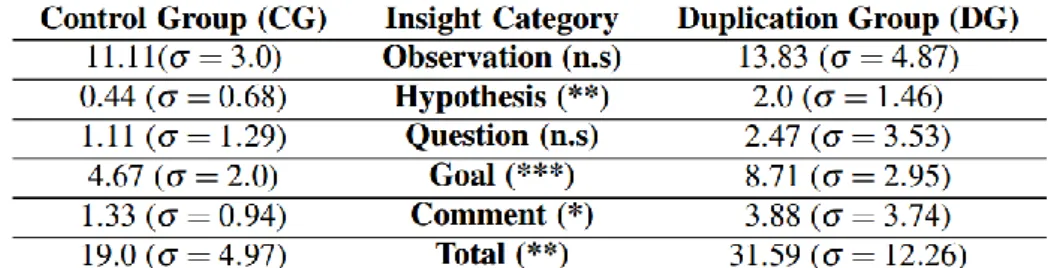
4 summarizes the 11 event types as well as two additional events (save-view and delete-view were excluded because they are unrelated to the participant's analysis patterns). Each of the event types was categorized into one of four categories: Filter, Reconfigure, Retrieve and Annotation, as stated in [30]. Note that although annotation is not one of the categories from Yi et al., but we include it in our work because it was an important activity to summarize intermediate results and gain insights during the study's analysis session.
We decided to do this because we found that many participants quickly switched focus between multiple views in order to perform some interactions (eg filtering) during the experiment.
Duplication Leads to More View Creation and More Interaction
On the other hand, we believe that duplication played an important role in reducing participants' system power costs. For example, one participant commented ".. I feel that it [i.e., dual work] helped me stay focused on my problem solving process as it allowed me to easily create other points of view." Other participants expressed similar opinions-. We believe that using multiple views may lead to more candidate responses or critical information being fixed (r=0.37, p<0.001) to reduce temporal frame connections and state change costs [52].
9, DG-22 shows an example of a problem-solving strategy from a participant who often used pins (i.e., yellow strips) on scatterplots to maintain findings in the view and duplicate views to discover more findings.
![Table 3 Performed interactions based on Yi’s interaction taxonomy [30].](https://thumb-ap.123doks.com/thumbv2/123dokinfo/10509892.0/24.892.205.688.128.253/table-performed-interactions-based-yi-interaction-taxonomy-30.webp)
Better Analysis Performance with Duplication
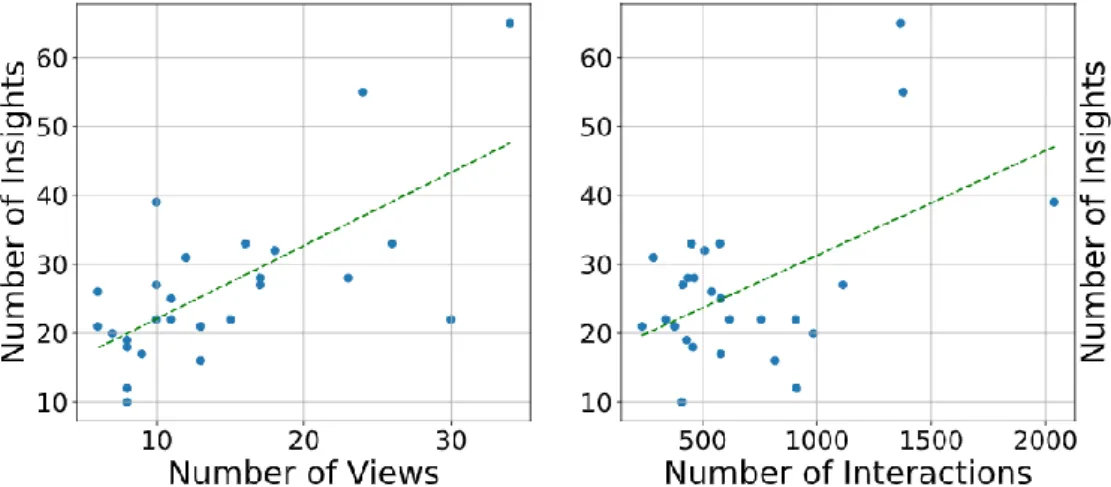
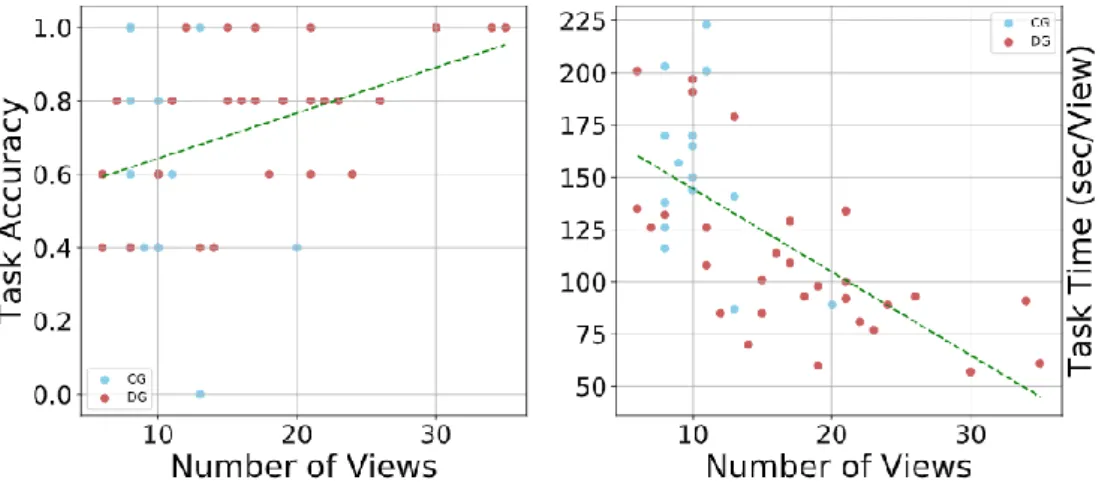
In summary, DG participants produced more insights and performed the given tasks more accurately than participants without duplication of effort and without wasting much time. There is a significant positive relationship between the number of views and interactions: the more views, the more interactions during the analysis (Fig. 6, right). The results indicate that the number of views is correlated with accuracy; However, the study did not guarantee causality between them, as participants had the freedom to create as many viewpoints as they wanted.
Initially, we hypothesized that participants in the DG would have a higher level of confidence than those in the CG. We speculate that participants in both groups showed high confidence in their responses because participants in both groups may have felt that they had enough time to complete the tasks, as reflected in their task times. We also think that GK participants may have felt that they could work on the tasks with fewer views due to the level of perceived difficulty of the tasks, as described in Sec.
Participants showed a variety of patterns in the study in terms of the number of views, visualizations used, interactions performed, and annotations.
Strategies using Duplication
In PCP's first appearance, it mainly performed a series of washing interactions in the "Power" dimension. The main interactions for the second view were also scratchy, but at times, the interactions focused on the Brand dimension. An interesting observation is that she paused for a moment before creating the second look and commented, "It's not going to end this way." After the break, she continued her exploration by doing another PCP look and brushing in another dimension, "Brand.".
Similarly, participant DG-20 (Fig. 8) used the same series of brushes on the first PCP display and the break time; Interestingly, after the break, the DG-20 began creating three additional views using duplication and quickly applied a few more brushes for simultaneous comparison. Programmers are free to test more ideas because of the less costly option of "branching" instead of directly revising the main version. In general, the PCP table combination was a popular combination, where the main strategy is brushing from the PCP and posting in a table, as seen in fig.
This may mean that enabling easy view creation may trigger new combinations of the system's available visualizations, which may lead to other atypical but useful combinations of visualizations and the development of new analysis strategies.
Analysis of Annotation Utilization Patterns
For example, participant DG-23 (Fig. 8) created her own format for annotation organization and sorting, such as [year, brand, number]. Developing a method to distinguish between common and important annotations (eg annotation panel) can improve participants' visual analysis with annotations.
Frequent Interaction Sequences
Recommended interactions can further facilitate visual analysis [58]; however, it is not clear what the best recommendations should be during view creation or visual analysis.
Participant Feedback
Kuchinsky, "Guidelines for use multiple views in information visualization," i ACM Conference on Advanced Visual Interfaces, 2000, s. Zhou, "Characterizing users' visual analytic activity for insight provenance," i IEEE Symposium on Visual Analytics Science and Technology, 2008 , s. Ma, "Image graphs - a novel approach to visual data exploration," i IEEE Conference on Visualization, 1999, pp.
North, “Space to think: large higher solution displays for meaning making,” in Proceedings of the SIGCHI conference on human factors in computing systems, 2010, pp. Lee, “A Comparative Evaluation of Online Learning Approaches Using Parallel Coordinate Visualization,” in ACM CHI Conference on Human Factors in Computing Systems, 2016, pp. Stasko, “Low-level components of analytical activity in information visualization,” in IEEE Symposium on Information Visualization, 2005, pp.
Yi, »Visual analytic roadblocks for novice investigators,« v EEE Conference on Visual Analytics Science and Technology, 2011, str.