저작자표시-비영리-변경금지 2.0 대한민국 이용자는 아래의 조건을 따르는 경우에 한하여 자유롭게
l 이 저작물을 복제, 배포, 전송, 전시, 공연 및 방송할 수 있습니다. 다음과 같은 조건을 따라야 합니다:
l 귀하는, 이 저작물의 재이용이나 배포의 경우, 이 저작물에 적용된 이용허락조건 을 명확하게 나타내어야 합니다.
l 저작권자로부터 별도의 허가를 받으면 이러한 조건들은 적용되지 않습니다.
저작권법에 따른 이용자의 권리는 위의 내용에 의하여 영향을 받지 않습니다. 이것은 이용허락규약(Legal Code)을 이해하기 쉽게 요약한 것입니다.
Disclaimer
저작자표시. 귀하는 원저작자를 표시하여야 합니다.
비영리. 귀하는 이 저작물을 영리 목적으로 이용할 수 없습니다.
변경금지. 귀하는 이 저작물을 개작, 변형 또는 가공할 수 없습니다.
3.1.1
3.1.2
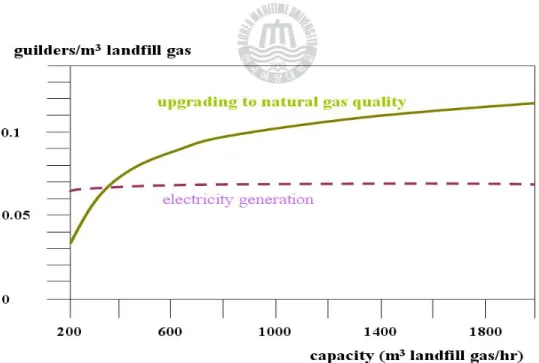
Figure 1-1. Compare the economics of electricity generation and upgrading
to natural gas quality as capacity-profit diagram. --- 4
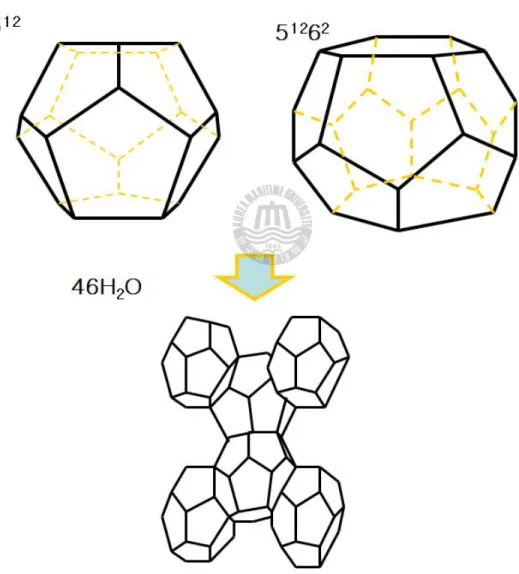
Figure 1-2. Structure I hydrate were formed from two 512 cages and six 51262 cages by 46 water molecules.--- 7
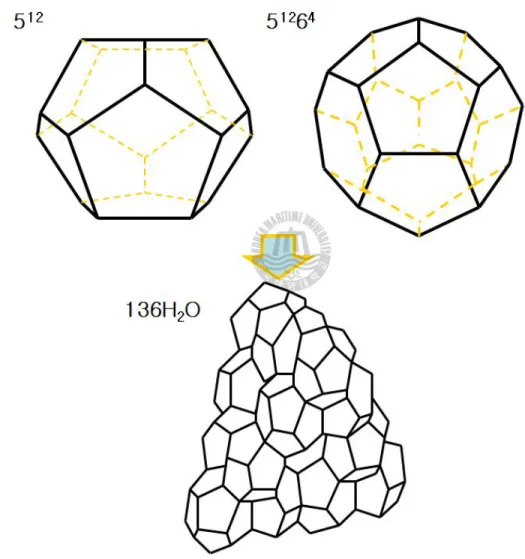
Figure 1-3. Structure Ⅱ hydrate were formed from sixteen 512 cages and eight 51264 cages by 136 water molecules.--- 8
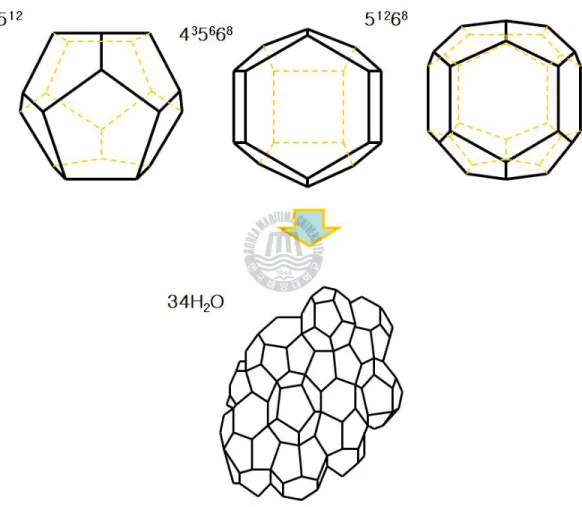
Figure 1-4. Structure H hydrate were formed from three 512 cages, two 435663 cages and one 51268 cage by 34 water molecules .--- 9
Figure 1-5. Comparison of guest molecule Size and cages occupied as simple hydrate. --- 10
Figure 1-6. Volume change during NGH phase transition. --- 11
Figure 1-7. Capacity-distance diagram. --- 12
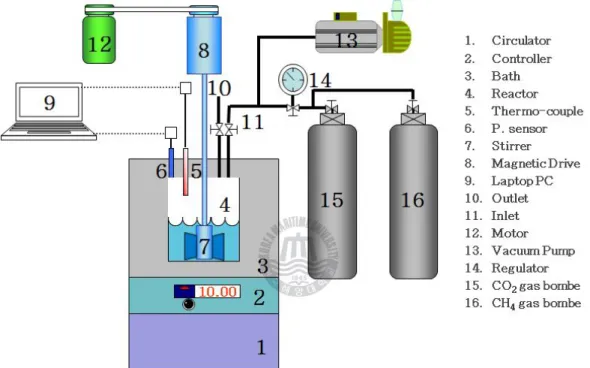
Figure 2-1. Schematic diagram of the experimental apparatus used in this study. --- 14
Figure 2-2.
The picture
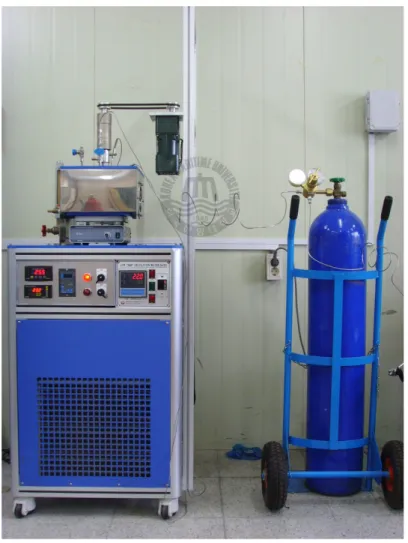
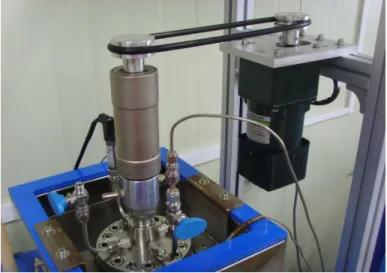
of the experimental apparatus used in this study.--- 15Figure 2-3. The picture of magnetic drive.--- 16
Figure 2-4. The picture of reactor cell.--- 16
Figure 2-5. The picture of stirrer. --- 17
Figure 2-6. Automatic temperature-pressure save program : SDlog1004 Ver 1.01. --- 18
Figure 2-7. Experimental apparatus : Gas chromatography ACME 6100. ---- 19
Figure 2-8. Experimental apparatus : Micro Raman spectrometer LabRAM HR.--- 20 Figure 2-9. Schematic diagram of the PAL 8C2
21
Figure 2-10.
Experiments in the process of
pressure - temperatureline
diagram.--- 23Figure 2-11. Experiments in the process of pressure - temperature change.-- 25
Figure 2-12. Raman sample vessel. --- 26
Figure 2-13. The picture of 8C2 HRPD B/L MDS DATA POST PROCESSING CONTROL PANEL. --- 27 Figure 3-1. Phase equilibria of water +CH4, water + CO2, water + THF
(5.56mol%) + CH4, water + THF (5.56mol%) + CO2, and CO2
dew point. --- 30 Figure 3-2. Pressure and composition diagram for mixed CO2+CH4 hydrate
system. (274K, 278K) --- 31
Figure 3-3. Pressure and composition diagram for mixed THF(5.56mol%) +CO2+CH4 hydrate system. (283K, 290K)--- 33
Figure 3-4. Raman spectra of (a)pure water +CO2 + CH4 hydrate and (b) THF (5.56mol%) +CO2 +CH4 hydrate. --- 35
Figure 3-5. Raman spectra of C-C-C-C and C-O-C vibrations on THF. ---- 36
Figure 3-6.
Raman spectra of CO
2 vibrations. --- 37Figure 3-7.
Raman spectra of CH
4 vibrations.---
38Figure 3-8. X-ray powder diffraction of pure water + CO2 +CH4 hydrate.-- 39
Figure 3-9. X-ray powder diffraction of THF(5.56mol%) + CO2 +CH4
hydrate. (low pressure condition: 0.8MPa)--- 40
Figure 3-10. X-ray powder diffraction of THF(5.56mol%) + CO2 +CH4
hydrate. (high pressure condition: 4MPa)--- 41
표 목차
Table 1-1. LFG composition. --- 1
Table 1-2. Variety application of LFG. --- 3
Table 1-3. Comparison of properties of ice, SI and SⅡ hydrates.--- 5
Table 1-4. Structural characteristics of hydrate.--- 6
Table 3-1. Three phase H-I-V equilibria of the pure water + CO2 +CH4 system at isothermal. --- 28
Table 3-2. Three phase H-I-V equilibria of the THF(5.56mol%) + CO2 +CH4 system at isothermal.--- 29
Table 3-3. Three phase H-Lw-V equilibria of the pure water + CO2 +CH4 system at isothermal. --- 32
Table 3-4. Three phase H-Lw-V equilibria of the THF(5.56mol%) + CO2 +CH4 system at isothermal. --- 34
Table 3-5. Raman shift of CO2.--- 37
Abstract
The recent quest to replace fossil fuels with renewable and sustainable energy sources has increased interest on utilization of landfill gas. It is further augmented due to environment concerns and global warming caused by burning of conventional fossil fuels, energy security concerns and high cost of crude oil, and renewable nature of these gases. Gas hydrates are non-stoichiometric inclusion compounds, which are formed by the physically stable interaction between water and relatively small guest molecules occupied in the cavities built by water molecules. They have been classified into three distinct structures I, II and H by the difference in the cavity shape and size of hydrates. These structures are arranged into well-defined three-dimensional crystalline solids. In this study, three phases, H-Lw-V, equilibrium behaviour for the carbon dioxide-methane and carbon dioxide-methane-tetrahydrofuran (THF) mixed hydrate systems are observed at several isothermal conditions.
For the carbon dioxide-methane hydrate system, the three phase dissociation pressures decrease with increasing the concentration of carbon dioxide at all the considered isothermal conditions. At all equilibrium conditions, the concentrations of carbon dioxide in the hydrate phase are always higher than that in the vapor phase. However, it is interesting to note that, for the carbon dioxide-methane-THF hydrate system, the three phase dissociation pressures decrease with increasing the concentration of carbon dioxide at 290.15 K, whereas it is almost the same regardless of the concentration of carbon dioxide-methane mixtures at 283.15K. This may be caused by the difference in occupancy and stability of guest molecules in the small cages of sII hydrates.
X-ray powder diffraction (XRPD) and Raman spectroscopy are used to investigate the crystal structure of hydrates and occupation of guest molecules in the cages of hydrates. The hydrates formed from the carbon dioxide-methane mixtures are found to be sI hydrate, whereas the carbon dioxide-methane-THF hydrates form sII structure. For the sI structure of carbon dioxide-methane hydrates, both guest species of carbon dioxide and methane can occupy both small and large cages of the hydrate frameworks.
However, the small guest molecules of carbon dioxide and methane occupy
only the small cages of the sII hydrate, as all the large cages are occupied by
THF molecules of 5.56 mol%.
Table 1-1. LFG composition[1]
component. unit. composition.
methane (CH
4) vol.% 55~60
C
2+ vol.% < 0.1
carbon dioxide (CO
2) vol.% 35~40
nitrogen (N
2) vol.% < 5
Oxygen (O
2) vol.% < 2
sulphur, inorganic mg/m
30~100
mercaptans mg/m
30~10
halogenated hydrocarbons mg/m
30~150
water saturated
˗ ˗ ˗ ˗ ˗ ˗ ˗
Table 1-2. Variety application of LFG. [3]
Medium Energy Gas (3500~5400 kcal/m
3) Partially cleaning the raw gas
Electric generation: gas engines or turbines Heating of water in boiler system
Direct use of LFG in the kiln Leachate evaporation
High Energy Gas (8900~9400 kcal/m
3)
LFG upgrading: remove most of CO
2& other impurities Pipeline gas in gas distribution grid
Vehicle fuel
Emerging technologies Methanol production Fuel cell
Production of commercial CO
2Use of LFG for heating and CO
2enhancement in greenhouses
Figure 1-1. Compare the economics of electricity generation and upgrading to natural gas quality as capacity-profit diagram. (Holland)[4]
Table 1-3. Comparison of properties of ice, SI and SⅡ hydrates. [5]
Property Ice Structure I Structure II
Number of H
2O molecules
in the unit cell 4 46 136
Lattice parameters at 273K(nm)
a=0.452
c=0.736 1.2 1.73
Dielectric constant at 273K 94 ≒ 58 ≒ 58
H
2O molecule reorientation
time at 273K(µsec) 21 ≒ 10 ≒ 10
H
2O diffusion jump time
at 273K(µsec) 2.7 >200 >200
Isothermal Young's modulus
at 268K(10
9Pa) 9.5 ≒ 8.4 ≒ 8.2
Speed long sound
at 273K(km/sec) 3.8 3.3 3.6
Poisson's ratio 0.33 ≒ 0.33 ≒ 0.33
Bulk modulus at 272K 8.8 5.6 NA
Shear modulus at 272K 3.9 2.4 NA
Velocity ration(comp/shear)
at 273K 1.88 1.95 NA
Bulk density(g/cm
3) 0.917 0.91 0.94
Adiabatic bulk compressibility
at 273K(10
-11Pa) 12 ≒ 14 ≒ 14
Thermal conductivity
at 263K(W/m·K) 2.23 0.49±0.02 0.51±0.02
Table 1-4 . Structural characteristics of hydrate. [5]
Hydrate crystal
structure I II H
Crystal type cubic cubic hexagonal
Lattice
parameters(nm) a=1.293 a=1.731 a=1.226, c=1,017 Cavity small large small large small medium large Cavity type 5
125
126
25
125
126
45
124
35
66
35
126
8Number of
cavities 2 6 16 8 3 2 1
Average cavity
radius(nm) 0.391 0.433 0.3902 0.4683 0.391 0.406 0.571 Coordination
number
a20 24 20 28 20 20 36
Number of water molecules in the unit cell
46 136 34
Ideal
composition
b6X·2Y·46H
2O 8X·16Y·136H
2O 1X·3Y·2Z 34H
․ 2O
Figure 1-5. Structure I hydrate were formed from two 512 cages and six 51262 cages by 46water molecules.
Figure 1-6. Structure Ⅱ hydrate were formed from sixteen 512 cages and eight 51262 cages by 136 water molecules.
Figure 1-7
.
Structure H hydrate were formed from three 512 cages, two 435663 cages and one 51268 cage by 34 water molecules.Figure 1-5. Comparison of guest molecule Size and cages occupied as simple hydrate. [5]
Figure 1-9. Volume chage during NGH phase transition.
℃
℃
Figure 1-10. Capacity-distance diagram. [10]
Figure 2-1. Schematic diagram of the experimental apparatus used in this study.
Figure 2-2. The picture
of the experimental apparatus used in this study.와 를 보여주고 있다
Magnetic driver stirrer .
Figure 2-3. The picture of magnetic drive.
Figure 2-4. The picture of reactor cell.
Figure 2-5. The picture of stirrer.
Figure 2-6. Automatic temperature-pressure save program : SDlog1004 Ver 1.01.
Figure 2-7. Experimental apparatus : Gas chromatography ACME 6100.
Figure 2-8. Experimental apparatus : Micro Raman spectrometer LabRAM HR
Figure 2-9. Schematic diagram of the PAL 8C2
Figure 2-10.
Experiments in the process of
pressure - temperatureline
diagram.Figure 2-11. Experiments in the process of pressure - temperature change.
Figure 2-12. Raman sample vessel
Figure 2-13. The picture of 8C2 HRPD B/L MDS DATA POST PROCESSING CONTROL PANEL.
Table 3-1. Three phase H-I-V equilibria of the + CO2 +CH4 system at isothermal.
(268.15K)
Table
Table 3-2. Three phase H-I-V equilibria of the THF(5.56mol%) + CO2 +CH4 system at isothermal. (268.15K)
Figure 3-1. Phase equilibria of (a) water +CH4, (b) water + CO2, (c) water + THF (5.56mol%) + CH4, (d) water + THF (5.56mol%) + CO2, and (e) CO2 dew point.
Figure 3-2. Pressure and composition diagram for mixed CO2+CH4 hydrate system.
(274K, 278K)
Table 3-3. Three phase H-Lw-V equilibria of the pure water + CO2 +CH4 system at isothermal. (274.15K, 278.15)
Figure 3-3. Pressure and composition diagram for mixed THF(5.56mol%)+CO2+CH4
hydrate system. (283K, 290K)
Table 3-4. Three phase H-Lw-V equilibria of the THF(5.56mol%) + CO2 +CH4 system at isothermal. (283.15K, 290.15K)
Figure 3-4. Raman spectra of (a)pure water +CO2 + CH4 hydrate and (b) THF (5.56mol%) +CO2 +CH4 hydrate.
Figure 3-5. Raman spectra of C-C-C-C and C-O-C vibrations on THF.
Table 3-5. Raman shift of CO2. (a [20], b [21])
conditions
a b
V
1(cm
-1)
V
2(cm
-1)
V
1(cm
-1)
V
2(cm
-1) CO
2in solution without hydrate. 1274 1383 1284 1388
CO
2in solution with hydrate 1275 1381 - -
CO
2in the hydrate 1277 1380 1276 1282
Figure 3-6. Raman spectra of CO
2 vibrations.Bottom: Pure water, Top: THF
Figure 3-7. Raman spectra of CH
4 vibrations.Bottom: Pure water, Top: THF (5.56mol%)
Ⅰ
Figure 3-8. X-ray powder diffraction of pure water + CO2 +CH4 hydrate.
Figure 3-9.
X-ray powder diffraction of THF(5.56mol%) + CO2 +CH4 hydrate.(low pressure condition: 0.8MPa)
Figure 3-10. X-ray powder diffraction of THF(5.56mol%) + CO2 +CH4 hydrate.
(high pressure condition: 4MPa)
![Table 1-3. Comparison of properties of ice, SI and S Ⅱ hydrates. [5]](https://thumb-ap.123doks.com/thumbv2/123dokinfo/10556702.0/15.774.94.686.329.929/table-comparison-properties-ice-si-s-ⅱ-hydrates.webp)
![Figure 1-5. Comparison of guest molecule Size and cages occupied as simple hydrate. [5]](https://thumb-ap.123doks.com/thumbv2/123dokinfo/10556702.0/20.774.194.584.113.653/figure-comparison-guest-molecule-size-occupied-simple-hydrate.webp)
![Figure 1-10. Capacity-distance diagram. [10]](https://thumb-ap.123doks.com/thumbv2/123dokinfo/10556702.0/22.774.92.655.90.362/figure-1-10-capacity-distance-diagram-10.webp)