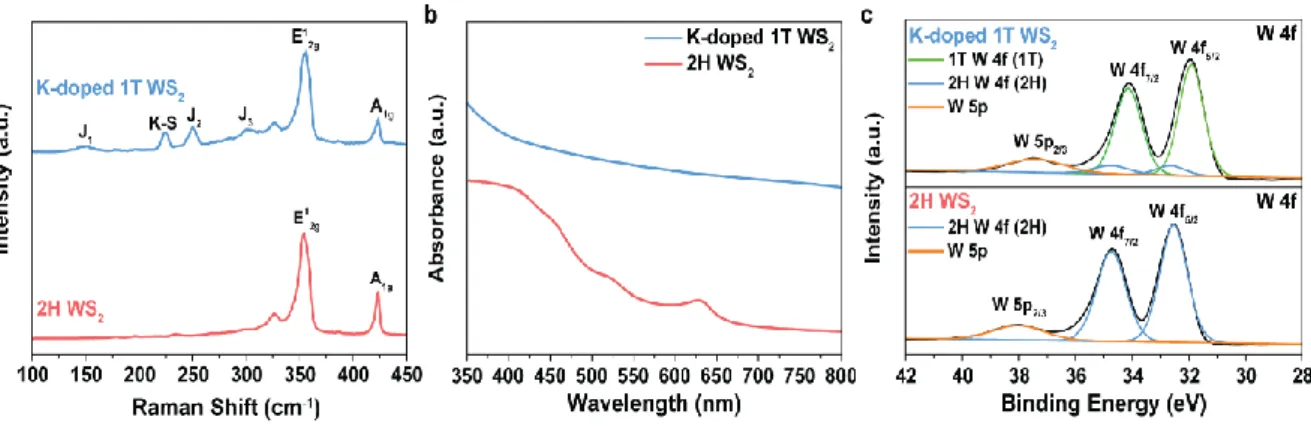
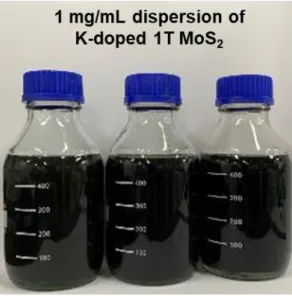
Furthermore, we used K-doped 1T MoS2 as a hydrogen evolution reaction (HER) electrocatalyst and confirmed the improved HER performance due to the high electrical conductivity and basal plane activation of K-doped 1T MoS2 compared to 2H MoS2 and 1T MoS2 (n- BuLi), and the high phase stability of K-doped 1T MoS2 shows high HER stability. Digital image of K-doped 1T MoS2 dispersion in DI water showing that scalable synthesis of K-doped 1T-MoS2 is possible. Comparison of K-doped 1T WS2 synthesized by molten potassium intercalation and 2H WS2 (a) Raman (b) UV-vis spectra (c) XPS spectra.
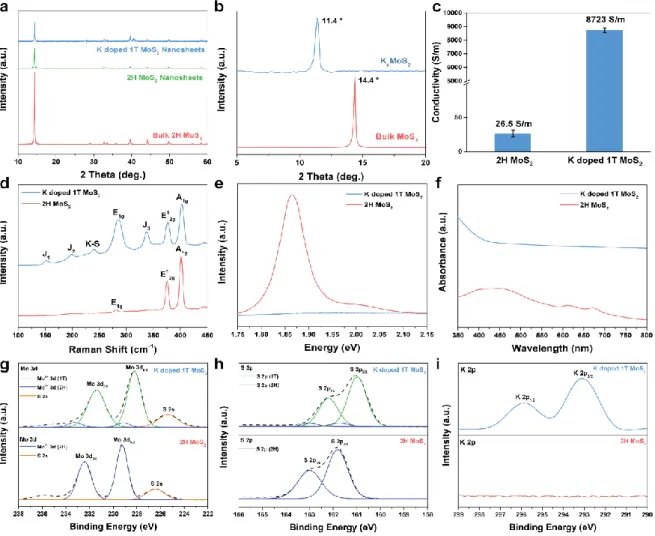
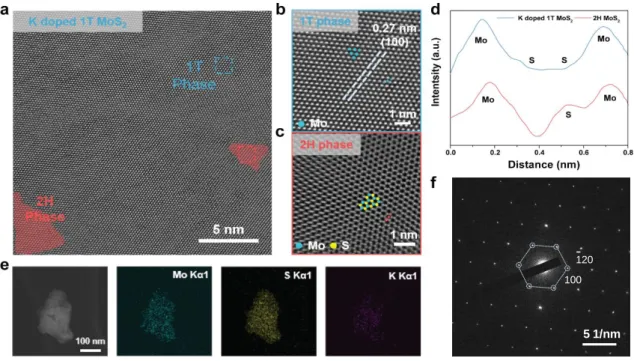
Comparison of characterization between K-doped 1T MoS2 and 2H MoS2. a) XRD patterns of K-doped 1T MoS2 compared to bulk 2H MoS2 and nanosheets and K-doped 1T MoS2. The PL and UV-vis results show that the A and B exciton peaks in the case of K-doped 1T MoS2 are quenched. HRTEM analysis of K-doped 1T MoS2. a) HRTEM image of K-doped 1T MoS2 showing both the dominant 1T and 2H phases of MoS2.
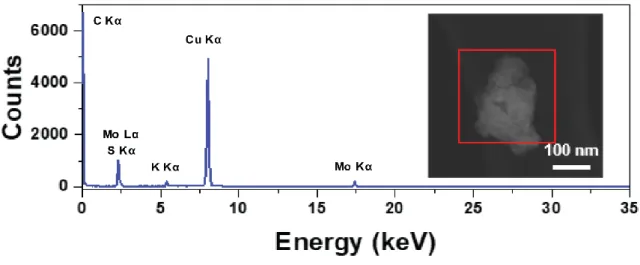
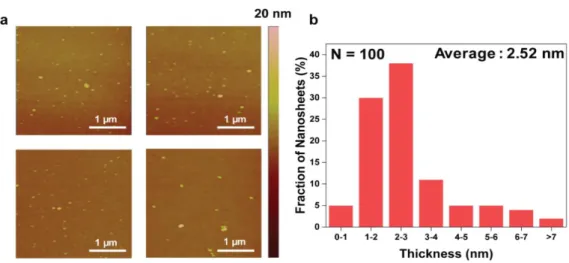
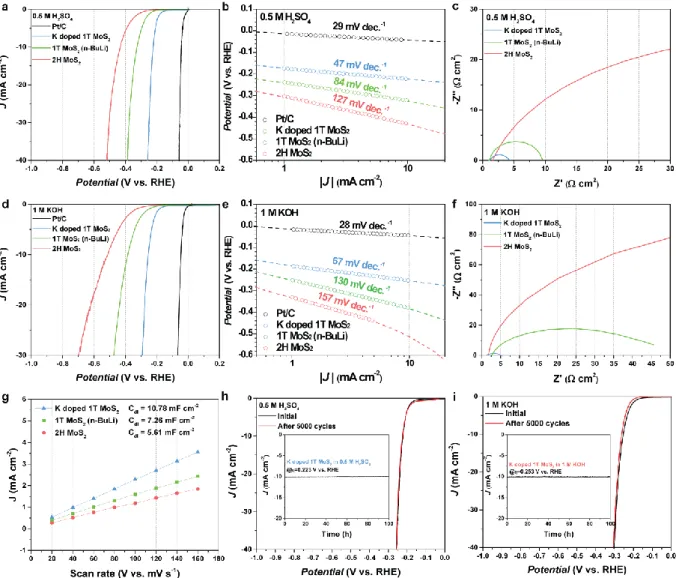
The red rectangle in the inset image shows the selected EDS inspection field. a) Atomic force microscopy (AFM) of K-doped 1T MoS2 on SiO2 substrate. When irradiated with a 532 nm laser, 1T MoS2 synthesized by n-BuLi is easily converted to the 2H phase. HER catalyst application (a, d) Linear sweep voltammetry (LSV) curves in (a) 0.5 M H2SO4 (d) 1 M KOH aqueous solution. g) Electrochemical double layer capacitance of K-doped 1T MoS2, 1T MoS2 (n-BuLi) and 2H MoS2 obtained from CV.
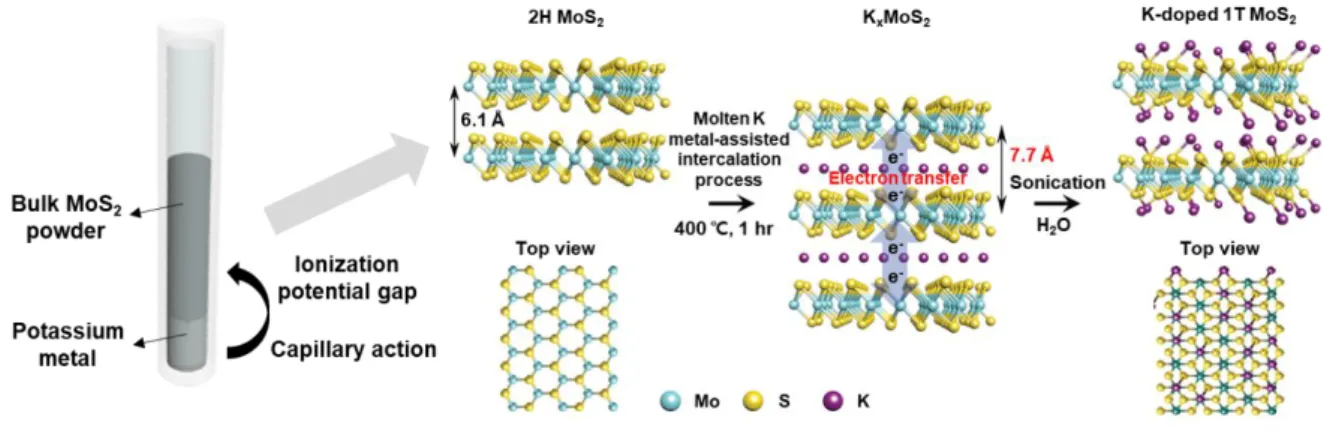
Synthesis of 1T MoS 2 via molten Potassium metal intercalation and doping
Research background
Intercalation or doping of a material with a lone pair of electrons such as alkali metal25-26 can lower the activation energy to convert 1T to 2H, thereby keeping 1T phase more stable than 2H phase. In addition, metal doping can maintain the octahedral coordination by trapping the sulfur site of 1T phase, and can maintain the Mo 3d orbital electronic structure of 1T phase by continuous electron transfer to Mo atom by doping atom with lone pair electron35,36. Although density functional theory (DFT) has confirmed that the formation energy of the 1T phase is more stable than the 2H phase via electron donor doping in previous studies, typical electron donor doping methods for improving the 1T phase stability require generally difficult conditions such as the use of toxic gas, and chemical vapor deposition (CVD) process at high pressure and temperatures.37 Therefore, a relatively easy method that easily electron donor doped to the TMD's basal level is indispensable to show the properties of stable 1T-TMDs to take full advantage of.
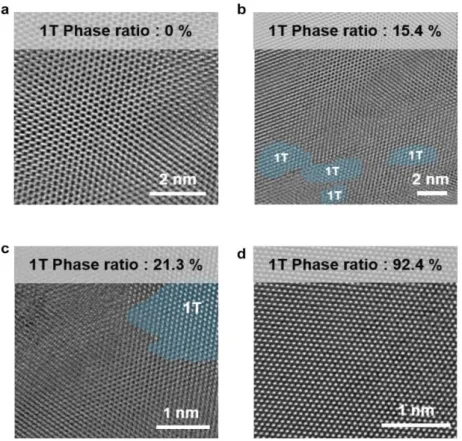
In this work, we propose a method of intercalation and doping of molten potassium metal, which is more reactive than alkali ions, for the synthesis of 1T MoS2. K-doped 1T MoS2 synthesized by the proposed synthesis method has a 1T phase up to 92% and synthesis of 1T MoS2 with 80% yield. In addition, it was confirmed by calculation that the 1T phase is more stable than the 2H phase by doping the K atom, which acts as an electron donor.
In addition, by applying K doped 1T MoS2 with high phase purity and phase stability to the hydrogen generating catalyst, HER efficiency and stability were improved compared to 1T MoS2 and 2H MoS2 synthesized with n-BuLi.
Experimental section
Thermal analysis to confirm phase conversion was performed using TGA (Q500, TA) and DSC (Q200, TA) at a scan rate of 5 ℃ min-1. The electrochemical reduction profiles of the rotating disk electrode (RDE) were measured by depositing a thin film of catalysts by preparing the catalyst ink on the glassy carbon disk electrode, where the surface area is 0.1256 cm2. Each catalyst was prepared in the form of an ink by dispersing 18 mg of the catalyst and 2 mg of Ketjen Black (EC-600JD) in 1 ml of a binder solution, followed by a bath sonication process, where the binder solution is prepared by mixing ethanol, isopropyl alcohol and 5 wt% Nafion solution (Sigma-Aldrich) with a volumetric ratio of 45:45:10.
A platinum wire was used as a counter electrode and Ag/AgCl (saturated KCl filled) was used as a reference electrode. The electrochemical tests were performed using a computer-controlled potentiostat (Biologic VMP3) with a RRDE-3A (ALS Co.) rotating disk electrode system at a scan rate of 10 mV sec-1. A calibration in reversible hydrogen electrode (RHE) was determined experimentally at a scan rate of 1 mV s-1, in H2-saturated 0.5 M H2SO4.
For all experiments with the half-cell configuration, iR drops were compensated by measuring the solution resistance in the operating state.
Synthesis mechanism of K doped 1T MoS 2
The reason for the K–S ionic bond is that the difference in electronegativity between K atom and S atom is 1.76, therefore the electron can be transferred from K atom to the MoS2. The digital image shown in Figure 1.2 is the K-doped 1T MoS2 dispersed in deionized water with a concentration of 1 mg/ml, demonstrating that gram-scale synthesis of K-doped 1T MoS2 is possible. In particular, the general applicability of the MMI method was also validated as an extensible method to apply phase engineering of other VI-TMDs, WS2 (Figure 1.3).
Characterization anlaysis of K doped 1T MoS 2
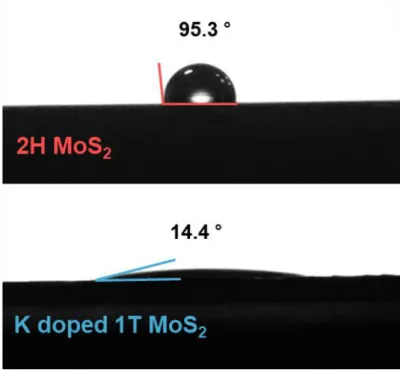
The S 2p peak of K-doped 1T MoS2. Accordingly, apart from the S 2p3/2 peaks of S 2p1/2 and 2H MoS2 in the S 2p scan spectra, two new S 2p peaks were found, further demonstrating the presence of 1T. phase. On the other hand, one can see that K-doped 1T MoS2 changes to hydrophilic properties at 14.4. Therefore, the hydrophilic properties of K-doped 1T MoS2 may be evidence of further improvement in electrochemical performance.26.
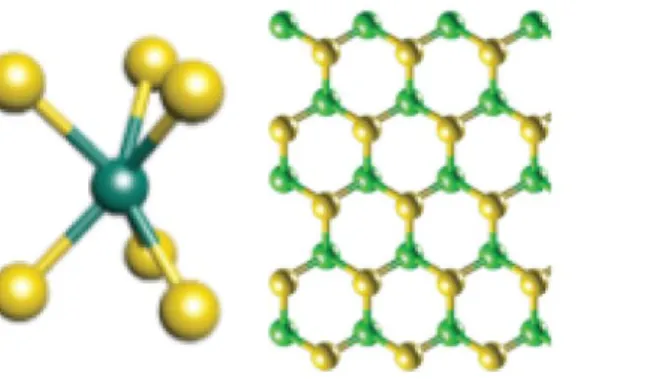
In the K-doped 1T MoS2 sample, the lattice structure of 2H phase in red region (semiconductor, trigonal) and 1T phase in blue region (metallic, octahedral) was observed simultaneously. The Mo-Mo interatomic arrangement of the K-doped 1T MoS2 lattice structure can be clearly observed by the light intensity shown in Figure 1.7d along with a schematic. By analyzing the thickness of the AFM image in Figure 1.10, we confirmed the thickness histogram of K-doped 1T MoS2, and most flakes are 2.52 nm (1-2 layers).
The resulting spectrum and tabular results show that K atoms are doped in unoxidized MoS2. a) Atomic force microscopy (AFM) of K-doped 1T MoS2 on SiO2 substrate. In the K-doped 1T MoS2 sample, the lattice structure of the 2H phase in the red region (semiconducting, trigonal) and the 1T phase in the blue region (metallic, octahetral) were observed simultaneously. After 300 days in air, Raman and UV-vis analyses, shown in Figure 1.14, of the K-doped 1T MoS2 were also examined to confirm the retention of the 1T phase.
The Raman spectra of K doped 1T MoS2 in Figure 1.15a show the maintenance of the 1T phase despite the 532 nm laser irradiation for 10 min. Thus, the electrocatalytic activity of K doped 1T MoS2 was tested in 1 M KOH electrolyte as well as 0.5 M H2SO4 electrolyte. As shown in Figure 1.17 a, d the HER performance and Tafel slope of K doped 1T MoS2, 1T MoS2 (n-BuLi) and 2H MoS2 were compared in acid and alkaline electrolytes.
This suggests that K doped 1T MoS2 has abundant active sites due to the higher phase purity of the 1T phase region than 1T MoS2 (n-BuLi) and 2H MoS2. In addition, K doped 1T MoS2 was also confirmed to have an excellent HER stability (Figure 1.16 h, i, inset: chronoamperometry analysis). The HER stability results of K doped 1T MoS2 suggest that the stability of HER performance is also improved due to the high stability to maintain the 1T phase.
As shown in Figure 1.18, the TOF profiles were measured in both acidic and alkaline solutions, the TOF values of K-doped 1T MoS2, 1T MoS2 (n-BuLi), 2H MoS2 and Pt/C were investigated. Moreover, K-doped 1T-MoS2 has stable performance for 5000 CV cycles and 100 hours due to its high 1T phase stability and 1T phase purity.
Morphology Chracterization of K doped 1T MoS 2
Phase stability of K doped 1T MoS 2
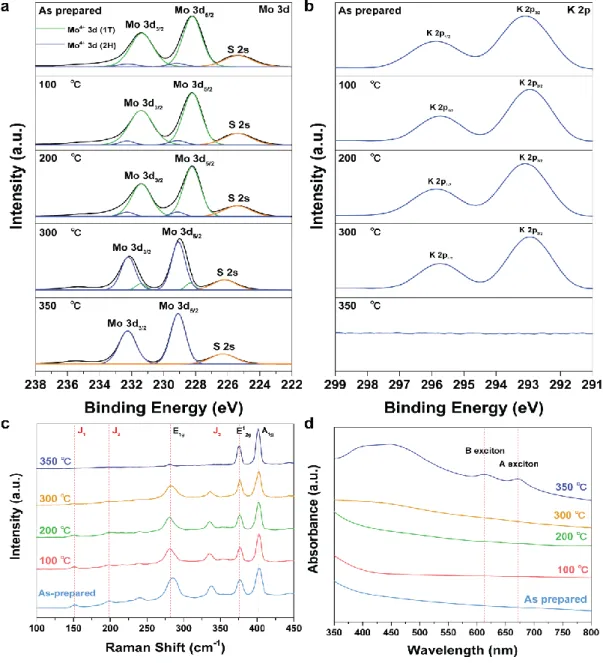
In general, the biggest problem with 1T MoS2 synthesized by n-BuLi intercalation is that the phase easily changes to the thermodynamically stable 2H phase. First, the K-doped 1T MoS2 sample was thermally annealed on a hot plate in an air atmosphere for one hour, and the phase transition was investigated using XPS Mo 3d and K 2p scans in Figure 1.11 a,b. When annealing was introduced and the annealing temperature increased, the 1T fraction of 1T K-doped MoS2 assembled with respect to the peak intensity of the 1T phase lost only about 20% for the sample annealed at 300 °C.
However, when annealing was performed at approx. 350 °C, the 1T phase fraction became 0% and completely changed to the 2H phase. This proves that 1T phase conversion and 1T phase stability due to K atom doping can be improved. In addition, it was found that the high 1T phase stability was dependent on the K atom doping on the MoS2 nanosheets.
In Raman analysis, the peaks J1, J2 and J3 due to the 1T phase were maintained at annealing temperatures up to 300 °C. In addition, the result of confirming the ratio of K doped 1T MoS2 by XPS shows that it has a high thermal stability while maintaining the 1T phase ratio of 74.7% up to 300 °C (Figure 1.12 a). DSC results show that K doped 1T MoS2 has a weight loss of 2.6% due to chemically and physically adsorbed water on the K doped 1T MoS2 surface up to 400.
In general, the reaction from the 2H phase to 1T is exothermic, and the exothermic peak at 350 ℃ means the conversion to the 2H phase. In other words, after the K-S bond is broken at 350℃ and the electron donor is removed, the transition from the 1T phase to the 2H phase is confirmed. Raman analysis showed that the J1, J2 and J3 peaks were still retained, indicating the Raman peak of the 1T MoS2 phase.
The phase transition of K-doped 1T MoS2 is ultrastable under 532 laser irradiation for 10 min. synthesized using n-BuLi completely transitions to the 2H phase when irradiated with a 532 nm laser for 30 seconds, as shown in Figure 1.15 b. The following analysis confirmed that the ultrastable K-doped 1T MoS2 maintains the 1T phase very well with the K atom as an electron donor even in heat, atmosphere and strong laser.
Application of K doped 1T MoS 2 in electrocatalyst
After 5000 cycles of CV, there is no remarkable performance loss for K doped 1T MoS2 with a negligible increase in η10 by 2 mV and 8 mV in 0.5 M H2SO4 and 1 M KOH condition, respectively.
Conclusion
Ion Transport Nanotube Composites with Vertically Aligned Metallic MoS2 for High-Speed Lithium-Ion Batteries. Contributions of Phase, Sulfur Vacancies, and Edges to the Hydrogen Evolution Reaction Catalytic Activity of Porous Molybdenum Disulfide Nanoplates. High-power supercapacitive properties of graphene oxide hybrid films with highly conductive molybdenum disulfide nanosheets.
Gram-scale aqueous synthesis of stable few-layer 1T-MoS2: Applications to visible light-driven photocatalytic hydrogen evolution. Rapid and efficient preparation of exfoliated 2H MoS2 nanosheets by sonication-assisted lithium intercalation and infrared laser-induced 1T to 2H phase reversal. Role of electronic coupling between substrate and 2D MoS2 nanosheets in electrocatalytic hydrogen production.
Prediction of a new phase (T′′) of two-dimensional transition metal di-chalcogenides and strain-controlled topological phase transition. Hydrogen release reaction kinetics by Frumkin adsorption: revisiting the Volmer–Heyrovsky and Volmer–Tafel pathways.