CHAPTER 1 INTRODUCTION
1.1 Background
Solar energy is one type of renewable energy. The source of this energy is unlimited but somehow rarely useable. A lot of research and studies has been done to improve ways of collecting this kind of energy. Demand of energy in industries or even for domestic use will be increasing every year [1]. There is no sign of it slowing down. Human nowadays depend too much on fossil fuel and resources of fossil fuel is getting smaller. This might not sustains the needs of future generations. Thus the solution is to explore alternative energy (Solar Energy).
In book written by Bob Ramlow and Benjamin Nusz title Solar Water Heating, discussion of economical side of using solar water heater has been made [2]. Analysis was done using life cycle cost. They have been comparing costs of domestic solar water heater with conventional electrical water heater. These costs include initial installing cost, maintenance cost and operation cost. Even though the initial installation cost for solar water heater is higher compared to electric water heater, is does not have additional operation cost. Therefore, this solar water heater is an attractive long term investment for every household.
Solar energy can be harvested by using Photovoltaic Cells (PV) and Flat-Plate Solar Collector. This project will specifically focus on harvesting solar energy by Flat-Plate Solar Collector. However, the biggest downfall for using this type of energy is it cannot work without sun. If a plant was utilizing solar energy, it needed backup energy at night to be able to operate. Flat-Plate Solar Collector is able to work in two type of system,
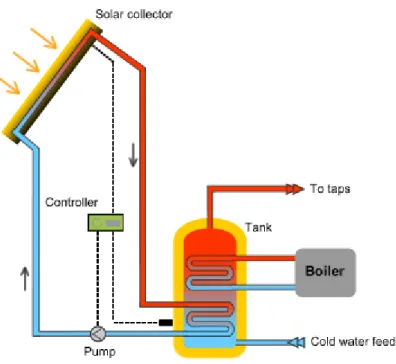
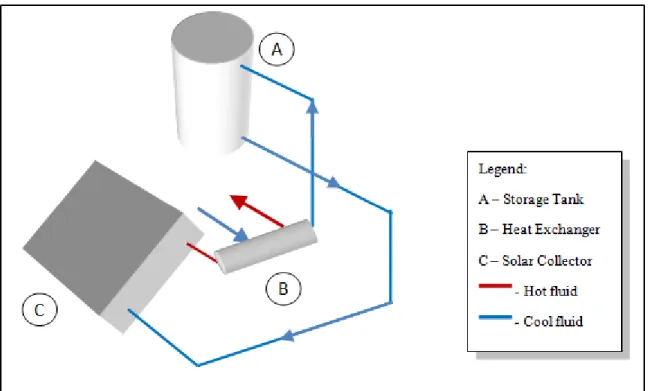
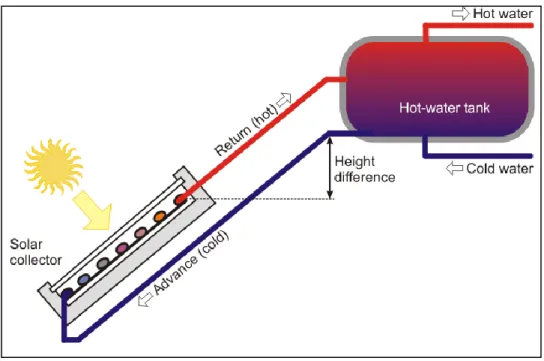
circulate fluid inside it. Active active system need pump to operate. In passive system, the driving force to circulate the fluid is gravitational force and pressure drop caused by changes in density of fluid as it absorbed heat. Figure 1.1 illustrate typical passive system
Figure 1.1: Passive solar water heater
Since system based on solar energy depends on sun radiation to operate, whenever there is no source of sun rays, this system become useless. To add value to solar collector, usage of PCM (Phase Changing Material) was suggested. PCM will store energy in latent heat. This stored energy act as backup when sun rays are not available.
1.2 Problem Statement
Inability of Solar Energy to be used at night is by far the biggest disadvantage of Solar Energy. Thus by integrating PCM into Solar Collector is proposed to prolonged the time of usage of the system when sun are not available (at night). Prototype modeled by Chong Wei Kit (2009) will be evaluated to prove the statement.
1.3 Scope of Studies
The objectives of the project are to:
Design system of Solar Collector
Evaluate the Solar Collector
Enhance the existing prototype.
1.4 Significance of Studies
There are numerous amounts of advantages that will benefits us on this project. The importance of the study will be further elaborated.
1.4.1 Improving Collection of Solar Energy by Flat Plate Solar Collector Solar Energy will always be there as long as the sun shines. But most of the time these source of energy is wasted. The main reason of this is simply we could not find more effective ways of harvesting the energy. For the same reason these source of energy became unattractive to the public. By having an extensive research on this project we could harvest the energy effectively thus increases the reliability of the system.
1.4.2 Cleaner Source of Energy.
Solar energy is one of the cleanest sources of energy that we could get. If the idea of fully utilizing this energy could be implemented, harm on the environment could be controlled. The dependency of fossil fuel causes unimaginable amount of damage to the environment. Reasoning behind this is generation of Carbon Dioxide (CO2) while we generate power using fossil fuel. Drilling of earth to get fossil fuel also contribute to a lot of environmental issues.
CHAPTER 2
LITERATURE REVIEW
2.1 Effects of PCM in Flat Plat Solar Collector
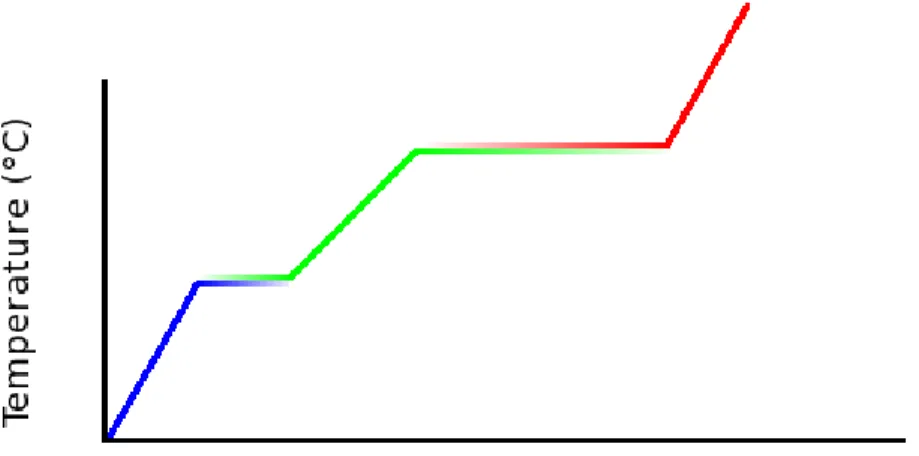
Phase Change Material (PCM) is a substance which possesses a high heat fusion and changes state at certain temperature [4]. PCM could change its state from solid - liquid, liquid –gas and solid – gas. PCM has an ability to store energy in latent heat. Heat can be classified into two; latent heat and sensible heat. Sensible heat is defined as heat absorbed by substance that experiencing temperature elevation. Sensible heat can be sense by human as it involve around temperature rise/ fall. Energy stored during this action known as Sensible Heat Storage (SHS). Latent heat on the other hand cannot be sense. Latent heat is absorbed/ released when substance undergoes phase change.
Energy stored as this situation occurred known as Latent Heat Storage (LHS).
While substance undergo phase change (take solid – liquid transition), there will be no significant changes in temperature. But the substance will be absorbing energy. Energy absorbed by the substance was used to break bonds between its molecules to allow
phase change.
Figure 2.1 Phase Change
The idea of adding PCM to increase capacity of heat storage has been proposed throughout the decades. However not much research been done on it. A group of researcher Eman-Bellah S Mettawee et al. has done an experimental study on compact PCM solar collector [5]. They had done extensive studies on PCM behavior while charging and discharging.
PCM was left to charge fully initially. During charging process, valve that connects water pipe is closed. All energy by sun radiation was used to charge PCM (in this case wax). Important finding in this experiment is PCM is melted layer by layer.
Temperature will increase with low temperature gradient as time goes by. This is due to low thermal conductivity of the wax. The upper layer will melt first followed by layers near to it until all the paraffin melts. The will solidify in layers as well while discharging.
Figure 2.2: First picture exhibit the time contour during charging while the second picture while discharging [5]
Analysis of energy and exergy on solar collector intergrated with PCM has been done by Ahmet Koca et al. Solar collector integrated with PCM was evaluated in two types of efficiency, energy efficiency and exergy efficiency [6]. Analysis was produce base on energy conservation principle (1st Law of Thermodynamics) and irreversibility of a system (2nd Law of Themodynamics). Energy analysis gives energy efficiency of the solar collector which represents the effectiveness of the solar collector in harvesting solar energy. Exergy analysis gives exergy efficiency. Exergy efficiency illustrates possibility of the solar collector to be more efficient by reducing inefficiencies in the system (such as heat lost through heat leakage or back heat loss).
In their solar collector, CaCl2.6H2O was used as PCM. The model use in this experiment consists of solar collector, reflector and tank that fill with PCM. Heat from the collector was transferred to the PCM using Heat Transfer Fluid (HTF). PCM temperatures inside the tank were measured by 11 thermocouples. Each thermocouple was placed at 30mm interval.
Sets of data were taken for 3 consecutive days, (October 7, October 12, and October 15, 2000). 3 graphs were plotted, Stored Energy versus Time of Day (one for each day), Net Energy Efficiency versus Temperature Difference and Net Exergy Efficiency versus Temperature Difference. On every graph of Stored Energy versus Time convey a bell-
shaped curve. However on Oct 12, 2009 was higher compared other days. This can be explained by the intensity of radiation seems to be more intense on that day. Net energy efficiency varied from 38% to 59%. Net exergy efficiency varied from 1.5% to 3.3%.
The highest net efficiency for both is at highest value during noon Oct 12, 2000 explained by the same reasoning.
However Ella Talmasky and Abraham Kribus have a negative impression on PCM as they conducted simulation using TRANSYS [7]. They proposed that PCM does not help enhancing DHW (Domestic Heat Water) system. Comparison was made with two sets of Flat Plate Solar Collector, with and without PCM. PCM has been planted on water storage tank.
Addition of PCM causes the gain of end user negative, which is surprising at first.
However after some consideration this is what to be expected. Energy from water will be absorbed by PCM inside the tank. This occurrence reduces amount of net energy that arrived at the end user. But to conclude the same thing will happen in evaluating Flat Plate Solar Collector enhanced with PCM is a bit too early since the construction of the experiment is different.
2.2 Passive System and Active System 2.2.1 Passive System
Passive system can be defined as a system that thermal energy flow is by natural means (by conduction, natural convection and radiation) [8]. In passive system, flow of the fluid will occur naturally. Active system on the other hand was using pump to circulate the fluid inside the system. Driving force for a passive system was:
Density variation of the flowing fluid
Gravity
Compare to active system, passive system is much more effective and simple.
Active system also required a lot of space compare to passive water heating system. In 1979, G.I Morrison and D.B.J Ranatunga have studied the thermosyphon circulation in solar collector [9]. Objective of the study is to provide flow rate predictions of flow rate thermosyphon cycle and compare the theoretical value with experimental value. Experimental measurement was provided by laser doppler anemometer.
Theoretical value of thermosyphon velocity was derived in term of bulk temperature. Density variation normally was assumed to be linear. However non-linear variation also could occur as derived by Zirrin et.al. Important assumptions in this analysis are:
Flow was assume to be fully develop laminar flow
Thermosyphon head riser was calculated in bulk mean temperature at both inlet and outlet.
However the first assumption was hard to satisfy when the testing was done outdoor. This assumption depended on consistency of intensity of the sunrays.
Flow circuit use in the experimental study consists of simple closed loop thermosyphon with a single riser. Heater was use to simulate sunrays absorption.
Temperature was measured using calibrated thermocouple inserted inside the piping. Storage tank constantly stirred to keep the temperature inside the tank (in between riser outlet and inlet) uniform.
From this study, the theoretical equation overestimate the flow rate value at higher Reynolds’s Number and underestimate flow rate at low Reynolds’s Number. Some suggestions were made by the author to improvise the equation.
The suggestions are:
Include minor losses in the analysis
Use correction for developing flow
By taking account of the friction on a developing flow
S.V Joshi et al. [10] had done a comparative study on the available standard testing for thermosyphon domestic hot water system. Testing mention on the study can be divided into two major group, solar only testing and auxiliary testing. For solar only testing the standard testing mention were CNS B 7277, JIS A 4111 and ISO 9459 (part-2). For the testing with auxiliary heater, standard testing are AS 2984-1987, IS 13129 (part-2) 1991 and ISO 9459 (part-3).
Procedures and basic equations were stated in the journal. Every testing and parameters concerned in it was clearly mentioned.
2.2.2 Active System
In Active system, pump exerts an external force, to provide circulation of the working fluid. An active system would normally consist of solar collector, pump and control system.
Control system in active solar circulation usually uses electronic differential controller. This controller has an ability to turn on/ off pump at preset temperature difference between working fluid in solar collector exit and storage pump. Let’s say that the controller is set to take action whenever at differential temperature of 10oC and above. The pump will be turn on automatically and circulate the working fluid. If the condition is not satisfied, the pump will be turn off automatically. This application is applied to a fixed mass flow rate system. Some sophisticated system has and ability to control mass flow rate depending on differential temperature.
By ensuring the working fluid supplied is at its minimum temperature, stratification is promoted and efficiency of the system can be improved.
Figure 2.3: Closed loop active system
2.3 Indoor and Outdoor Testing
In testing performance of Solar Collector, there are two available options. Testing could be done either using indoor or outdoor testing
2.3.1 Outdoor Testing
This type of testing was done on outdoor environment beneath actual sunrays.
Incident, I of the sunrays can be measure by a pyranometer. This device usually mounted on the solar collector.
Absorption of sunrays by the glazing glass can be explained by Bouguer’s Law.
Bougeur’s law stated that the absorbed radiation is proportional to the intensity of the distance traveled in medium.
IKdx dI
Outdoor testing requires no sophisticated setup. It is cheap. However due to uncertainty of weather, this method could be unreliable. Incident of sunrays also
could vary on daily basis dependent on the cloud presence. The test could be in steady or un-steady depending on the sun condition throughout the experiment.
Temperature in inlet and outlet could vary in some certain range depending on the collector type. Table below will provide possible temperature range that could had occurred during the testing.
Table 2.1: Temperature range for different types of solar collector 2.3.2 Indoor testing.
Indoor testing is another way to assess performance of solar collector. This test was done in a laboratory using equipment known as solar simulator. Bulb in solar simulator imitate sunrays incident. Solar simulator comes in various sizes, spectrum and power, depending on testing needs.
Indoor testing guaranteed a steady condition as the ray’s incident is the same throughout the testing. However, the equipment is expensive and not all laboratories are equipped with it.
Motion Collector Type Absorber Type
Concentration Ratio
Temperature Range, oC
Stationary Flat Plate Flat 1 30-90
Evacuated Tube Flat 1 50-200
Compound Parabolic Turbular 1-5 60-240
CHAPTER 3 METHODOLOGY
3.1 Execution Technique
Project consists of 2 phases. The first phase is to design a workable system of so lar water heater. Detail information on this phase can be seen in Chapter 5. Second part of this project is evaluating the solar collector (Chapter 6).
In the beginning, preliminary design was purposed and reviewed. Some changes were done before fabrication process. This is to eliminate errors in design. Tools such as AUTOCAD and CATIA were used to communicating the ideas among the team. Only after that, the testing was done on the solar collector to evaluate its performance. To done the experiment to evaluate the collector, some measuring devices were to read and collect data. The tools are as following:
Tool Purpose
Data Logger To record various data at various point. The main purpose of utilizing data logger here is to record temperature value at glazing surfaces and PCM temperature. To read temperature data from these surfaces, data logger need to be use together with thermocouple
Thermocouple Thermocouple is attached to surfaces to get its temperature.
Thermocouple comes with different ranges according to its type. In this experiment T type thermocouple will be used. The range is from;;
-200oC to 350oC.
Thermometer To retrieved temperature of working fluid at solar collector inlet and outlet, thermometer will be used.
Flow meter Measure flow rate of the system
Solarimeter Measure amount of radiation of the sunlight. Give reading in W/m2 Table 3.1: Measuring Devices List
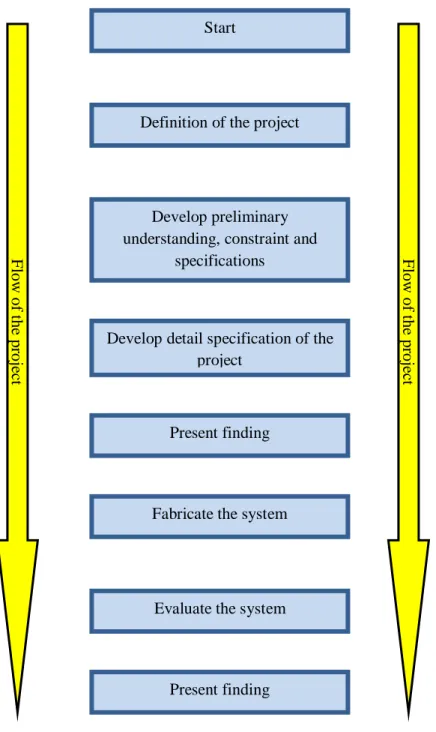
3.2 Execution Flow Chart
Start
Definition of the project
Develop preliminary understanding, constraint and
specifications
Develop detail specification of the project
Present finding
Fabricate the system
Evaluate the system
Present finding
Figure 3.1: Execution Flow Chart
Flow of the project
Flow of the project
3.3 Gant Chart and Suggested Milestone (FYP 1)
Table 3.2: Gant Chart and Suggested Milestone FYP1
3.4 Gant Chart and Suggested Milestone (FYP 2)
Table 3.3: Gant Chart and Suggested Milestone FYP2
CHAPTER 4
MATHEMATICAL REPRESENTATION
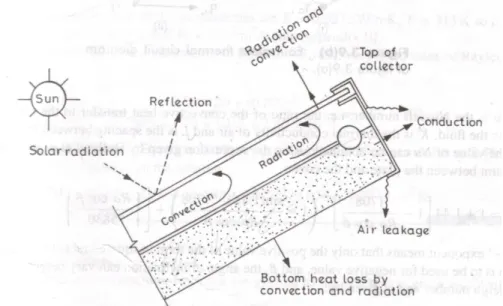
4.1 Losses on the Collector
4.1.1 Top Loss Coefficients
At top layer of the solar collector, heat might loss through radiation and convection.
Figure 4.1: Losses inside a solar collector
Convection Heat Transfer Coefficient
Convection heat transfer between plate and cover can be expressed as:
Where K is the thermal conductivity of the air and L is spacing between glass cover and the plate. Nusselt number, Nu, can be calculated using equation suggested by Buchberg et.al.
L NuK h1c /
, for 1708<Ra cos B <5900 cos ]
1 1708 [ 1446 . 1
1 Ra
Nu
252 .
)0
cos ( 229 .
0 Ra
Nu , for 5900<Ra cos B <9.23 x 10⁴ , for 9.23 x 10⁴<Ra cos B < 106
285 .
)0
cos ( 157 .
0 Ra
Nu
---- (4.1)
---- (4.2) ---- (4.3) ---- (4.4) Figure 4.2: ThermalResistance Circuit
In this equation, parameters labeled as;
β = inclination angle of the solar collector Ra = Raleigh’s Number
While convection heat transfer coefficient in from cover and ambient can be determined by (Watmuff et al.):
Where ;
V = velocity of the wind.
Radiative Heat Transfer Coefficient
Radiative heat transfer coefficient from plate to cover can be computed using:
Where;
Tp =Absorber plate mean temperature Tg = Glazing glass temperature
Effective emissivity, ε eff of the solar collector was calculated using:
This equation is a function of emissivity of the plate and the glazing. While constant σ is a Stefan’s constant (=5.67 x 10⁻⁸ W/m2K4).
Radiative heat transfer coefficient from cover to ambient was calculated using:
V h2c 2.83.0
g p
g p
eff
r T T
T h T
[( 273)4 ( 273)4]
1
] 1
1 1 [ 1
g p
eff
a g
s g
eff
r T T
T h T
[( 273)4 ( 273)4]
2
---- (4.5)
---- (4.6)
---- (4.7)
---- (4.8)
Where Ts, sky temperature value is equal to,
However, to apply this set of equations, value Tg, Temperature of the glass is unknown. Therefore iteration technique shall be used to determine the heat transfer coefficient. First, any value is assumed to be Tg. Top loss heat coefficient, Ut was calculated based on this value, and new value of Tg will be determined based on the calculated Ut, using equation:
This method will be repeated until value of Tg from initial assumption and from equation above are equal.
Sample of iteration will be concluded in the appendix.
Effective top loss coefficient
Heat loss coefficient from plate to cover will be;
4 3 1 1 1
1 1
r h r
h
h c r
Heat loss coefficient from cover to ambient will be;
2 1 2 2 2
1 1
r h r
h
h c r
Top loss coefficient can be represented as:
1 2 1
1]
[1
h h Ut
4. 1. 2 Back Loss Coefficient
Heat loss of the solar collector will be the conduction through the insulation and convection and radiation from the solar collector to the ambient. However the convection and radiation from the solar collector is often neglected. With only considering the conduction through the insulation the equation will be:
6
a
s T
T
1
) (
h T T T U
Tg p t p g
---- (4.9)
---- (4.10)
---- (4.11)
---- (4.12)
---- (4.13)
in in
b L
k U R
4
1
In this equation;
Ub = back loss coefficient
kin = effective thermal conductivity of the insulation Lin = thickness of the insulation
4. 1. 3 Edge Loss Coefficient
For well designed collector, the edge loss will be small and can be predicted through:
c edge
e A
U UA
Where,
Ue= edge loss coefficient Aedge= edge area Ac= collector area
4. 1. Overall Losses
Overall losses coefficient of the solar collector will be the summation of the top loss coefficient, back loss coefficient and edge loss coefficient.
e b t
L U U U
U
Heat losses throughout the collector can be represented as:
)
( p a
L c
L AU T T
Q
---- (4.14)
---- (4.15)
---- (4.16)
---- (4.17)
4. 2 Heat Absorbed by PCM
Heat absorbed by the PCM is depending on time PCM exposed. The heat transfer could occur in 3 phases, which are:
Solid phase
In this phase heat received from the solar collector is stored as sensible heat.
Temperature of PCM will increases as time increases. PCM will continue storing heat as sensible heat until it reaches melting point, Tmelt..
Solid – Liquid phase
Temperature of PCM stays constant during the transition. Heat is stored as latent heat. Temperature stays constant until all the PCM changes it phases.
Liquid phase
Same as inn solid phase, energy are stored as sensible heat.
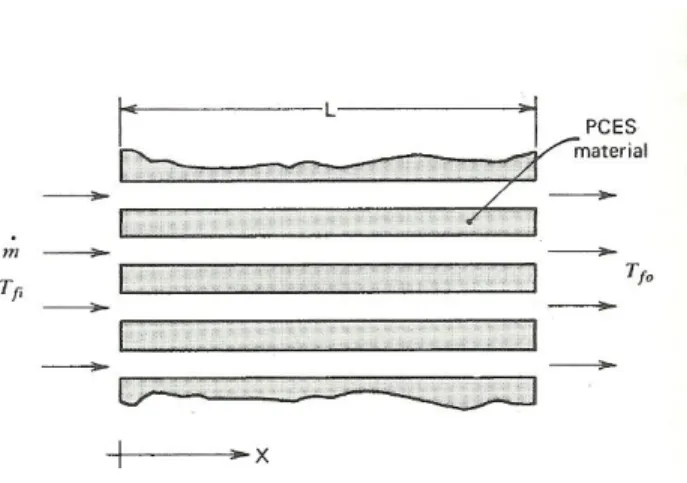
Morrison et.al has developed a model which applicable to phase change material in container with L, length in flow direction and A, cross sectional area with P, wetted perimeter. The heat transfer passes through the PCM with
.
mmass flow rate with certain inlet temperature. This model is illustrated as following:
Figure 4.3: Model by Morrison et.al Model was based on three (3) assumptions, which are:
Heat losses from bed is negligible
This provide energy balance equation on the material as )
2 (
2
T A T
UP x
T k t u
f
Where u = internal energy,
ρ=density of the phase change material U= overall heat transfer coefficient Tf= Circulating fluid temperature Energy balance on the fluid is
) (
.
f f
f f f f f
f T T
C A UP x
T A m t
T
Subscript f denotes the properties of the heat transfer fluid.
Specific internal energy of the PCM can be represent by these sets of equation, depending on T*, melting temperature of the PCM
*
*
*
*
*
*
T T if ) (
) (
T T if )
(
T T if ) (
T T C T
T C u
T T C u
T T C u
f ini
s
ini s
ini s
Cs and Cl terms in this equation are specific heat at solid and liquid condition. While λ is specific latent heat for the PCM and χ is the liquid fraction of the PCM. Tini is reference temperature where internal energy is equal to zero.
---- (4.18)
---- (4.19)
---- (4.20) ---- (4.21) ---- (4.22)
4. 3Useful Energy, Qu
Useful energy, Qu is some amount of energy from the solar irradiance transferred and heat up the working fluid. Qu is calculated using
) (
.
in out f
u mC T T
Q
Where;
m = mass flow rate of the working fluid
cp = specific heat of the water
Tin, out = Temperature at inlet and outlet of the solar collector Mass flow rate value might vary due to:
External devices such as pump and valve opening
Difference of height, depending on how high will the supply tank will be relative to the solar collector
Frictional losses in the piping and risers
---- (4.23)
CHAPTER 5 DESIGN CRITERIA
5. 1Conceptual Design
Figure 5.1: First Conceptual Design
Figure 5.1 illustrated a closed loop thermosyphon cycle of a solar collector. The cycle has two loop of flowing liquid. The first loop of the working fluid is a loop that connects tank and the solar collector. Cool water from the tank will flow through the solar collector. Heating in the solar collector provide natural circulation potential from buoyancy effect of the fluid. The fluid came out as a hot water and flows into the heat exchanger.
The second loop in this cycle is movement of coolant inside the heat exchanger. Main purpose of the heat exchanger is to remove heat from water so that the working fluid will be at its initial temperature. This will improved the capabilities of working fluid to absorbed heat via solar collector itself.
Since the motion of fluid occurs naturally (thermosyphon), water storage tank has to be position above the solar collector itself to counter losses in friction and heat losses. Or else the working fluid would not be able to flow.
Figure 5.2: Second Conceptual Design
Instead of using closed loop cycle, opened loop thermosyphon cycle is suggested.
Figure 5.2 explain the water flow in the system. Heat exchanger is eliminated in this design. Working fluid is used only once. After it came out from the solar collector, heated water is eliminated from the system (to discharge). Cool water is constantly added to make up for the loss. Eliminating the heat exchange makes the cycle simpler.
External tubes connection has to be at least 1.9mm to avoid large viscous effect of the fluid, it the cycle was using water. This viscous effect is a major contributor of frictional losses in the cycle. However, both of the designs are not workable. The losses in the collector and the piping are so large that it requires for the storage tank to be raised up in certain impossible height.
5. 2 Detail Design
Since purposed design using thermosypon system failed to provide enough energy to keep the working fluid moving, a pump is added to helps circulation. The cycle now is an active cycle. Mass flow rate of the system is dependent on mass flow rate of the pump.
Supply tank and solar collector both are mounted on an adjustable platform. This gives control in variance of:
Tank Height – control the amount of potential energy (by height) of the working fluid
Solar Collector Angle – provide ability to track sun
System governs two tanks, containing hot and cool water respectively. In hot water tank, the water only flows out after it reaches some height after certain time. Since the tank is not insulated, lagged in time provide some heat losses due to natural convection process. Additional water is added to bring down the working fluid temperature lower.
5. 3 Material Selection
Materials used for fabrication of tank and platform is summarized and justified in the 5.1 table.
Item Material Justification
Tank Fiberglass - Material chosen has to be stiff to withstand water weight. Fiberglass is strong enough to hold the weight. It also light weight and durable.
- Properties of material is as following
Young Modulus, G = 72 GPa
Tensile Strength, σ = 3.45 Gpa
Poisson’s Ratio, v = 0.22
Density, ρ = 0.1 g/cm3
- Price of a fiberglass material is fairly cheap and attractive.
Platform Carbon Steel - Construction of the platform was made out of carbon steel beam by welding. Thus weld ability aspect of the material is very important.
- High density of the material results in heavier weight. This gives the platform more stability.
CHAPTER 6
EXPERIMENTAL DESIGN
6. 1 Purpose of the Experiment
In order to evaluate solar collector, experiment is required to obtain some data.
Parameters that crucial in solar collector evaluation are:
Mass flow rate of working fluid, m
Temperature at solar collector inlet and outlet, Ti and To
Temperature of glazing, Tg
Temperature of PCM, TPCM
Insolation Data, I
Parameters can be obtained by using equipment purposed earlier in Chapter 3.
6. 2 Material Constant and Properties
Important properties of materials such as PCM properties, water properties and solar collector properties are tabulated as in Table 6.1, Table 6.2 and Table6.3.
Properties of Water
Property Value Unit
Density, ρ 1000 kg/m3
Specific Heat, Cp, @ 20oC 4.1818 kJ/kg.K
Viscosity, v, @20oC 0.001 Pa.s
Table 6.1: Properties of Water
Properties of PCM, Sunoco P116
Property Value Unit
Melting Point 50 oC
Specific Heat (Solid), Cs 2.1 kJ/kg.K
Specific Heat (Liquid), Cl 2.1 kJ/kg.K
Heat of Fusion, λ 226 kJ/ kg
Density (Solid), ρs 930 kg/m3
Density (Liquid), ρl 830 kg/m3
Thermal conductivity, k 0.24 W/m.K
Table 6.2: Properties of PCM
Properties of Solar Collector
Property Value Unit
Transmissivity (glass), τ 0.84 -
Absorptivity (copper, black paint) - Thermal Conductivity (rockwool), kr 0.0372 W/m.K Thermal Conductivity (wood), kw 0.1 W/m.K Thermal Conductivity (asbestos), ka 0.1105 W/m.K Thermal Conductivity (cooper), kc 386.0 W/m.K
Collector Area,Ac 0.96 m2
Table 6.3: Properties of Solar Collector
6. 3 Detail Experimental Procedure
Experiments are suggested to be executed in three conducts. In the first experiment, the solar collector is evaluated without PCM material at constant collector angle and tank height. This served as a basis of the evaluation. Second experiment will follow the same procedure with addition of PCM. Efficiency of solar collector from both experiments will be calculate and compared. The procedure of experiment 1 and 2 is as following:
1. Start experiment in the right solar time.
2. Take data (Temperatures, Irradiance and water mass flow rate) from measurement devices (thermocouples, thermometer, solarimeter and volumetric flow meter) in every one hour interval until sunset. Note down the value in Table 6.4 provided.
3. For experiment two, prolonged the observation time by 2-3 hours (after sunset) to observed the effect of PCM
4. Take data for one hour interval until working fluid and PCM reaches thermal equilibrium (temperature of the two bodies are the same)
5. Calculate useful energy, Quseful using equation 4.3 6. Calculate total energy absorbed.
Qtotal = IA,
Where, I = Solar Radiation A =Solar Collector Area
7. Calculate the efficiency of the system using equation:
Efficiency, η = 𝑄𝑢𝑠𝑒𝑓𝑢𝑙
𝑄𝑡𝑜𝑡𝑎𝑙
In the third experiment, solar collector angle is adjusted to provide maximum irradiance value. This adjustment of angle is somewhat similar to sun tracking. The experiment procedure is as below:
1. Make sure the solar collector is facing east before the experiment started.
2. Start the experiment as soon as sun appears
3. Take data (Temperatures, Irradiance and water mass flow rate) from measurement devices (thermocouples, thermometer, solarimeter and volumetric
flow meter) in every one hour interval until sunset. Note down the value in table 7.5 provided.
4. Adjust solar collector angle by 15o.
5. Raised the tank position to be above the solar collector.
6. Repeat step 3,4, and 5 until working fluid and PCM reaches thermal equilibrium (temperature of the two bodies are the same)
7. Calculate useful energy, Quseful using equation 4.3 8. Calculate total energy absorbed
9. Calculate the efficiency of the system
To ensure safety during experimentation, some precautions are taken. The precautions are listed as following:
Avoid touching hot surfaces such as pipes and tank with bare hand
Never positioned hands on the surface of solar collector to avoid burn
As the solar collector is jacked up at certain angle, it will leave some spaces between the collector and its platform. Do not put hand there. There is no guarantee that the jack would not failed.
Date:
Surface Area of the Collector:
Table for data collection in Experiment 1 & 2 Time Solar
Intensity (W/m2)
Mass Flow Rate (kg/s)
Ambient Temperature, Ta, (oC)
Inlet
Temperature Ti, (oC)
Outlet Temperature To, (oC)
Useful Energy Gain, Qu(W)
Total Energy Gain, Qt (W)
Glass
Temperature, Tg (T)
Pcm
Temperature
7 – 8 8 – 9 9 – 10 10 – 11 11 - 12 12 – 1 1 – 2 2 – 3 3 – 4 4 – 5 5 – 6 6 -7 7-8 8-9
Table 6.4: Table for data collection in Experiment 1 & 2
Date:
Surface Area of the Collector:
Experimental Efficiency Table
Time Inclination Angle
Solar Intensity (W/m2)
Mass Flow Rate (kg/s)
Ambient Temperature, Ta, (oC)
Inlet
Temperature Ti, (oC)
Outlet Temperature To, (oC)
Useful Energy Gain, Qu(W)
Total Energy Gain, Qt (W)
Glass
Temperature, Tg (T)
Pcm
Temperature
7 – 8 15 8 – 9 30 9 – 10 45 10 – 11 60 11 - 12 75 12 – 1 90 1 – 2 105 2 – 3 120 3 – 4 135 4 – 5 150 5 – 6 165 6 -7 180 7-8 horizontal 8-9 horizontal
Table 6.5: Table for data collection in Experiment 3
CHAPTER 7 CONCLUSION
Introduction of phase change material in a solar collector is supposed to increases the reliability of solar collector. This could be the answer to overcome the limitation of solar energy application, lacked of reliability as it very dependable on sun. PCM has ability to stores heat in latent heat form, which allows this material to be a back up source whenever sun radiation is not sufficient to kept the cycle running.
In this project a series of studies has been conducted. This project focuses on developing a working solar thermal system. Conceptual designs of the solar thermal system have been submitted. Limitations and errors of the conceptual designs have been corrected. This correction had been a fundamental of the final design.
Design has been developed and fabricated. This final design has been implemented and integrated with Chong’s solar collector model. However due to delayed in fabrication, testing on the collector cannot be achieved. This study however had concluded how the testing should be carried out. An extensive instructions and calculation of the experimentation is concluded.
CHAPTER 8 RECOMMEDATION
Realizing there is such a big potential in solar energy, there is a lot of modification can be done to improve this whole system. One of the potential is to add transparent honeycomb material in between glazing glass and absorber plate. This addition will reduce air movement in that hollow area. With restriction of movement of air, convection loss can be minimized. Other than that, a proper well designed fin of absorber plate could help enhanced the collector. Purpose of fin is to promote heat transfer of the absorber to the PCM. However there must be balance in them. Over design might result in less useful energy transfer to the working fluid thus resulting in low efficiency of solar collector.
The setback of PCM is that the material is low on thermal conductivity a low thermal diffusivity. This set back reduces PCM capabilities in absorbing energy as the hat being transfer at lower rate. Problems can be tackled by composite PCM material. Addition of metal particles inside the PCM will enhanced the capabilities of PCM receiving heat.
Testing using two-phase working fluid is more likely if the researcher insisted on eliminating pump and uses thermosyphon cycle. By doing so, buoyancy effect of the working fluid will be dominant thus overcome fluid friction in the suggested experimentation. However, the cycle needed to be closed cycle and leakage of the working fluid could be harmful
REFERENCES
1. Jeffrey Gordon (2001).Solar Energy: The State of Art, ISES Position Papers, Published:
James & James , pp 224-286
2. Bob Marlow and Benjamin Nusz. Solar Energy Water Heating (2006), Published: New Society Publisher, pp 15
3. Tom Doggett and Ayesha Rascoe (2009). Global Energy Demand Seen Up to 44 Percent by 2030. Retrieved: August 10, 2009 from: http://www.reuters.com/article/GCA- GreenBusiness/idUSN2719528620090527
4. Retrived from: http://en.wikipedia.org/wiki/Phase_Change_Material
5. Eman-Bellah S. Mettawee, Ghazy M.R Assassa (2004). Experimental Study of A Compact PCM (Phase Changing Material) Solar Collector. Retrieved: August 9, 2009 from:
http://www.sciencedirect.com/science?_ob=ArticleURL&_udi=B6V2S-4HYMY1T- 1&_user=1196560&_coverDate=11%2F30%2F2006&_alid=984840860&_rdoc=1&_f mt=high&_orig=search&_cdi=5710&_sort=r&_docanchor=&view=c&_ct=2&_acct=C 000048039&_version=1&_urlVersion=0&_userid=1196560&md5=0ef6d2ca8696a373 ee6d1cdd378d387d
6. Ahmet Koca, Hakam F. Oztop, Tansel Koyun, Yasin Varol (2007). Energy and Exergy Analysis of a Latent Heat Storage System with Phase Change Material for a Solar
Collector. Retrived: September 13, 2009 from:
http://www.sciencedirect.com/science?_ob=ArticleURL&_udi=B6V4S-4NNYFYC- 2&_user=1196560&_rdoc=1&_fmt=&_orig=search&_sort=d&_docanchor=&view=c&
_searchStrId=1067127252&_rerunOrigin=google&_acct=C000048039&_version=1&_
urlVersion=0&_userid=1196560&md5=ff6c840a20907664ce9131692d3e9c88
7. Ella Talmasky and Abraham Kribus. (2008).PCM Storage for Solar Domestic Hot Water (DHW): Unfulfilled Promise? Retrieved: August 9, 2009, from:
http://www.sciencedirect.com/science?_ob=ArticleURL&_udi=B6V50-4SFY3WR- 1&_user=1196560&_coverDate=10%2F31%2F2008&_alid=984843781&_rdoc=11&_f mt=high&_orig=search&_cdi=5772&_sort=r&_docanchor=&view=c&_ct=11&_acct=
C000048039&_version=1&_urlVersion=0&_userid=1196560&md5=f9e51bd3454f98b e97f8875d245e755f
8. Retrieved from: http://en.wikipedia.org/wiki/Passive_solar
9. G.L Morrison and D.B.J Ranatunga (1979). Thermosiphon Circulation in Solar Collectors.
Solar Energy, Vol 24, pp 191- 198. From:
http://www.sciencedirect.com/science?_ob=ArticleURL&_udi=B6V4S-45460WR- 8&_user=1196560&_rdoc=1&_fmt=&_orig=search&_sort=d&_docanchor=&view=c&
_searchStrId=1067139405&_rerunOrigin=google&_acct=C000048039&_version=1&_
urlVersion=0&_userid=1196560&md5=2b980e8443826b5a397cb0b28dd78091
10. S.V Joshi, R.S Bokil, J.K Nayak (2005). Test Standard for Thermosyphon type Solar Domestic Hot Water System: Review and Experimental Evaluation, From:
http://www.sciencedirect.com/science?_ob=ArticleURL&_udi=B6V50-4DJBGT2- 8&_user=1196560&_rdoc=1&_fmt=&_orig=search&_sort=d&_docanchor=&view=c&
_searchStrId=1067142355&_rerunOrigin=google&_acct=C000048039&_version=1&_
urlVersion=0&_userid=1196560&md5=20bc7436d410ff38d3b6811f55e22064
G.N Tiwari (2002), Solar Energy: Fundamentals, Design, Modelling and Applications, Published: Alpha Science Int. Ltd, pp 94- 218
Yunus A. Cengel and Michael A. Boles (2006).Thermodyna,mics: An Engineering Approach.
Published: McGraw-Hill Pp: 631-734
Yunus A. Cengel and John M. Cimbala (2006).Fluid Mechanics: Fundamental and Applications Published: McGraw-Hill
John A.Duffie and William A. Beckman (2006) Solar Engineering of Thermal Processes Published: John Wiley
Greg F. Naterer (2002). Heat Transfer in Single Phase and Multiphase System Published: CRC Press
![Figure 2.2: First picture exhibit the time contour during charging while the second picture while discharging [5]](https://thumb-ap.123doks.com/thumbv2/azpdforg/11085206.0/6.918.174.859.107.390/figure-picture-exhibit-contour-charging-second-picture-discharging.webp)