CHAPTER 1 INTRODUCTION
1.1 BACKGROUND OF STUDY
Several commercial CO2 capture plants were constructed in the late 1970s and nearly 1980s in the US. When the price of oil dropped in the mid-1980s, the recovered CO2 was too expensive for Enhanced Oil Recovery (EOR) operations, forcing the closure of these capture facilities.
However, the North American Chemical Plant in Trona, CA, which uses this process to produce CO2 for carbonation of brine, started operation in 1978 and is still operating today. Several more CO2 capture plants were subsequently built to produce CO2 for commercial applications and markets. Some of these plants took advantage of the economic incentives in the Public Utility Regulatory Policies Act (PURPA) of 1978 for “qualifying facilities”. A listing of the major CO2
capture plants are shown in Table 1.
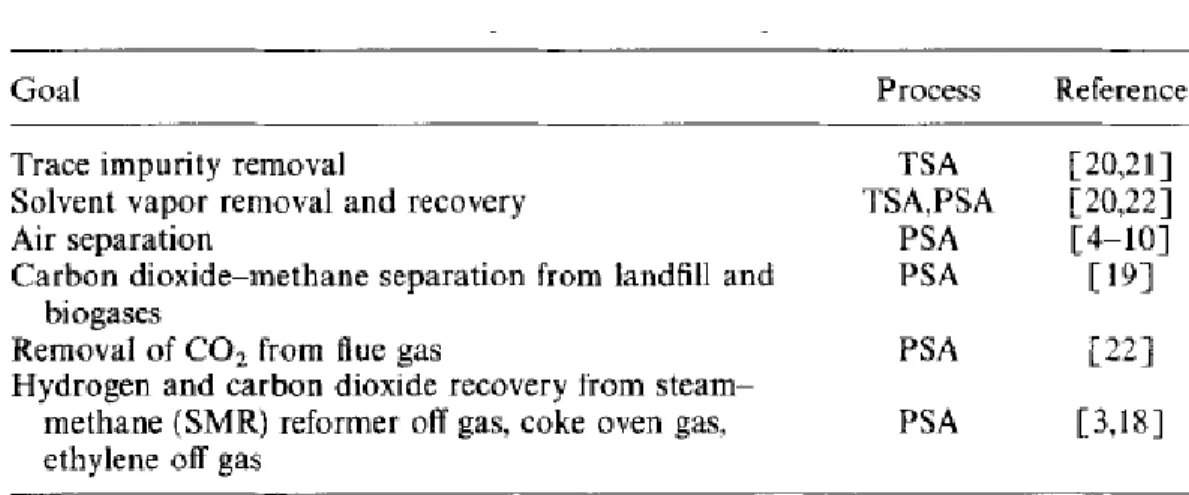
Table 1: Key commercial applications of activated carbons in the gas separation and purification industry
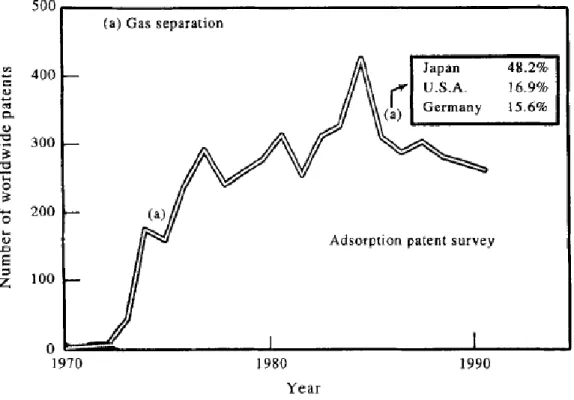
Separation and purification of gas mixtures by adsorption has become a major unit operation in the chemical and petrochemical industries. The phenomenal growth in this area is demonstrated by Figure 1, which plots the number of worldwide patents on gas separation by adsorption issued every year during the last twenty years. The two main reasons for this development are (a) the commercial availability of a large spectrum of microporous adsorbents (zeolites, activated
carbons, aluminas, silica gels, polymeric adsorbents), with varying pore structures and surface properties, which can be used to selectively adsorb specific components of a fluid mixture, and (b) the possibility of designing many different process schemes under the generic category of pressure swing adsorption (PSA) and thermal swing adsorption (TSA), for a given separation need, using the available adsorbents. The technology has evolved to be extremely versatile and flexible, owing to the large choice of adsorbent materials and their use in the design of innovative separation processes.
Figure 1: Adsorption Pattern Survey
Currently, the desire to alleviate the problem of global warming has resulted in the environmental concern over a reduction of greenhouse gas emissions from industrial sources.
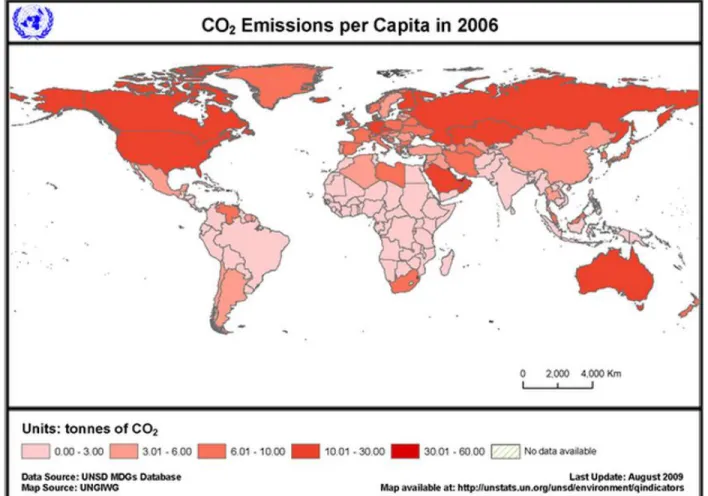
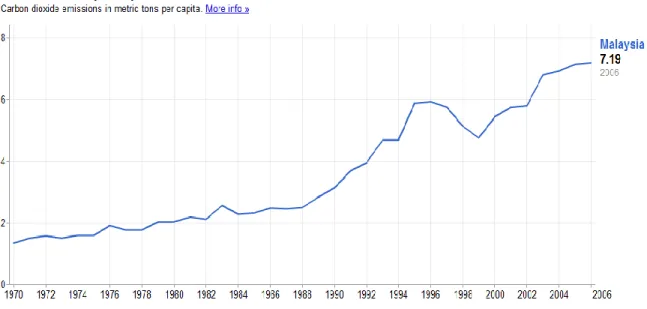
The major greenhouse gases contributing to problem are methane (CH4), carbon dioxide (CO2), nitrous oxide (N2O) and halogens such as chlorofluorocarbons (CFCs) and hydrofluorocarbons (HFCs) from feed gas released by chemical plants. Among these, CO2 is the primary contributor to the problem due to its abundance, and is thus a major target for reduction. The following figures show the statistic of CO2 emission per capita in all countries in the world and in Malaysia respectively.
Figure 2: CO2 Emissions per capita in all countries in 2006
In general, to economically separate CO2 produced from power plants, one must first produce a relatively pure, high pressure stream of CO2. There are exceptions to this rule, some of which will be explored later in this paper. The process of producing this CO2 stream is referred to as separation and capture, which encompasses all operations that take place at the power plant site, including compression. The idea of separating and capturing CO2 from the feed gas coming into the power plants did not start with concern about the greenhouse effect. Rather, it gained attention as a possible economic source of CO2, especially for use in enhanced oil recovery (EOR) operations where CO2 is injected into oil reservoirs to increase the mobility of the oil and, therefore, the productivity of the reservoir.
Figure 3: CO2 Emissions per capita in Malaysia from 1970 to 2006
Excessive emission of carbon dioxide into the atmosphere is greatly inducing global warming.
To reduce the excessive CO2 emissions, there is great interest in capturing CO2 and utilizing it as a flooding agent for enhanced oil recovery (EOR). Based on current technologies, the gas separation through absorption with a chemical reaction process using wetted activated carbon is considered to be one of the most cost effectives and has the best proven operability record.
1.2 PROBLEM STATEMENT
Remarkable difference is observed in the CO2 adsorption behaviour at the temperature of hydrate formation from CH4/CO2 feed gas mixture at comparative pressures. The adsorption difference and the effect of pore dimension on the adsorption behaviour come from the fact that CO2 is a subcritical gas, therefore, is condensable and partially soluble in water whereas CH4 is a supercritical gas and neither condense nor dissolve in water. The CO2 hydrates formed in the wet-activated carbon at much lower pressure and reached much higher sorption capacity than methane is remarkably affected by pore sizes and water content of the activated carbon when becomes wetted with water.
However the former thermodynamic data available for CH4/CO2 adsorption systems are insufficient for further experimental works to prove its effectiveness towards separating CO2 to a greater extent. The detailed process design with suitable operating condition and using wetted activated carbon are not yet available. Therefore, the problem was detected here that is to determine the effective operating pressure and temperature for separation process to occur and to measure the effectiveness of using wetted activated carbon instead of the normal way of using dry granular activated carbon as the adsorbent.
There is a very crucial to need alleviate the CO2 emission in the air or to environment and this can only be cultivated if the separation process proposed meet the environmental regulation as supposed by many gas experts nowadays, or in other word to create the most effective yet environmental friendly and economically attractive way of separating CO2 using adsorption.
All in all, this research is carried out based on the specifically explained criteria above toward developing another brilliant way of separating CO2 using the newly-developed way of using wetted activated carbon as the adsorbent for the adsorption of CO2 from feed gas.
1.3 OBJECTIVES AND SCOPE OF STUDY
The aim of the project is to conduct a study which will utilize the experimental means available at Universiti Teknologi PETRONAS to CO2 from feed gas composition of CH4/CO2 using experiments using wetted activated carbon as the adsorbent.
The main objectives of this research are:
To investigate the effect of water-preloaded activated carbon towards CO2 adsorption capacity.
To choose the preferable methodology which to apply in the laboratory scale
To conduct the experimental work in the laboratory and analyse the result to determine the effectiveness of wetted activated carbon in CO2 separation from feed gas.
This research project will consist of experimental studies, coupled with relevant engineering analyses to represent the findings more accurately.
CHAPTER 2
LITERATURE REVIEW
2.1 Feed Gas
The essential elements of solvent selection criterion are feed gas characteristics (composition, pressure, temperature, etc.) and the treated gas specifications (i.e. the process requirements).
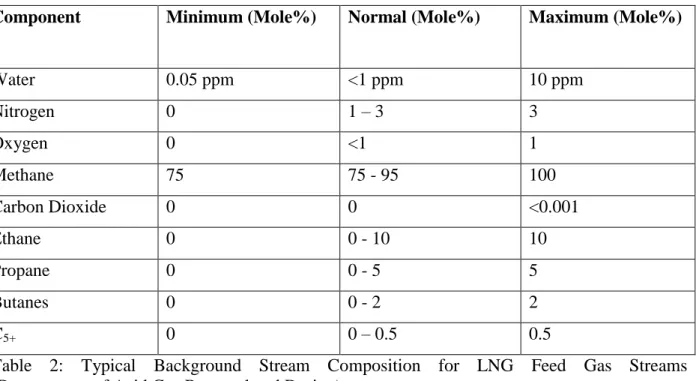
These two elements provide a preliminary evaluation of the solvent working capacity which may, however, be influenced by several other elements such as solvent characteristics and operation issues of the separation process. The following table shows the typical background steam composition for LNG feed gas streams.
Component Minimum (Mole%) Normal (Mole%) Maximum (Mole%)
Water 0.05 ppm <1 ppm 10 ppm
Nitrogen 0 1 – 3 3
Oxygen 0 <1 1
Methane 75 75 - 95 100
Carbon Dioxide 0 0 <0.001
Ethane 0 0 - 10 10
Propane 0 0 - 5 5
Butanes 0 0 - 2 2
C5+ 0 0 – 0.5 0.5
Table 2: Typical Background Stream Composition for LNG Feed Gas Streams (Downstream of Acid Gas Removal and Drying)
The components of feed gas mixture source-separated domestic gas supplies studied for the first major in operation. Methane, carbon dioxide and C6-C11 hydrocarbons were determined by gas chromatographic methods. The content of methane was found to be just over 70% (v/v). The major polluting hydrocarbon in the feed gas was carbon dioxide (CO2) to be separated in a Pressure Swing Adsorption (PSA) at a constant room temperature in the range of 27oC to 30oC using wetted activated carbon as the adsorbent.
The project consists of experimental study to compare the performance and effectiveness of the separation of carbon dioxide, CO2 from a feed gas mixtures of methane-carbon dioxide (CH4- CO2) with certain ratios using both dry granular and wetted activated carbon at pressures of 30 and 60 bars respectively to investigate the effect of operating conditions towards the separation performances at different operating pressures comparatively. The equilibrium adsorption data of CO2 and CH4 on an activated carbon with a wide pore-size distribution are to be collected at the temperature of an approximated hydrate formation in the presence of water.
2.2 Adsorption
Adsorption is one of the most popular separation processes by which the adsorbent removes substances from water. Defined, adsorption is "the collection of a substance onto the surface of adsorbent solids." It is a removal process where certain particles are bound to an adsorbent particle surface by either chemical or physical attraction. Adsorption is often confused with absorption, where the substance being collected or removed actually penetrates into the other solid.
Adsorption is a unit operation in which surface-active materials in true solution are removed from the solvent by inter-phase transfer to the surfaces of an adsorbent particle. This process is used in environmental engineering practice for removal of various pollutants such as soluble organics, dyes, pesticides, lignin, etc., from wastewaters and for removal of colour and taste and odour producing substances from natural waters that are to be used as potable water supplies.
2.2.1 Adsorption Cycle
The adsorption cycle is of utmost important criterion used to select an appropriate adsorbent technology for CO2 separation. There are three mostly popular methods to achieve adsorption- desorption among gas applications, namely:
1) Temperature-swing Adsorption (TSA) 2) Pressure-swing Adsorption, and (PSA) 3) Vacuum-swing Adsorption (VSA)
Above all these three popular adsorption techniques, TSA is one of the oldest and widely-used techniques for the regeneration of the adsorbent. TSA uses an increase in temperature to achieve desorption and regenerate the adsorbent; however, the regeneration cycle is slower than other methods because the heating process is slow.
Pressure-swing adsorption (PSA) is another adsorption technique useful for gas separation. With PSA cycles, the adsorption step is performed under elevated pressures and the regeneration is achieved by subsequent pressure reduction. PSA cycle times are on the order of several minutes;
whereas TSA cycles are measured on the order of hours or days.
The last but not least adsorption method is known as vacuum-swing adsorption (VSA). VSA cycle times are on the same level as the PSA cycle, but the regeneration is achieved by very low absolute pressures (vacuum).
2.2.2 Adsorption Equilibrium and Kinetics
Adsorption equilibrium data is plotted in the form of an adsorption isotherm (i.e. at constant temperature) with the mass adsorbed on the y-axis and the mass in the fluid on the x-axis.
"Favorable" isotherms permit higher solid loadings at lower solution concentrations. Isotherms which start out flat are "unfavorable", since they only work well at high concentrations of solute.
Usually, as temperature increases the amount adsorbed decreases.
Adsorption efficiency decreases over time and eventually activated carbon will need to be replaced or reactivated. Isotherms are empirical relations, which are used to predict how much solute can be adsorbed by activated carbon.
Several fits have been proposed for isotherms. A linear isotherm seems to work for very dilute solutions. The three most well known isotherms are the Freundlich, Langmuir and Linear. In environmental engineering and specifically drinking water treatment application the most commonly used isotherm is the Freundlich. The Freundlich isotherm describes physical adsorption from liquids and can also be used for the adsorption of hydrocarbon gases on activated carbon.
Shown to the right is the Freundlich isotherm equation in general form. The empirical equation for describing Freundlich isotherm is shown in Equation 1, where X is the mass of solute
adsorbed, M is the mass of adsorbent, Ce is the equilibrium concentration of solute, and K, n is the experimental constant.
Equation 1: Freundlich empirical equation
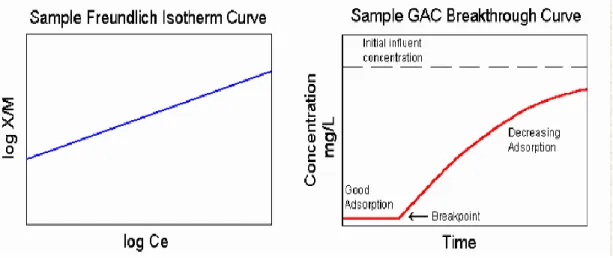
The two graphs below illustrate a general Freundlich isotherm equation and a sample breakthrough curve. Each individual type of GAC has its own isotherm curve and breakpoint characteristics. These help to predict the adsorptive capacity of particular activated carbons and give a design estimate for adsorptive life. Reactivation becomes necessary once the breakpoint has been reached.
Figure 4: Freundlich Isotherm
Another verily known isotherm is called Langmuir isotherm, given by;
Equation 2: Langmuir empirical equation
The isotherm assumes that the number of adsorption sites is fixed and that adsorption is reversible. There also other equation used to fit the isotherms data such as Toth Isotherm, Sips Isotherm and BET Isotherm.
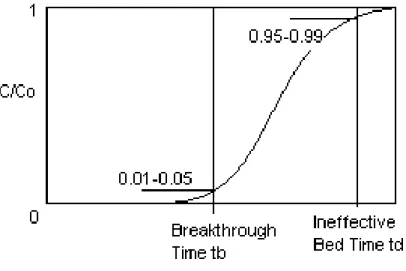
Adsorption equilibrium can only tell the amount of adsorbate that can be adsorbed or adsorbent capacity but not the rate or kinetics of adsorption. Knowledge of both equilibrium and kinetics of adsorption is required for the sizing of an adsorption bed or column. Adsorption kinetics study is done based on the breakthrough curve plotted from experimental data. Below is the example of a breakthrough curve;
Figure 5: Breakthrough Curve
2.3 Phase Behaviour of Carbon Dioxide
(Source: http://science.uwaterloo.ca/~cchieh/cact/c123/phasesdgm.html)
The phase diagram of CO2 has some common features with that of water: sublimation curve, vaporization curve, triple point, critical temperature and pressure. The temperature and pressure values of are unique to carbon dioxide. The phase diagrams of water and carbon dioxide are compared here.
(a) Phase diagram of water (b) Phase diagram of CO2 Figure 6: Phase diagrams of (a) water and (b) CO2
The triple point of carbon dioxide occurs at a pressure of 5.2 atm (3952 torr) and temperature of 216.6 K (-56.4oC). At temperature of 197.5 K (-78.5oC), the vapor pressure of solid carbon dioxide is 1 atm (760 torr). At this pressure, the liquid phase is not stable, the solid simply sublimates. Thus solid carbon dioxide is called dry ice, because it does not go through a liquid state in its phase transition at room pressure.
The critical temperature for carbon dioxide is 31.1°C, and the critical pressure is 73 atm. Above the critical temperature, the fluid is called super-critical fluid. To be more precise, the various points of the phase diagram are further described below.
In the phase diagram of (a) H2O and (b) CO2, the axes are not drawn to scale.
In (a), for water, note that;
(1) the triple point, A (0.0098°C, 4.58 torr),
(2) the normal melting (or freezing) point, B (0°C, 1 atm), (3) the normal boiling point, C (100°C, 1 atm), and (4) the critical point, D(374.4°C, 217.7 atm).
In (b), for carbon dioxide, note that;
(1) the triple point X (-56.4°C, 5.11 atm),
(2) the normal sublimation point Y(-78.5°C, 1 atm), and (3) the critical point Z (31.1°C, 73.0 atm).
2.4 Activated Carbon as Adsorbent
The reason that activated carbon is such an effective adsorbent material is due to its large number of cavernous pores. These provide a large surface area relative to the size of the actual carbon particle and its visible exterior surface. An approximate ratio is 1 gram = 100 m2 of surface area.
Activated carbon adsorption proceeds through 3 basic steps;
1) Substances adsorb to the exterior of the carbon granules 2) Substances move into the carbon pores
3) Substances adsorb to the interior walls of the carbon
Activated carbon is a highly porous carbonaceous substance with a wide range of applications in gas, vapour, and liquid treatment. Activated carbons offer a large spectrum of pore structures and surface chemistry for adsorption of gases, which are being used to design practical pressure swing and thermal swing adsorption processes for separation and purification of gas mixtures.
The activated carbons are often preferred over the zeolitic adsorbents in a gas separation process because of their relatively moderate strengths of adsorption for gases, which facilitate the desorption process. Futhermore, it is intended to use a very cheap adsorbent in experiments for feasibility sake. Its commercial applications are such as the following;
1) Tracing impurity removal from a contaminated gas source
2) Production of hydrogen from a steam-methane reformer for off gas 3) Production of nitrogen from air
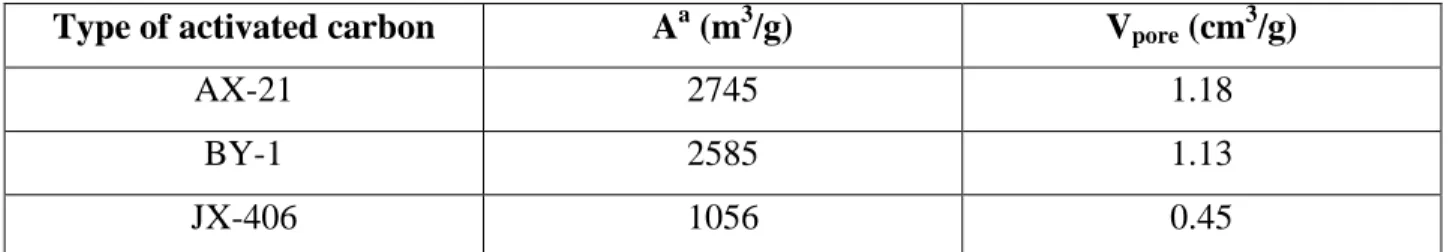
There are numerous types of activated carbon in the market. Listed are several that are most commonly used in the industry nowadays and their area-volume pore distributions;
Type of activated carbon Aa (m3/g) Vpore (cm3/g)
AX-21 2745 1.18
BY-1 2585 1.13
JX-406 1056 0.45
Table 3: Types of activated carbon in the market with their area-volume pore distributions (Type BY-1 is the most commonly used activated carbon, coming from a coconut shell)
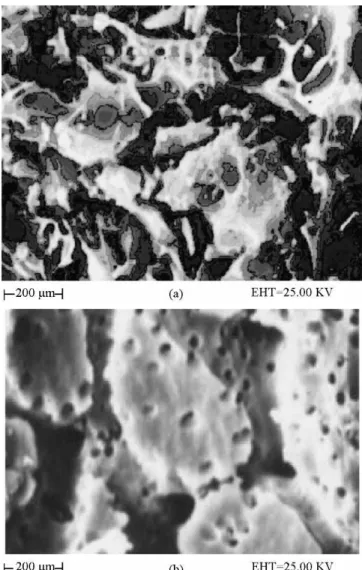
Figure 7: (a) Scanning electron micrograph (SEM) of AC.
(b) Scanning electronmicrograph (SEM) of AC–S.
The use of activated carbon dates back to 1500 BC where its use was discovered in an Egyptians papyrus for medicinal purposes. Activated carbon is used successfully today, especially in water treatment to remove organic compounds that impart colour, taste and odour to the water.
Contaminant removal is achieved through a process called adsorption by which contaminants adhere to the surface of the carbon and are thus removed from the water.
Activated carbon in very fine powder or granular form is useful to purify both water and air. It is an extremely porous material with high ratios of surface area to unit weight up to 100 acres per pound. Activated carbon has particular affinity to organic materials such as solvents used in printing inks and common coatings. When the carbon particle becomes saturated with the contaminant, the exit stream will evidence a "breakthrough" of that contaminant, at which time the canister will be replaced and/or reactivated (usually by heat). The objective of this experiment is to investigate the adsorption properties of activated carbon by studying the adsorption kinetics and operational characteristics of a lab-scale packed-bed reactor.
The adsorbent used for adsorption is desired to have good adsorption and desorption properties.
Apart from these, an essential feature of the adsorbent is its electrical conductivity. Activated carbon fibre materials have emerged as a new type of adsorbent promising for CO2 capture due to their attractive characteristics, such as large surface area and micropore volume. They are also semi-conductive. Activated carbon fibre materials also have a variety of forms and can be shaped into a solid block, a honeycomb monolith and cloth. Luo et al. (2006) have conducted a thorough comparison of some morphologies of activated carbons, including monolith, beads and fibre cloth.
Wetted activated is predicted to have more effective adsorption capacity and remarkable effect towards more significant amount of CO2 separating from the feed gas mixture. Since the adsorptive storage of the feed gas coming from natural gas on dry granular activated carbon is based on the principal of supercritical adsorption, the carbon surface can be monolayerly covered by the adsorbates. There must be some portion of the pore space that has not been utilized for the storage purpose. However if the carbon is wetted some quantity of water, methane could form from inside the pores under certain conditions, which is thermodynamically called hydrates.
The conditions that promote that formation of methane hydrate is to be determined and then subsequently implemented to achieve the objective of the project hereafter. Meanwhile, the adsorption of methane still happens on the free surface and thus, both surface and the pore spaces could have been utilized. The total quantity of methane stored per unit mass of is approximately increased by more than 63%. This predicts that when the storage capacity increases, the pore size increases which increases the contact of the adsorption reaction taking place resulting in a faster and more effective reaction.
2.5 Analysis of Current Treatment Technologies for CO2 Separation
Analysis of current treatment technologies for CO2 separation is done here to compare the advantages and disadvantages of the methods that can be manipulated to overcome the problems faced by using the proposed method of this project which is the adsorption of CO2 using wetted activated carbon. There are several types of existing CO2 separation methods to be discussed and compared between one and the other on this section, There are namely;
1) High Pressure CO2/CH4 Separation Using Carbon Molecular Sieve Hollow Fiber Membranes
2) CO2 capture by electrothermal swing adsorption with activated carbon fibre materials membrane separation
2.5.1 High Pressure CO2/CH4 Separation Using Carbon Molecular Sieve Hollow Fiber Membranes
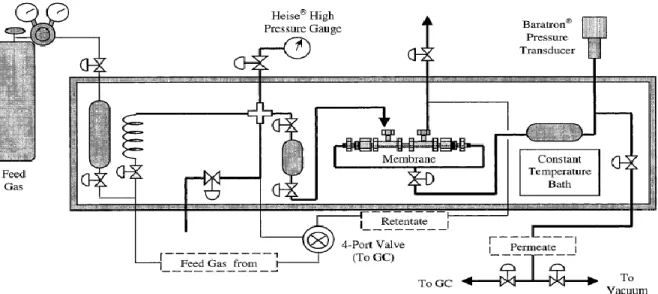
Carbon molecular sieve (CMS) hollow fiber membranes have been investigated for CO2/CH4 separation. High-pressure (up to 1000 psia), mixed-gas feeds of 10% CO2/90%
CH4 on the shell side were examined for three different temperatures (24, 35, and 50 °C).
The mechanical, permeance, and selectivity stabilities of the CMS membranes under high pressure were encouraging and could be industrially relevant for many high-pressure applications, such as CO2 removal from natural gas. Two asymmetric polyimide
precursor fibers, 6FDA/BPDA-DAM and Matrimid 5218, were pyrolyzed under vacuum to form the CMS membrane fibers. When pyrolyzed under identical protocols, the two types of CMS fibers had different permeation properties and physical characteristics.
Modifications of the pyrolysis protocol and conditions were explored. Increasing the final pyrolysis temperature was shown to dramatically increase the CO2/CH4 selectivity (>600) of the CMS membranes but was detrimental to the CO2 permeance. On the other hand, using a helium purge gas instead of a vacuum environment during pyrolysis did increase CO2 permeance but resulted in a significant loss of CO2/CH4 selectivity. Shortening the thermal soak time at the final pyrolysis temperature was the most effective approach to increasing the CO2 permeance while maintaining the CO2/CH4 selectivity. CO2/CH4
separation, which is industrially important in natural gas processing, is one such application and is the focus of this work.
Figure 8: High-pressure permeation system.
Advantages and Disadvantages
Carbon molecular sieve (CMS) membrane materials are attractive alternatives because due to several aspects, but mostly importantly because;
1) They offer very high selectivities and productivities
2) Effectively working for high-temperature and high-pressure applications.
3) Of their high internal surface areas and adsorptive capacities, carbon materials are not new to gas separation applications and have been used successfully in adsorption processes where kinetic separation can be achieved through diffusivity differences of gases.3-6.
However, there is insufficient ongoing research into the use of carbon molecular sieves as size and shape selective membrane materials that can capitalize on separations of differently sized gas molecules. Increasing temperature reduces the sorption levels of both gases, but increases the gas diffusion of both CH4 and CO2. As a result, the permeances for both gas molecules increase with higher temperatures as expected, and the selectivity decreases as CO2’s sorption advantage becomes less significant.
Because partial pressures and not fugacities are customarily used to calculate permeance (and permeability), the data do not truly reflect the actual thermodynamic driving force.
When CO2 fugacities are used, the downward slope of the CO2 permeance is significantly less, though still present.
.
2.5.2 CO2 Capture by Electrothermal Swing Adsorption with Activated Carbon Fibre Materials
This paper presents progress made in CO2 capture by electrothermal swing adsorption (ESA) with activated carbon fibre materials. The current barrier in CO2 capture and storage is the high cost of CO2 separation and capture. CO2 capture by electrothermal swing adsorption can potentially be more energy effective than conventional temperature swing adsorption (TSA) and pressure swing adsorption (PSA), thus reduces CO2 capture
cost. Activated carbon fibre materials have been utilised as the adsorbents due to their demonstrated capabilities for CO2 capture and their good electrical conductivity. This paper reviews the major results in the literature in the development of activated carbon fibre materials and the process of ESA. It also suggests future research directions in CO2 capture by electrothermal swing adsorption.
Chemical absorption is considered the most widely used process for separation of carbon dioxide in post-combustion flue gases. The process operates on the basic principle of mass transfer with reaction. Separation is achieved through a reversible acid-base reaction between carbon dioxide and an alkaline reagent. Carbon dioxide forms a slightly acidic solution when it is absorbed by water. With the addition of an alkaline reagent to the solution, carbon dioxide will react, increasing the driving force of CO2 transfer from the gas phase into the solution. Once reacted, it can be regenerated by reversing the reaction.
The most common reagents used are alkanolamines, such as monoethanolamine (MEA), diethanolamine (DEA), and diispropanolamine (DIPA). Alkanolamines remove CO2 from the gas stream by the exothermic reaction of CO2, making it desirable to keep the temperature as low as possible for absorption.
Figure 9: Temperature changes of activated carbon fibres as a function of input voltage (reproduced from Moon and Shim, 2006).
Advantages and Disadvantages
Compared with the TSA and PSA approaches, ESA has the following advantages;
1) Direct heat can be delivered to the sample due to the in situ heating with no extra heat needed to heat the ancillary parts.
2) The flow rate of the carrier gas and the heating rate of the sample can be controlled independently and thus be optimised.
3) The heating rate can be very fast and not limited by the heat capacity of the heating medium or the heat transfer rate between the heating medium and the adsorbent in comparison with TSA.
4) Internal heating of ESA can provide better desorption kinetics and dynamics due to the same direction of heat and mass fluxes. (Petkovska and Mitrovic, 1994).
`
However, there are several limits to ESA approach. The followings are the disadvantages or the problems faced;
1) When current intensity is sufficiently high, an increase in current intensity will have very little advantage in terms of regeneration efficiency. In other words, there is little difference in applying time of these currents. Hence, energy input is higher in the case of higher current.
2) Since electrothermal swing adsorption is essentially temperature swing adsorption, all these appealing characteristics of higher current may be due to its corresponding higher energy input. If that is the case, the effect of current intensity has to be re-evaluated.
3) From a limited research effort on energy intensity, it is found that regeneration efficiency increases with increasing energy input when an excessive energy input has very little influence.
4) Electricity was not passed through the whole period of the desorption test. And it is found that when energy input was the same, the test with a higher current but a shorter applying time of electricity performed better in terms of regeneration efficiency. The reason is not provided.
2.5.3 PRISM® Membranes as a Gas Scrubber for CO2 Removal from Feed Gas
PRISM® membranes is used as a gas scrubber for natural gas in Air Produts Company (http://www.airproducts.com). PRISM membranes, based on simple process designs, lower costs, and the other benefits listed below, provide an attractive alternative to traditional amine systems. PRISM membranes can also be used as a bulk-removal device to minimize the size of an amine system. The benefits become even more pronounced as the industry produces natural gas from very remote locations.
This small CO2 removal system was engineered and built by Petreco. It incorporates the latest PRISM membrane technology and is designed to remove CO2 from natural gas. Its capacity is 8 MMSCFD, and it is designed to reduce the CO2 level from 4.5% to less than 2%. It was commissioned in July 2004.
Figure 10: Recovery of CO2 from associated gas in enhance oil recovery (EOR) programs (Acid gas removal from natural gas)
Prism membranes will effectively separate carbon dioxide from hydrocarbon vapors.
Performance is highly depended on CO2 content in the raw feed gas, CO2 specification in product, supply pressure, permeate pressure, and operating temperature. To accurately determine the separation and membrane size for your specific application Air Products
uses a proprietary computer model to provide you with a complete heat and material balance.
Several factors determine the required pretreatment of the gas. A filter coalescer or mist eliminator vessel with a high efficiency coalescing element is required to remove entrained liquid in the feed gas. A feed heater is required to superheat the gas and maintain constant operating temperature and constant membrane performance. A mist eliminator and heater are sufficient pretreatment in many cases. If other contaminants may be present such as methanol, amines, very high molecular weight or waxy hydrocarbons, or corrosion inhibitors, Air Products should be consulted for other pretreatment recommendations. Particulate filtration of the feed gas is not required. The shell-side fed Prism membranes have sufficient open flow area to prevent plugging from rust, pipe scale, and other particulates typically found in natural gas streams.
However, a temporary conical strainer is recommended during the commissioning period to remove any weld slag or excessive amounts of debris which may be in new piping.
Air Products will provide a standard Piping and Instrumentation Diagram (P&ID) showing recommended control systems and instruments on the membrane and pretreatment equipment. Air Products will review and approve customized control systems with the system packager to provide any special control requirements.
With proper operation and maintenance the membrane should last for the life of the project. If replacement becomes necessary usually due to fouling with contaminants, the membrane internal module can be easily replaced.
Air Products provides membranes to the oil and gas industry through OEM partners. The OEM partner designs and constructs the complete skid-mounted package including pretreatment equipment, membrane housings, piping, valving, instrumentation, and control systems. Air Products works closely with our OEM partner to deliver a quality system that meets the requirements of the application.
Air Products provides a standard warranty for performance one year from start-up or eighteen months from purchase date, provided the membrane and pretreatment equipment
have been properly operated and maintained. The very same PRISM® membranes scrubber has been used in the Petronas Fertilizer Kedah with very much the same principles of the CO2 separation is applied till nowadays.
Benefits and Disadvantages
The application of PRISM® membranes as scrubber for CO2 separation has several attractive benefits, such as;
1) Ideal for remote locations with limited utilities.
2) Flexibility to explore process flow sheets with various product gas compositions.
3) No moving parts mean minimal maintenance costs.
4) No additional hazardous chemicals, like amines, to cause environmental complications.
5) Lightweight and compact.
6) Easy to install and operate.
There are significant limitations to the application of the membrane in which it can operate over a certain range of pressures and temperatures. Temperatures up to 195°F (90°C) and differential pressures over 1000 psi are typical. The maximum absolute feed pressure is limited only by the mechanical design pressure of the ANSI flanges on the pressure vessel. Besides, Air Products provides a standard warranty for performance one year from start-up or eighteen months from purchase date, provided the membrane and pretreatment equipment have been properly operated and maintained
2.6 Study on the Formation of Methane Hydrate in the Wet Activated Carbon
Methane hydrate is a kind of clathrates. Water molecules are the main part of hydrate and form a polyhedron cage structure at low temperature and/or high pressures. Spherical crystal vacancies, which have a strong ability to absorb small molecules and form hydrates, form in the interior space of the cage structure. The pore space, if the dimension is appropriate, is certainly favorable for the formation of the cage structure of water molecules due to the interaction of the pore surface with the water molecules. Therefore, better dynamic behavior was observed in the charging tests compared to that reported for the water media.
Three types of methane hydrate structures were recognized in nature:
1) type I, 2) type II, and 3) type H
(also referred to as sI, sII and sH in literature).
The type I hydrate is most widely distributed in nature. It has a cubical crystal structure including 46 water molecules and at most 8 methane molecules. Type II has a rhombic crystal structure including 136 water molecules and at most 24 methane molecules. Type H has a hexagonal crystal structure including 34 water molecules and at most 6 methane molecules. The general molecular formula of methane hydrates can be written as CH4 ÆxH2O, where x = 5.75 for type I and 5.667 for type II and H.
There is no doubt about the formation of methane hydrate in the pore spaces since NGH was discovered naturally in the pore spaces of different porous materials, and its formation in the water-wetted porous materials was also realized in the laboratory. An analysis of the charged amount explicitly shows how hydrate formation affects the storage capacity of the wet
carbon. The total methane maintained in the container can be classified into free methane and fixed methane. Assuming Vt is the total volume of the container, it must
be the sum of three parts:
Where;
Vc : volume occupied by the skeleton carbon and can be determined by helium expansion when carbon is dry;
Vw: volume occupied by water and was calculated from the water ratio and the density of water (1.0 g/cm3);
Vv: volume of void space and was obtained by subtracting Vc and Vw from the known value of Vt.
The stored methane in the void space is called free methane. The quantity of free methane per unit mass of dry carbon, nf, could be calculated based on the values of temperature, pressure and volume Vv through the relation nf = pVv/zRT, where z is the compressibility factor
and was determined by the virial equation. All the other parts of stored methane are thought to be fixed, nx,
Where:
nt: experimentally measured total quantity of methane stored in the wet carbon na : amount adsorbed, and
nh: amount contained in hydrate
2.7 Economic Evaluation and Feasibility Review
It is found that activated carbon monolith has the lowest pressure drop, highest permeability and the lowest cost among the three morphologies investigated. These attributes are very important from a practical point of view as they can significantly reduce the capital and operating costs of a system. Hence, integrating the adsorption method with activated carbon fibre materials holds the promise for significant reductions in CO2 separation cost.
CHAPTER 3 METHODOLOGY
3.1 Materials
The experiment requires a set of chemical materials that are a must in order for the whole project to be done in an experimental condition. The adsorbent used is a type of granular activated carbon which is sieved, washed of fines, and dried to constant weight at approximately 105°C.
Gas supplies consist of carbon dioxide (CO2), Helium (carrier gas for Gas Chromatography) and Nitrogen while the only liquid material used is distilled water.
3.2 Apparatus
The apparatus that are used in this experiment are: volumetric flasks, laboratory shaker, balance, glass column, pump, spectrophotometer, stopwatch, solution holding tank, assorted tubing, and glassware. Other mechanical apparatus are CPG (gas chromatograph) ; DG (thermal mass flow controller) ; DL (coriolis liquid flow controller) ; Dév (pressure’s plug) ; E (heat exchanger) ; M (CH4-CO2 mixture) ; P (pressure controller) ; T (temperature) ; VD3 et VD3’ (liquid flow control valves) ; VP1 (gas pressure control valve) ; VP3 (liquid pressure control valve) ; VP4 (boiler pressure control valve).
3.3 Sample Preparation
Sample of dry granular activated carbon let is put into the adsorption column, K2 (The sorbent container used is a stainless steel cylinder). The adsorption column is then closed and the feed gas mixture of CH4-CO2 with a ratio 3:2 is let into the column at constant flow rate of 1 L/min.
At pressure of 30 bar, the feed gas will initially bypass the adsorption column and flows directly into the Gas Chromatography for the first run. A sample will be analysed from the gas chromatograph diagram to determine the composition of the gas mixtures. The adsorption process will be started at 30 bars. A composition profile will be recorded at an interval of 5 minutes. The experiment will stop when there is no change of the output composition of the gas mixtures and when there is no flow of gas bubble obtained or detected by the solenoid. The
experiment is then will be repeated for the pressures of 60 bar. The operating steps are then repeated for the feed gas mixture of CO2- CH4 with ratios of 3:2 and 1.4 respectively (Table 4).
CO2 (NL/min) CH4 (NL/min)
3 60% 2 40%
2 40% 3 60%
1 20% 4 80%
Table 4: Feed gas ratios to be used / flow rates of CO2- CH4 mixture
Subsequently, the experiment is continued by using the wetted version of activated carbon.
Firstly, the sample of dry granular activated carbon is submerged into water for 24 hours.
The activated carbon becomes wet as the result of water pre-loading process during the time period it is stays in the water. The sample is then tossed for an hour and put into the adsorption column, K2 after the main equipment is purged a certain period of time. The water content in wet samples was quantified with water ratio, Rw, the weight of water to carbon. Based on the effect of water ratio on adsoption observed in the previous study [Journal of Colloid an Interface Science 322 (2008) 22-26], the water ratio was kept constant at 1.3 in the present work. Purity of Helium (the carrier gas of Gas Chromatogprahy), methane and carbon dioxide used in this experiments was higher than 99.995%. The whole experiment is run for operating pressures of 30 and 60 bars while the temperature is maintained at room temperature.
3.4 Mode of Operation
The first mode of operation is the evacuation mode that takes place at the beginning stage when the samples are prepared. The circuit is evacuated before the transfer of gas stream is let through a vacuum pump and other main equipments. This is necessary to avoid any tracks of air bubbles which could negatively influence the process. The second mode of operation is named as the purging mode. In this mode of operation, the pressure swing adsorption column, K2 is purged with Nitrogen, N2 for a certain period of time in order to prevent any lingering gaseous compounds which do not escape into the air by the period of time the equipment is not run. Last but not least, the third mode of operation applied throughout the experiment is the isothermal mode. Feed gas is injected at constant room temperature in the range of 27oC to 30oC and then a by-pass system takes place over the columns. CO2 concentration inlet in the module is measured every 10 minutes by the gas chromatography. Steady state is reached at the end of 30-45 minutes (Lu and al., 2006). Then, by-pass system tips up in order to allow the measure of CO2
concentration a the outlet of the module to be captured in a gas chromatograph diagram.
Note:
The only tool / equipment used in this experiment is a whole set of Gas Adsorption Column Unit (GACU). The feed gas samples are taken in 0.51 cylindrical glass vessels with valves at both ends. Separation and quantitative determination of CH4, CO2, N2 and O2 are performed using a gas chromatograph (Perkin-Elmer 3920B) with gas injection valves, two different columns, and a hot-wire detector (200°C, 150 mA). Methane, N2 and O2 are analyzed on a column (170 cm x 1/8" o.d.) packed with the molecular sieve 13X as the stationary phase. Carbon dioxide is subsequently determined using a column (190 cm x 1/8" o.d.) with the porous polymer HayeSep Q (60-80 mesh) as the stationary phase.
The separations are performed isothermally at the room temperature which is in the range of 27oC to 30oC with helium (25 ml min-1) as the carrier gas of the Gas Chromatography (GC).
The maximum temperature of Gas chromatography is approximately 200oC.
The injected feed gas volumes were 290 J.LI (13X column) and 190 J.LI (HayeSep Q column).
3.5 Experimental Procedures
3.5.1 Standard Operating Procedure
Experiment is run by opening valves V23, V26, V27, V32, V16a, V11, V47, V48, V33, V17a, V17 and V20 and making sure that valves V2 2, V19, V34, V39, V14 and V15 remained closed. Helium is used as the carrier gas. The flow of helium is opened for approximately 10 minutes and the compositions of inlet gas are checked from time to time in the Gas Chromatography (GC). The following logical diagram depicts the whole process route in a standard operating procedure.
Figure 11: Standard procedure of PSA
3.5.2 Pressure Swing Adsorption (PSA) Procedure
Pressure Swing Adsorption is taking place throughout the experiment for the whole entire time except for the regeneration process. The flow of gas is let through the pressure swing column, K2 for the purpose. Valves V11 is moved into a direction towards a booster pump to boost up the pressure drop across the column. Valves V12, V13, V15, V17, V17a, V20 and V48 are opened while valves V14, V16, V33, V31 and V47 are ensured to remain closed. As the flow of gas stream is maintained to be kept going through the column, a pressure is built inside it by increasing the pressure regulator at the back of the main equipment. Booster pump is then turned on to obtain the desired pressure which is approximately 30 bar at the first part of the experiment and is then turned off afterwards.
3.5.3 Regeneration Procedure
Regeneration process is first run using vacuum pressure by opening valves 41, V40, V39, V33, V48, V20 and V49 and making sure that valves V41, V17a, V17, V32 and V34 remained closed. Vacuum pump is turned on and the experiment is run for approximately 30 minutes and the compositions of outlet gas are checked in the Gas Chromatography (GC). Valves V33 and V39 are then closed while valves V17 and V20 are let opened.
The second regeneration is done at pressure of 30 bar for both procedures of activated carbon. Valves V33, and V39 are opened while valves V17a, V32, V34 and V42 are closed. The vacuum pump is turned on and then turned off after approximately 30 minutes. The flow rate is adjusted to according to Table 4 for the ratio of feed gas mixture of CH4-CO2. Valves V17 and V20 are then opened while valves V16 and V19 are closed (both steps are done simultaneously by two persons). Transmitters FIC 02 and FIC 04 are then opened to enable data to be taken. The data result at FI06 is noted for every 10 seconds until the value is constant. Gas Chromatography (GC)box will start operating when the button “run” is pushed on GC screen indicator to measure the composition of gas mixture.
CHAPTER 4
RESULTS AND DISCUSSION
4.1 Major Feed Gas Components
The result of the project covered is the feed gas mixture of CH4-CO2 with a ratio of 2:3 respectively. There are two main parts: (1) Separation of CO2 using dry granular activated carbon and; (2) separation of CO2 using wetted activated carbon.
4.1.1 Separation of CO2 using Dry Granular Activated Carbon
For pressure of 30 bar
Time (min)
Area of CH4 (µV.s)
Area of CO2 (uV.s)
Total Area (µV.s)
Composition of CH4 (%)
Composition of CO2 (%) 0 157159.36 314288.76 471448.12 33.33 66.66 10 158234.64 313087.56 471322.2 33.57 66.43 20 159709.01 310212.24 469921.25 33.99 66.01 30 168132.37 297567.24 465699.61 36.10 63.90 40 170292.38 279238.87 449531.25 37.89 62.12 50 179382.23 247292.38 426674.61 42.04 57.96 60 181234.32 213877.32 395111.64 45.87 54.13 70 181234.32 213877.32 395111.64 45.87 54.13 80 198234.12 267899.3 466133.42 42.53 57.47
Table 5: Data tabulation for separation of CO2 using dry granular activated carbon at pressure of 30 bar
The data tabulated are then plotted into a graph of time CO2 versus outlet composition at pressure of 30 bar as depicted in Figure 12.
Figure 12: Graph of Time versus CO2 Outlet Composition using Dry Activated Carbon at Pressure of 30 bar
At time, t = 0, there is no adsorption of CO2 taking place. Adsorption of CO2 takes place at t = 10 until the values of the outlet composition of CO2 becomes constant at t = 60 min. The value of outlet CO2 composition becomes constant until t = 70 min which means that the adsorption of CO2 has come to an optimum point.
For pressure of 60 bar
Time (min)
Area of CH4 (µV.s)
Area of CO2 (µV.s)
Total Area (µV.s)
Composition of CH4 (%)
Composition of CO2 (%) 0 305328.72 639577.52 944906.24 32.31 67.69 10 317669.28 625675.09 943344.37 33.67 66.33 20 320418.1 620094.48 940512.58 34.07 65.93 30 336264.74 595134.48 931399.22 36.10 63.90 40 341234.76 558237.78 899472.54 37.94 62.06 50 356764.46 494234.76 850999.22 41.92 58.08 60 361758.39 427954.64 789713.03 45.81 54.19 70 361758.39 427954.64 789713.03 45.81 54.19 80 362423.64 423754.64 786178.28 46.10 53.90
Table 6: Data tabulation for separation of CO2 using dry granular activated carbon at pressure of 60 bar
The data tabulated are then plotted into a graph of time versus CO2 outlet composition at pressure of 30 bar as depicted in Figure 13.
Figure 13: Graph of Time versus CO2 Outlet Composition using Dry Activated Carbon at Pressure of 60 bar
At time, t = 0, there is no adsorption of CO2 taking place. The initial value of outlet CO2
composition is 67.69%. Adsorption of CO2 takes place at t = 10 until the values of the outlet composition of CO2 becomes constant at t = 60 min. The value of adsorbed CO2 composition becomes constant until t = 70 min which means that the adsorption of CO2 has come to an optimum point.
The resulting data for pressures of 30 bar and 60 bar are then combined into the following graph to compare the effect of operating pressures towards the adsorption of CO2.
Figure 14: Graph of Time versus CO2 Outlet Composition using Dry Activated Carbon at comparative pressures of 30 bar and 60 bar
Based on the graph plotted, the data plotted result in a less significant exponential decrease in the amount of outlet CO2 composition when the pressure is increased. When the pressure is increased from 30 bar to 60 bar, the flow rate of the gas increases which results in a reduced residence time which leads to lower outlet CO2 composition as time increases. From t= 60 to t = 70, the CO2 outlet composition does not change with time for both pressures. However, at t = 80, the amount of CO2 outlet composition at pressure of 30 bar increases and remains constant at pressure 60 bar. This is due to the fact that since
the adsorptive storage of natural gas on dry activated carbon is based on the principle of supercritical adsorption, the carbon surface can only be monolayerly covered by the adsorbate when the pressure is increased to 60 bar. There might have been some portion of the pore space that has not been utilized for the storage purpose.
However, if the carbon was wetted by some quantity of water before adsorption, methane hydrate could form inside the pores under certain conditions. The most possible conditions here that promote the formation hydrate are lower temperature and higher pressure. It is of utmost important to note that this condition only works if there is some certain amount of water content inside the pores. Meanwhile, the adsorption of methane still happens on the free surface and, thus, both the surface and free space of pores could have been utilized.
4.1.2 Separation of CO2 using Wetted Activated Carbon
For pressure of 30 bar
Time (min)
Area of CH4 (µV.s)
Area of CO2 (µV.s)
Total Area (µV.s)
Composition of CH4 (%)
Composition of CO2 (%) 0 215654.25 497543.68 713197.93 30.245 69.76 10 218638.83 493353.24 711992.07 30.71 69.29 20 226859.31 473002.68 699861.99 32.41 67.59 30 231233.27 471524.3 702757.57 32.90 67.10 40 231912.61 469938.77 701851.38 33.04 66.96 50 247915.72 468123.92 716039.64 34.62 65.38 60 269397.23 432589.6 701986.83 38.37 61.62 70 269397.23 432589.6 701986.83 38.38 61.62 80 285954.33 405137.93 691092.26 41.38 58.62
Table 7: Data tabulation for separation of CO2 using wetted activated carbon at pressure of 30 bar
The data tabulated are then plotted into a graph of time versus CO2 outlet composition at pressure of 30 bar as depicted in Figure 15.
Figure 15: Graph of Time versus CO2 Outlet Composition using Wetted Activated Carbon at Pressure of 30 bar
At time, t = 0, there is no adsorption of CO2 taking place. The initial value of outlet CO2
composition is 69.76%. Adsorption of CO2 takes place at t = 10 until the values of the outlet composition of CO2 becomes constant at t = 60 min. The value of outlet CO2 composition becomes constant until t = 70 min which means that the adsorption of CO2 has come to an optimum point. At t = 80, the outlet CO2 composition reduces to 58.62%.
For pressure of 60 bar
Time (min)
Area of CH4 (µV.s)
Area of C02 (µV.s)
Total Area (µV.s)
Composition of CH4 (%)
Composition of CO2 (%) 0 151157.975 248771.84 399929.815 37.80 62.20 10 152947.181 246676.62 399623.801 38.27 61.73 20 157801.517 234531.34 392332.857 40.22 59.78 30 161863.289 235762.15 397625.439 40.71 59.29 40 164538.827 234786.385 399325.212 41.20 58.80 50 173541.004 234061.96 407602.964 42.58 57.42 60 188878.061 216984.8 405862.861 46.54 53.46 70 188878.061 216984.8 405862.861 46.54 53.46 80 188578.061 216294.8 404872.861 46.58 53.42
Table 8: Data tabulation for separation of CO2 using wetted activated carbon at pressure of 60 bar
The data tabulated are then plotted into a graph of time versus CO2 outlet composition at pressure of 30 bar as depicted in Figure 16.
Figure 16: Graph of Time versus CO2 Outlet Composition using Wetted Activated Carbon at Pressure of 60 bar
At time, t = 0, there is no adsorption of CO2 taking place. The initial value of outlet CO2
composition is 62.20%. Adsorption of CO2 takes place at t = 10 until the values of the outlet composition of CO2 becomes constant at t = 60 min. The value of outlet CO2 composition becomes constant until t = 70 min which means that the adsorption of CO2 has come to an optimum point. At t = 80, the outlet CO2 composition value increases slightly to 53.46% but the value is still optimum with only 0.04% difference.
The resulting data for pressures of 30 bar and 60 bar are then combined into the following graph to compare the effect of operating pressures towards adsorption of CO2.
Figure 17: Graph of Time versus CO2 Outlet Composition using Dry Activated Carbon at comparative pressures of 30 bar and 60 bar
Based on the graph plotted, the data plotted results in a more distinct decrease in the pattern of the amount of CO2 outlet composition with respect to time when the pressure is increased after using wetted activated carbon. When the pressure is increased from 30 bar to 60 bar, the flow rate of the gas increases which results in a reduced residence time which leads to a lower CO2 adsorption as time increases. Lower amount of CO2 outlet composition achieved reflects a more enhanced amount of CO2 adsorbed during the separation process. From t= 60 to t = 70, the value
of CO2 composition becomes constant all the way to t = 80. As expected for the wet samples similarly with that of the dry samples, the wetted activated carbon used gives better result. The adsorption of CO2 becomes constant from t = 60 to t = 70 and then increases with time at t = 80.
After t = 80, it was predicted that the amount of the outlet compositions of CO2 recorded if the time is brought to double the time recorded in this experiment will approximately show less fluctuations as it goes constantly through the time. This is due to the factual assumption that all CO2 gas has been absorbed through the entire time and that the change in the amount between the initial inlet values and final outlet values have come to a maximum extent. Compared to that of using dry activated carbon, lower values of intlet CO2 composition gives lower values of outlet CO2 composition recorded, and vice verca. This increase in the pressure increases the amount of CO2 adsorbed results with time. This has something to do with the usage of wetted activated carbon as the adsorbent. The adsorptive storage of natural gas on wetted activated carbon is not solely based on the principle of supercritical adsorption.
However, the experiment on wetted activated carbon did not show some improvement in the pattern of amount of CO2 adsorbed. Although the water ratio (ratio of weight of water to the weight of dry activated carbon) was Rw = 1.4, which shows a higher storage capacity when using wetted activated carbon, the results show the other way round. The reason behind this would have a bunch of significance with the fact that the feed gas inlet values fluctuates with the pressure increase from 30 to 60 bars. The pressure regulator at the back of the GACU did not successfully reach 60 bar that it might fall between 40 to 50 bars only which then affects the results obtained for the experiment using wetted activated carbon. It was firstly predicted that when pressure is increased from 30 bar to 60 bar with the temperature held constant at room temperature, the amount of outlet CO2 composition decreases comparably. The plot does not overlap with the results for pressure of 30 bar which happened when using the dry activated carbon and this as a matter of fact because when the pressure is increased from 30 bar, the initial feed gas values dropped and so the pattern is very distinct.
4.2 Analysis and Discussion of the Formation of Hydrates in the Wetted Activated Carbon
The adsorption equilibrium of mixtures experiences consecutively several stages:
Stage 1: No hydrate formation. The partial pressure of either methane of carbon dioxide is lower than the formation of pressure of hydrates when a dry sample of activated carbon was used, therefore no hydrates were formed. The adsorption amount is determined by other mechanisms, such as physical adsorption, condensation or dissolution in water. The adsorption amount is quite low.
Stage 2: No hydrate formation. The partial pressure of carbon dioxide did not reach the formation pressure of its hydrates from the beginning until the end of the stage when the carbon is water-preloaded. CO2 hydrates did not form in the pore spaces. The partial pressure of methane is also below its hydrate-forming pressure when the carbon has been wetted with some quantity of water thoroughly.
It is noted here that there was no formation of hydrate that takes place because the temperature has to be very low and the pressure could not reach as high as possible in order for the requirement of the hydrate formation to be achieved.
CHAPTER 5
CONCLUSION AND RECOMMENDATION
As the conclusion of this project, researches on related topics have been done to the completion for the first feed gas mixture of CO2-CH4 for 60% CO2 (NL/min) and 40% CH4 (NL/min) respectively or with a ratio of 3:2 mathematically. Problem statement for this topic has been properly identified and related chemical and equipment has been identified. The experimental work has been completed on the effect of using wetted activated carbon towards separation of CO2 from feed gas via the Gas Adsorption Column Unit (GACU) experiment based on certain criteria.
CO2 adsorption using wetted activated carbon results in a lower amount of CO2 adsorbed compared to the one that uses the dry activated carbon at pressures of 30 bar and 60 bar while temperature is kept at a constant room temperature. The released amount is lower than that observed for dry carbon. The thermal effect is very low and exerts almost no influence on the storage capacity. The adsorbed CO2 can be completely released from the wet carbon on desorption, while the decreased temperature of the carbon bed did not prohibit the release of CO2. The packing density of the wet activated carbon exerts less considerable influence on the storage capacity. The adsorption pressure is also an important factor for the storage capacity since the expected pressure of 60 bar could not be successfully achieved due to failure in pressure regualtor.
Some recommendations can be made to improve the experiment. The present work only covered the separation of CO2 from feed gas mixture of CO2-CH4 for the ratio of 3:2, and therefore should be continued for other ratios to investigate the importance of the amount or composition of inlet feed gas used in the study. Since the experimental work faced some failures in the equipment, it was recommended to regulate inspections and maintenance of laboratory equipments in order to reduce or eliminate failures during experiments. The preparation of wetted activated carbon was done only in a 24-hour period which might not be adequate for the saturation of water inside the pores activated carbon to take place completely and thus, it is recommended to increase the time needed during preparation of wetted activated carbon.
The formation of hydrates did not take place in the experiment because the operating conditions did not meet the requirements. Thus, it is important to recommend that the temperature is brought to a very low value with the help of a chiller tubes built around the adsorption column so that the temperature can be drop to at least 4-5oC. The pressure should be increased to over 60 bar and to do that a new and better set of pressure regulators is recommended to be used.
REFERENCES
(1) Yan Sun; Quanmin Xue; Yaping Zhou; Li Zhou; “Journal of Colloid and Interface Science”; Sorption Equilibria of CO2/CH4 Mixture on Activated Carbon in Presence of Water; Tianjin, China, 2008; Vol. 322; p. 22-26
(2) Hongguan Yu; Lili Zhou; Weijia Guo; Jiulong Cheng; Qianting Hu; “International Journal of Coal Geology”; Predictions of the Adsorption Equilibrium of Methane/Carbon Dioxide Binary Gas on Coals using Langmuir and Ideal Adsorbed Solution Theory Under Feed Gas Condition; Shandong Province, China, 2008; Vol. 73, p. 115–129
(3) S. Sircar; T. C. Golden; M. B. Rao; “Carbon”; Activated Carbon For Gas Separation And Storage Carbon; Hamilton, Great Britain, 1996; Vol. 34; No. 1; p. l-12
(4) Yaping Zhou; Yuxin Wang; Haihua Chen; Li Zhou b; “Carbon”; Methane storage in wet activated carbon: Studies on the charging/discharging process; Tianjin, China, 2005; Vol 43; p. 2007-2012
(5) Yaping Zhou; Miao Dai; Li Zhou; Yan Sun; Wei Su b; “Carbon”; Storage of methane on wet activated carbon: influence of pore size distribution; Tianjin, China, 2004; Vol. 42; p.
1855-1858
(6) Lei Li; Patricia A. Quinlivan; Detlef R.U. Knappe; “Carbon”; Effects of Activated Carbon Surface Chemistry and Pore Structure on the Adsorption of Organic Contaminants from Aqueous Solution; Raleigh, USA, 2002; Vol. 40; p. 2085-2100
(7) Clark; Robert M.; Granular Activated Carbon: Design, Operation, and Cost; Lewis Publishers, p. 2, 7, 35, 47-49, 205, 206
(8) Stephen Bruner; P. H. Emmett; Edward Teller; Adsorption of Gases in Multimolecular Layers; Washington, USA, 1938; p. 309-319
(9) YuxinWanga; Yaping Zhoua; Congmin Liua; Li Zhoub; “Colloids and Surfaces A:
Physicochem. Eng. Aspects”; Comparative studies of CO2 and CH4 sorption on activated carbon in presence ofwater; Tianjin, China; 2008; Vol. 322, p. 14–18
(10) Hui Ana; Bo Fenga; Shi Sub; “G Model”; CO2 Capture by Electrothermal Swing Adsorption with Activated Carbon Fibre Materials; Kenmore, Australia; 2010; p. 1-10
(11) De Q. Vu; William J. Koros; Stephen J. Miller; “Ind. Eng. Chem. Res”; High Pressure CO2/CH4 Separation Using Carbon Molecular Sieve Hollow Fiber Membranes; 2002; Vol.
41; p. 367-380
APPENDICES
(i) Samples of graf plotted in GC for Dry Activated Carbon Pressure: 30 bar
Test Run Sample for 1 Data
Pressure: 60 bar Test Run Sample for 1 Data