STUDY ON DYNAMICS OF PDC BIT ON USING ANSYS-AUTODYN/EXPLICIT DYNAMICS ON
SINGLE-LAYERED FORMATION
by
MUHAMMAD MAHFUZ BIN ALIAS 14992
Dissertation submitted in partial fulfillment of the requirements for the
Bachelor of Engineering (Hons) (Petroleum)
JANUARY 2015
Universiti Teknologi PETRONAS Bandar Seri Iskandar
32610 Tronoh Perak Darul Ridzuan
i
CERTIFICATION OF APPROVAL
STUDY ON DYNAMICS OF PDC BIT ON USING ANSYS-AUTODYN/EXPLICIT DYNAMICS ON
SINGLE-LAYERED FORMATION By
Muhammad Mahfuz bin Alias
Dissertation submitted in partial fulfillment of the requirements for the Bachelor of Engineering (Hons)
(Petroleum Engineering Engineering)
Approved by,
________________________________
(Dr Dereje Engida Woldemichael)
Universiti Teknologi PETRONAS Bandar Seri Iskandar, 32610 Tronoh,
Perak Darul Ridzuan, Malaysia.
ii
CERTIFICATION OF ORIGINALITY
This is to certify that I am responsible for the work submitted in this project, that the original work is my own except as specified in the references and
acknowledgements, and that the original work contained herein have not been undertaken or done by unspecified sources or persons.
___________________________________________
Muhammad Mahfuz bin Alias
iii ABSTRACT
In the petroleum industry, drilling is one of the most important aspects due to economic reason. Reduction in drilling time is required to minimize the cost of operations. This study focused on dynamics study of Polycrystalline Diamond Compact (PDC) drill bit profile and drilling fluid study on affecting the rate of penetration (ROP) and tool ware for single formation. ROP is defined as the speed at which the drill bit penetrates the formation or breaks the rock under it to increase the depth of borehole. The well drilling cost can be lowered when drill bit performing high rate of penetration hence the time of drilling reduced. Drilling fluid also needs to be considered in order to achieve maximum rate of penetration. From time to time, drilling-fluid systems are designed and modified to perform efficiently under those particular conditions due to differences in wellbore conditions. The objective of this project is to investigate the types of bit design features to study the effect of design improvement on the rate of penetration (ROP) and tool wear. The computer software, ANSYS Autodyn/Explicit Dynamics being used in the project to observe the impact of bit profile in presence of drilling fluid to the rate of penetration (ROP) and the tool wear being used. The result shows the comparison of the ROP based on varies back rack angle and type of formation which is sandstone and dolomite. The resulted graph from the simulation being used for analysis to show the comparison between the ROP between parameter used. The simulation also included the significant of different side rack angle but the result of the simulation almost the same between all side rack angles to penetrate the formation.
iv
ACKNOWLEDGEMENT
The author would like to take this opportunity to express his profound gratitude to Universiti Teknologi PETRONAS for providing the platform for the research project to be conducted.
The author also take this opportunity to express a deep sense of gratitude and regards to his supervisor, Dr Dereje Engida Woldemichael, Lecturer in Mechanical Engineering Department, Universiti Teknologi PETRONAS, for his cordial support, valuable information and exemplary guidance, which help the author in completing the final year project. The blessing, help and guidance given by him time to time shall carry the author a long way in the journey of life on which the author about to embark.
The gratitude also goes to team members of Y-UTP for the valuable information provided by them in their respective fields. With their patience and openness they created an enjoyable environment. A big contribution and hard worked from them during project progress is very great indeed.
The author would like to thank Al-mighty, her parents, brother, sisters and friends for their constant encouragement without which this report would not be possible.
Thank you.
v
TABLE OF CONTENTS
Certification of Approval ... i
Certification of Originality ... ii
Abstract ... iii
Acknowledgement... iv
Table of Contents ... v
List of Figures ... vii
List of Tables... viii
Abbreviations and Nomenclature ... ix
Chapter 1: Introduction 1.1 Background of Study ... 8
1.2 Problem Statement ... 9
1.3 Objective ... 10
1.4 Scope of Study ... 10
1.5 The Relevancy of the Project ... 11
1.6 Feasibility of the Project within the Scope and Time Frame ... 11
Chapter 2: Literature Review 2.1 PDC Drill Bit ... 12
2.1 Design Features ... 13
2.2 Drilling Fluid ... 14
2.3 Finite Element Analysis ... 16
2.3 ANSYS Autodyn ... 16
Chapter 3: Research Methodology 3.1 Project Flow Chart ... 18
3.2 Preliminary Simulation ... 20
3.3 Drill Bit Profile ... 31
3.4 Simulation (ANSYS Explicit Dynamic/Autodyn) ... 22
3.5 Parameter Analysis... 26
3.6 Tools and Equipment ... 31
3.7 Gantt Chart and Key Milestone... 31
vi Chapter 4: Result and Discussion
4.1 Preliminary Simulation Result ... 33
4.2 Result for Side Rake Angle for Sandstone Formation ... 38
4.3 Result for Side Rake Angle for Dolomite Formation ... 39
4.4 Result Comparison ... 40
Chapter 5: Conclusion and Recommendation 5.1 Conclusion ... 42
5.1 Limitation of Project ... 42
5.1 Recommendation... 43
References ... 44
vii List of Figures
Figure 1: Several types of PDC bits ... 12
Figure 2: Component of PDC Drill Bit... 13
Figure 3: Cutter of PDC Bit ... 14
Figure 4: Project Flow Chart ... 17
Figure 5: Preliminary Simulation ... 18
Figure 6: Resulted graph from simulation ... 18
Figure 7: Bit profile in CATIA software ... 19
Figure 8: 3D Model of PDC bit in assembly design ... 19
Figure 9: 3D Model of PDC bit in stp file format... 19
Figure 10: Explicit Dynamic Component Analysis ... 20
Figure 11: Workbench Mechanical interfaces ... 21
Figure 12: Simulation Coordinates Systems locations ... 21
Figure 13: Simulation meshing setting and pattern ... 22
Figure 14: Angular velocity of bit ... 23
Figure 15: WOB of bit... 23
Figure 16: Back rake angle from CATIA software ... 25
Figure 17: Simulation with fluid flow ... 27
Figure 18: Boundary Condition setup in Autodyn ... 28
Figure 19: Vector condition setup in Autodyn ... 28
Figure 20: Graph resulted from preliminary simulation ... 35
Figure 21: Graph of directional velocity for Sandstone Formation ... 38
Figure 22: Graph of Directional Velocity of Dolomite Formation ... 39
Figure 23: Graph of average directional velocity for both formation... 40
Figure 24: Gauge pressure of sandstone formation with 100 rack angle ... 41
Figure 25: Gauge pressure of dolomite formation with 100 rack angle ... 42
viii List of Tables
Table 1: Input Data ... 27
Table 2: Material Properties ... 28
Table 3: Gantt Chart for FYP1 and FYP2 ... 33
Table 4: Key Milestones ... 34
Table 5: Directional Velocity for Sandstone formation ... 38
Table 6: Directional Velocity for Dolomite formation ... 39
Abbreviations and Nomenclatures 3D Three Dimensional
FYP Final Year Project
PDC Polycrystalline Diamond Compact ROP Rate of Penetration
UTP Universiti Teknologi Petronas WOB Weight on Bit
9 CHAPTER 1 INTRODUCTION
1.1 Background of Study
Drilling process is one of the major parts in Exploration and Production in oil and gas industry. The only way to confirm the presence of hydrocarbon is to drill exploratory boreholes once a promising geological structure has been identified.
Drilling optimization is very important during drilling operation and plays big roles for oil and gas exploration phase to allow the oil industry worldwide to economically and successfully utilize oil and gas field that may have not been possible before(Che, Han, Guo, & Ehmann, 2012). This is because drilling optimization could save time and cost of operation thus increases the profit. However, due to unexpected circumstances such as failure of drilling tool can cause loss to the company. Drilling activities has to stop in order to fix the failure consequently affect the drilling operation time and cost. In addition, the rate of penetration can be considered as one of the primary factors which affect drilling cost. There are several factors affect rate of penetration (ROP) but the author will focus on study on dynamics of bit and effect of drilling fluids on the tool wear and ROP.
Drill bit selection is vital during drilling phase because the drilling engineers need to select the best bit to drill certain formation in down hole (Guo & Hou, 2011). There are many types of drill bit used to drill whether in soft, medium or hard formation.
One of the challenges faced is when drilling a multi-layer formation. Multilayer formation is defined as a formation interbedded with another types of formation and become more complex when soft formation interbedded with hard stringers.
Another way to effectively maximize drilling efficiency is utilization of drilling fluid. In early days of rotary drilling, the primary function of drilling fluid was to bring cuttings from the bottom of down hole to surface. However nowadays, the drilling fluid have been modified to have different functional to work in drilling industry such as to increase the rate of penetration (ROP) while drilling.
10 1.2 Problem Statement
Failure of selecting the best drill bit can lead to low of penetration rate and consequently affect the drilling performance and cost (Guo & Hou, 2011).. Drill bit selection is complicated process but with proper selection from all engineering aspect can achieve maximum drilling efficiency. Polycrystalline diamond compact (PDC) bits is widely used in current drilling industry and proven to be effective in hard and abrasive formation (Nygaard and Hareland, 2007). Due to different background of formation while drilling might cause problems in drilling. However, case studies show that properly selection of designs and features of PDC bits have been modified to approach complex formation effectively while drilling.
Based on previous project that have been done, the dynamics analysis was done without considering the effect of drilling fluid. By adding mud into this system, ROP and the tool wear of PDC bit will be different, and more real to actual values, as the actual drilling process in real times. As the condition in wellbore while drilling cannot be observed appropriately, a simulation is required to give more real effect on investigating the effect of drill bit and drilling fluids on dynamics analysis.
11 1.3 Objective
The objectives of this project are:
- To model and simulate PDC Bit for different formation - To investigate the effect of parameters on dynamics analysis
1.4 Scope of Study
The scopes of study based on the objectives can be simplified as follows:
- Drilling parameters such as tool wear and ROP of several PDC bits.
- Efficiency of selected PDC bits features on drilling in single layer formations.
- Rheological studies on mud fluid and its interaction with PDC bit and drill cuttings.
- Simulation software (ANSYS Explicit Dynamic & Autodyn)
12 1.5 The Relevancy of the Project
The present project is relevant especially to Y-UTP team. This Y-UTP team is currently working on a project entitled “Bit Wear and Vibration Study to Aid Drilling Optimization”. The author’s effort on completing this project might help Y-UTP team to achieve certain limit.
The undertaking is additionally significant to the author since it’s includes an exceptionally extensive study on hypothesis and the application. The theory and calculations used comprises of general mechanical knowledge which can be applied in the oil and gas industry.
1.6 Feasibility of the Project within the Scope and Time Frame
The project is within the capability of a final year student to be executed with the help and guidance from the supervisor and the previous FYP student under Y-UTP team. Drilling Engineering course is one of the compulsory subjects for a Petroleum Engineering student. Therefore, the author has the knowledge that can be useful for this project. The time frame is also feasible and the project can be completed within the time allocated.
13 CHAPTER 2 LITERATURE REVIEW
2.1 PDC Drill Bit
Polycrystalline diamond compact (PDC) bits become favorites in drilling industry because diamond is the hardest element of material and their superior hardness gives it great property in terms of cutting any other materials. Based on PDC cutter were introduced in 1973 has eased in the advancement of the first drill bit that used synthetic diamonds as cutting components (Che, Han, Guo, & Ehmann, 2012). PDC bits are effective at drilling shale formations, especially when used in combination with oil-based mud. During last decade PDC drill bit performance has been enhanced by advancement in PDC wear, impact resistance and better vibrations understanding.
A diamond bit (FIGURE 1) is used in very hard rocks that require a long period time to grind the rock away. Diamond bits have industrial diamond implanted in them to drill extremely hard surfaces and designed and manufactured for a particular job rather than being mass produced as roller cone bits are.
Figure 1 Several types of PDC bits that is available. (Petrowiki)
The PDC Bits perform best in soft, firm and medium-hard non-abrasive formation and as good result of these bits has been accomplished in sandstone, siltstone and shale although bit bailing is serious problem in soft formations. (Bourgoyne et.al ,1986). Currently, large-diameter PDC cutter providing increased exposure and shaped cutter featuring a higher point loading per cutter are some of the technological advancement being tested (Kerr, 1988).
14 2.2 Design Features
One of the factors affecting the rate of penetration (ROP) is the drill bit design features. For optimum drilling performance, drill bit designer make some adjustment to the bit features. There are three main design features affecting PDC bit performance which is number of cutter, back rack angle and side rack angle according to journal entitled “PDC Drill Bit Design and Field Application Evolution” by Kerr, C.J, 1998.
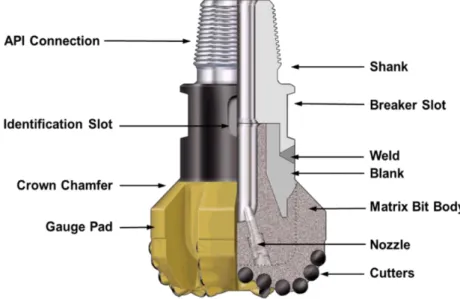
Figure 2 Component of PDC drill bits (Source from Petrowiki)
According to Taylor et al., the structure of a diamond drill bit can be separated into three main parts. They are cutting structure, shank and crown which is the bit body. Cutter orientation is defined in terms of back rake angle, side rake angle and cutter exposure. Cutter orientation must be appropriately coordinated to the hardness of the development being penetrated.
15
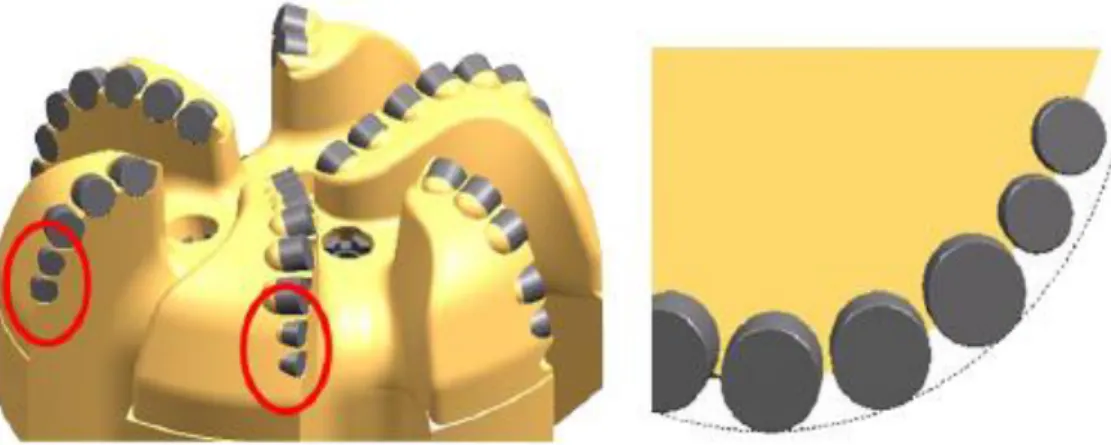
Figure 3 Cutter on PDC Bit (Source from Petrowiki)
PDC cutters can be set based on two rakes angle which is back rake angle and side rake angle which both of these rakes influence the PDC drill bit performance. Side rack angle is utilized to direct the formation cutting towards the flank of the bit and into annulus. Meanwhile, back rake angle is determined the size of cutting being produced.
16 2.5 Drilling Fluid
Drilling fluid is used in optimization drilling to raise the cuttings made by the bit but in other aspect; it provides a means of keeping underground pressure in check and increase the rate of penetration (ROP) as well as the wear rate of the bit. The heavier or denser the mud, the more pressure it exerts to down hole while drilling operation.
Drilling fluid is a mixture of water, weighing material, clay and other few chemical to make it exert as much as pressure needed to contain formation pressure. The ROP also can be increased by decreasing the mud weight. The major function of drilling fluids are to carry cuttings from the hole and permit their separation at the surface, cool and clean the bit, reduce friction between the drill pipe and wellbore or casing, maintain the stability of the wellbore and prevent the inflow of fluids from the wellbore (Chilingarian and Vorabutr, 1983).
Because of contrasts in wellbore conditions, drilling-fluid systems are outlined and defined to perform proficiently under those specific conditions. Drilling-fluid additionally can ensure the tool wear while drilling as the heat created by friction of the bit and hard for this high temperature to be directed away by the formation. The high temperature transmitted to the drilling-fluid from the wellbore to the surface and thusly expanded bit life, decreased pump and diminished torque.
17
2.6 Finite Element Analysis (Explicit Dynamics)
Finite Element Analysis (FEA) is a computer model of a design or material that is investigated to get specific output. Modifying an existing product or structure is utilized to improve or qualify the product for a new service condition. FEA help analyst to predict failure due to unknown stresses by showing problem areas on an object and giving chances for designers to see all of the theoretical stresses within.
(Szabo B.,1991). This method can help to reduce manufacturing costs and time rather 3 than making and testing the real component. Explicit Dynamics is one of the features in Finite Element Analysis. The ANSYS explicit dynamics product suite helps user to gain insight into the physics of short-duration events for products that undergo highly nonlinear, transient dynamic events. These specialized, accurate and easy-to-use tools have been designed to maximize productivity. With the ANSYS explicit dynamics products, user can study how a structure responds when subjected to severe loadings.
2.5 ANSYS Autodyn
ANSYS Autodyn software is a versatile explicit analysis tool for modeling the nonlinear dynamics of solids, fluids, gases and their interactions. The product has been developed to provide advanced capabilities within a robust, easy-to-use software tool. Simulation projects can be completed with significantly less effort, less time and lower labor costs than with other explicit programs. This high productivity is a result of the easy-to-use, quick-to-learn, intuitive, interactive graphical interface implemented. Time and effort are saved in problem setup and analysis by automatic options to define contact, by coupling interfaces and by minimizing input requirements using safe logical defaults.
18 CHAPTER 3
RESEARCH METHODOLOGY
3.1 Project Flow Chart
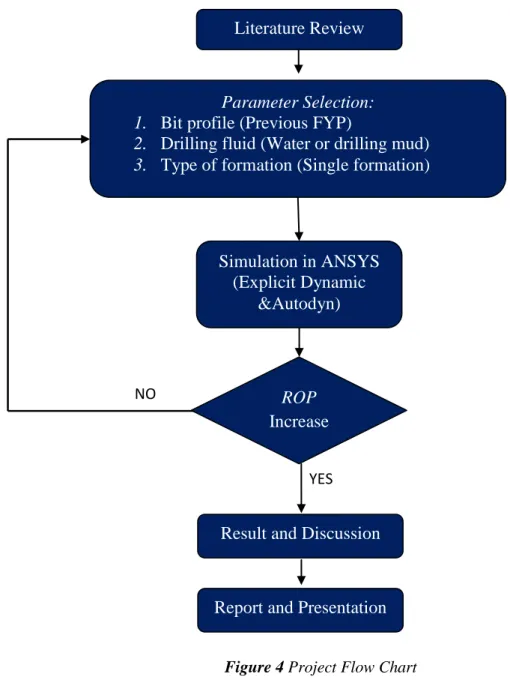
The project started with the preliminary research of PDC bit in order to familiarize with the project based on articles and research paper that have been done before.
Based on the literature review, the author focused on the study of the PDC bit and its design features and drilling fluid. At this stage, the author study the effect of mechanical characteristics of the bit cutters, the profile of the PDC drill bit and the case history on PDC drill bit’s performance for single-layered formation. The author attended a training session provided by Y-UTP team for “Bit Wear and Vibration Study to Aid Drilling Optimization”. The training held in ANSYS lab and the training was taught by previous FYP student that have done ANSYS simulation before. The preliminary model was constructed by the author to give the basic understanding before proceed with the real drill bit in ANSYS simulation. The preliminary model consists of simple cylinder that represents the drill bit to penetrate single-layered formation and this simulation was constructed by using Explicit Dynamics. The author also attended a field trip to Kemaman Supply Base to give some exposure with the current technology of PDC bit. The simulation later carried out by using the real bit that have been reversed engineered by previous FYP student.
The parameter analysis was discussed with the supervisor to highlight the parameter being used throughout the project.
19
Figure 4 below illustrate the flow chart diagram for this project.
Figure 4 Project Flow Chart NO
YES Literature Review
Parameter Selection:
1. Bit profile (Previous FYP)
2. Drilling fluid (Water or drilling mud) 3. Type of formation (Single formation)
Simulation in ANSYS (Explicit Dynamic
&Autodyn)
ROP Increase
Result and Discussion
Report and Presentation
20 3.2 Preliminary Simulation
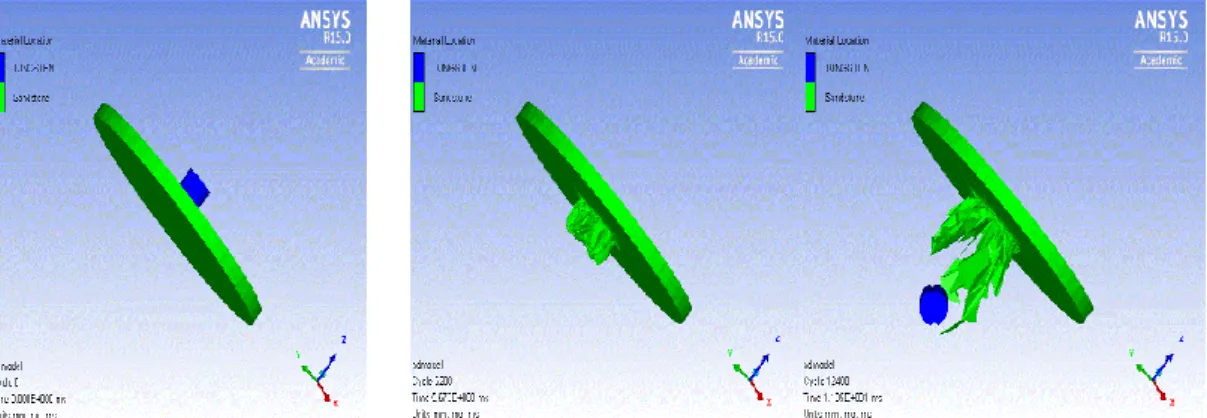
Before the real simulation being done, a preliminary model is designed in order to familiarize with the simulation. The preliminary model consists of cylindrical body which represents the drill bit and formation located below the drill bit. The cylindrical body will penetrate the formation body and the total velocity of the drill bit on y-axis being measured. The figure below shows the illustration of the simulation.
Figure 5 Preliminary Simulation
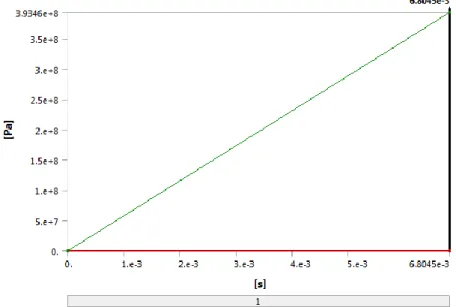
The graph below shows the results of the total velocity generated from the simulation for the preliminary model.
Figure 6 Resulted graph from simulation
21 3.3 Drill Bit Profile
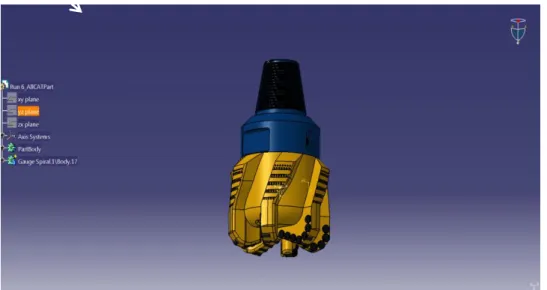
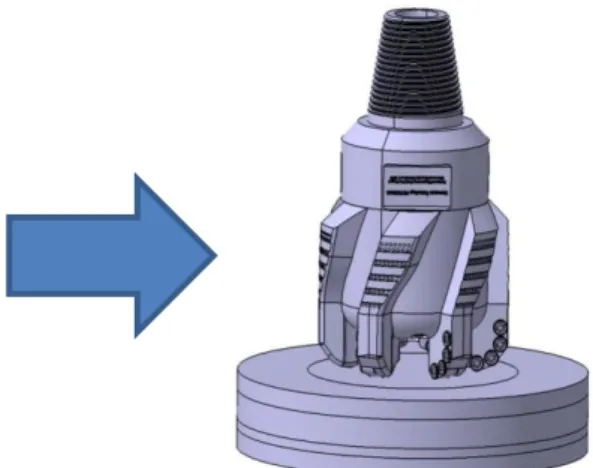
In this project, the bit profile selected from previous FYP project. The bit profile designed and constructed by using software CATIA. The bit profile needs to save in stp format to import the geometry into ANSYS Explicit Dynamic and Autodyn.
Figure 7 Bit profile in Cathia software
Figure 83D Model of PDC bit in assembly design Figure 93D Model of PDC bit in .stp format
22
3.4 Simulation (ANSYS Explicit Dynamic & AUTODYN)
The design of products that need to survive impacts or short-duration high-pressure loadings can be greatly improved with the use of ANSYS explicit dynamics and Autodyn solutions. These specialized problems require advanced analysis tools to accurately predict the effect of design considerations on product response to severe loadings.
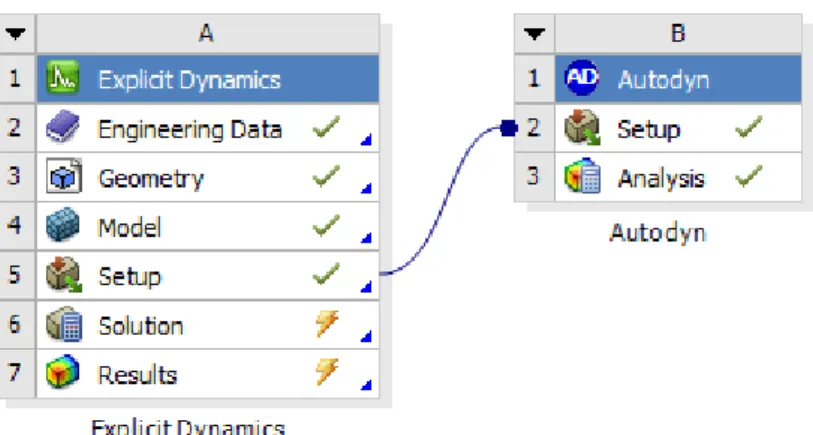
The type of solution used is in ANSYS explicit dynamic is “Total Velocity” to analyze the rate of penetration of PDC bit in meter per seconds. The target solver for this analysis is AUTODYN.
Figure 10 Explicit dynamic &Autodyn component analysis
23 Geometry and Coordinate System
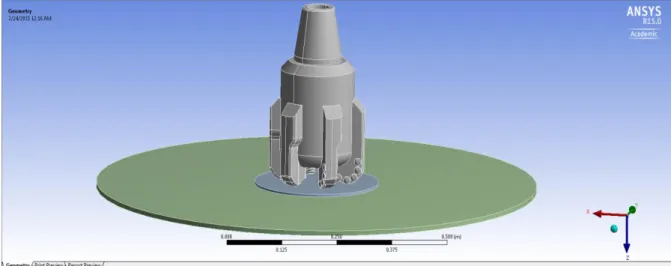
The 3D model of PDC bit and single-layered rock formation in .stp format are imported into ANSYS Geometry and open in Workbench Mechanical for analysis setting.
As the figure above, the drill bit will penetrate the water and formation layer and the
“total velocity” of the cylinder will be measured. Material of the geometry, coordinates system, meshing pattern and setting, initial condition and analysis settings are characterized in ANSYS Workbench Mechanical .
Figure 11 Workbench Mechanical interfaces
Figure 12 Simulation Coordinates Systems locations
24 Meshing
Meshing is one of the vital aspects in engineering simulation. Meshing is a fundamental part of the PC helped engineering simulation process. The mesh influences the accuracy, convergence and speed of the solution. The meshing setting and pattern for this project was set as shown in figure below.
Figure 13 Simulation meshing setting and pattern
25 Initial Condition
Initial condition has to be set up in Explicit Dynamic for later to import the setup to Autodyn component as target solver. There are three initial conditions set for the simulation which is angular velocity, force and fixed support. The angular velocity being assigned to the drill bit that will rotate with the revolutions per minutes (RPM) of 100 RPM. The second condition is force which represent the weight on bit (WOB) acting on the bit. This force being applied at the top of the bit towards the formation.
The WOB is set as 100000N for the simulation.
Direction of angular velocity
Force acting on bit Figure 14 Angular velocity of bit
Figure 15 WOB of bit
26 3.5 Parameter Analysis
Drill bit design features are one of the important factors affecting the drill bit’s performance. In this project, we can say that design features are the input parameters and bit’s performance is the output considerations. From the input variable of the PDC bit, the back rake angle and the side rack angle is one of the parameter being measured. These angle being constructed or designed by CATIA software and change it to stp.file to import it into ANSYS simulation geometry.
Table 15 below shows the parametric analysis for input during the simulation:
Parameter Input Data
Back Rack Angle 10o, 20o ,30o ,40o ,50o
Side Rack Angle 0o , 30o , 60o
Type of formation Sandstone, Dolomite
The model of cutter with back rack angle being constructed by using CATIA software. The table below shows the geometry of the cutter with each angle considered which is 10o, 20o ,30o ,40o ,50o :
100 200 300
400 500
Table 1 Input data
Figure 16 Back rake angle from CATIA software
27
The properties and material for the component will be used in the analysis is defined in engineering data. Table below shows the material and properties used for the analysis.
Material Properties
Cutter Polycrystalline
Diamond Compact
Density: 3250 kg m^-3
Young’s Modulus: 1.5231E+08 Poisson’s Ratio: 0.38462 Bulk Modulus: 2.2E+08 Shear Modulus: 5.5E+08 Bit body Tungsten Carbide Density: 19300 kg m^-3
Young’s Modulus: 3.968E+11 Poisson’s Ratio: 0.24
Bulk Modulus: 2.5436E+11 Shear Modulus: 1.6E+11 Rock formation 2 Sandstone Density: 2650kg m^-3
Young’s Modulus: 1.8456E+08 Poisson’s Ratio: 0.2
Bulk Modulus: 1.0253E+08 Shear Modulus: 7.69E+07 Rock formation 4 Dolomite Density: 2872 kg m^-3
Young’s Modulus: 1.1657E+11 Poisson’s Ratio: 0.29527 Bulk Modulus: 9.49E+10 Shear Modulus: 4.5E+10 Table 2 Material properties
28
For the next step of the simulation, the author been assigned to simulate ANSYS Autodyn analysis system by using simple design based on two main components, tungsten acts as the drill bit profile to penetrate the formation with the aids of drilling fluid or mud. For the starting, water being used to acts as the drilling fluid that will be drilled with the drill bit. This additional parameter is used to obtain more reliable result compared to the real industry. The model geometry of the fluid flow is show in Figure below.
The fluid located at the center of the bit as a hole being constructed to the bit body using CATIA software. The fluid being assigned to have the continuous fluid flow which have same direction with the bit penetrates the formation. Euler method will be used for the simulation as Euler method is the best method for liquid flow. The fluid flow is assigned to have velocity of 10m/s which is lower than the WOB acting on the bit so that the water will not have greater impact while bit penetrates the formation.
Figure 17 Simulation with fluid flow
29
The boundary condition and vector condition of the bit also can be set up during Autodyn setup. In Autodyn, the boundaries condition can be viewed more clearly with the aids of shapes representing the boundaries condition. The direction of the vector of drill bit also can be seen during the setup of simulation in Autodyn. Other extra parameter can be measured by using gauge positioning. The gauge position will shows some output parameter at exact location of the bit. For this simulation the gauge assigned on the surface of cutter.
Figure 18 Boundary Condition setup in Autodyn
Figure 19 Vector condition setup in Autodyn
30 3.9 Tools and Equipment
Tools and equipment used for this project is simulation software, called ANSYS (AUTODYN/Explicit Dynamic) and CATIA (Computer Aided Three-dimensional Interactive Application)
31 3.10 Gantt Chart and Key Milestone
No Activities /
Week 1 2 3 4 5 6 7 8 9 10 11 12 13 14 1 Literature
Review 2 Preliminary
Research Work
3
Field Visit to Kemaman Supply Base (KSB)
4
Design simple simulation model (ANSYS)
1
No Activities / Week
15 16 17 18 19 20 21 22 23 24 25 26 27 28
1 Literature Review
2 Analysis on first bit profile simulation with drilling fluids (ANSYS)
2
13 Analysis on new bit profile and drilling fluid (ANSYS)
3
4 ROP Analysis
4
Process Suggested Milestone
Table 3 Gantt Chart for FYP1 and FYP2
32
1 Key Milestone 1: Completed simple simulation with ANSYS-Autodyn 2 Key Milestone 2:Completed first bit profile with drilling fluid simulation 3 Key Milestone 3: Completed simulation with new bit profile and drilling fluid 4 Key Milestone 4: Completed ROP analysis
Table 4 Key milestones
33 CHAPTER 4
RESULT AND DISSCUSSION
The output parameter for this project is the rate of penetration (ROP). In the drilling industry, the rate of penetration (ROP) is the speed at which a drill bit breaks the rock under it to deepen the borehole. ROP is also known as penetration rate or drill rate. It is normally measured in feet per minute or meters per hour, but sometimes it is expressed in minutes per foot. From the simulation, directional velocity in y-axis being measured that represent the ROP for the drill bit to penetrate the formation.
There are two main parameter being measured which is the side rack angle and back rack angle of the cutter mounted to the drill bit. There are two types of formation being tested for this simulation which is sandstone and dolomite. These formation selected based on the different hardness of the formation which is sandstone is softer than dolomite.
34 4.1 Preliminary Simulation Result
This preliminary model basically consists of just a cylinder, which represents a bit, and another slimmer cylinder which represents the formation itself. In this project, the simulation was carried by ANSYS Explicit Dynamic. Data from total velocity represent the rate of penetration for the PDC bit is extracted from ANSYS result. At the end of simulation, there are some graph represented the output that rely on the simulation. As figure showed below, there are few graph resulted from the simulation divided into six parts which is material summary, part summary, energy summary, x-momentum summary, y-momentum summary and z-momentum summary.
Figure 20 Graph resulted from preliminary simulation
35
Figure 20 Graph resulted from preliminary simulation
36
From figure 20 shows the reaction occurred during the simulation. For the energy summary and part summary, we can observe the increase of the total energy from time to time in millisecond. From the energy summary, the work done is calculated by the simulation of the drill bit to penetrate the formation and we also can observe the increase in work done by time to time. The error in this simulation is 0 as well, confirming the simulation is successful. However, more energy is required when a fluid is introduced into the simulation. For the x-momentum, y-momentum and z- momentum, the impulse of being recorded for every axis. The axis being set during the setup in Explicit Dynamics to show the reaction occurred from every axis that have been assigned.
37
4.1 Side Rack Angle Result (Sandstone formation)
The table below show the result given by the simulation for back rack angle parameter on the sandstone formation.
Directional Velocity (m/s)
TIME/ANGLE 100 200 300 400 500
0.1 25 30 35 35 40
0.2 52 55 55 55 55
0.3 75 75 80 80 80
0.4 105 110 105 105 105
0.5 130 135 135 135 135
0.6 155 160 160 165 165
0.7 185 185 185 185 185
0.8 190 188 190 195 195
0.9 180 185 180 190 190
From these set of values, a graph is plotted to compare the directional velocity of the PDC bit on single-layered formation.
4.1 Side Rack Angle Result (Dolomite formation)
0 50 100 150 200 250
1 2 3 4 5 6 7 8 9 10
Directional Velocity (m/s)
Time (s)
Directional Velocity vs Time graph
Time Y-Velocity (50') Y-Velocity (40') Y-Velocity (30') Y-Velocity (20') Y-Velocity (10')
Table 5 Directional velocity for sandstone formation
Figure 21 Graph of directional velocity for sandstone formation
38
The table below show the result given by the simulation for back rack angle parameter on the dolomite formation.
Directional Velocity (m/s)
TIME/ANGLE 100 200 300 400 500
0.1 22 27 28 28 36
0.2 45 46 46 46 46
0.3 67 67 68 67 68
0.4 80 86 86 90 90
0.5 117 120 120 120 120
0.6 140 145 145 145 145
0.7 166 166 166 164 166
0.8 170 165 165 165 160
0.9 165 165 160 160 165
From these set of values, a graph is plotted to compare the directional velocity of the PDC bit on single-layered formation.
4.1 Result comparison between two formations
Based on the graph shows that the back rack angle of 100 gave the best bit performance in terms of directional velocity on x-axis or in ANSYS terms represent
0 50 100 150 200
1 2 3 4 5 6 7 8 9 10
Directional Velocity (m/s)
Time (s)
Directional Velocity vs Time graph
Y-Velocity (50') Y-Velocity (40') Y-Velocity (30') Y-Velocity (20') Y-Velocity (10')
Table 6 Directional velocity for dolomite formation
Figure 22 Graph of directional velocity for dolomite formation
39
the Y-momentum. However, based on the results of these back rack angle not shows big differences in terms of directional velocity based on both formation sandstone and dolomite. The graph below show the comparison between average directional velocities between both formations.
The graph above shows that the directional velocity of average directional velocity for sandstone is higher than dolomite formation. This shows that that ROP of drill bit using sandstone formation is higher than dolomite formation. As be mentioned before, the hardness of the formation can influenced the ROP of bit and bit performance.
0 50 100 150 200
1 2 3 4 5 6 7 8 9
Directional Velocity (m/s)
Time (s)
Chart Title
Average Velocity (Sandstone) Average Velocity (Dolomite)
Figure 23 Graph of average directional velocity for both formation
40
From the simulation also the author can extract the pressure occurred during the simulation. As figure below show the gauge pressure for both types of formation which is sandstone and dolomite.
The gauge pressure show the pressure exerted for both sandstone and dolomite with 100 rake angle to shows the differences in pressure during the simulation. As
observed below the pressure exerted for sandstone formation is bit lower compared to dolomite formation. As be mentioned before, the pressure difference influenced by the hardness of the formation. In this case, the dolomite formation represent the harder formation and exerted more pressure in order the drill bit able to penetrate the formation. From both graph also shows a starting constant pressure before the
pressure behavior changed or started to increase. This shows that the bit is starting to penetrate the formation and produced the differences in pressure.
Figure 24 Gauge pressure of sandstone formation with 100 rack angle
Figure 25 Gauge pressure of dolomite formation with 100 rack angle
41 CHAPTER 5
CONCLUSION AND RECOMMENDATION 5.1 Conclusion
This project has provided a review of the literature associated with the PDC bit performance in single-layer formation. As conclusion, the study of this PDC bit shows that:
1. Bit performance is strongly influenced by design features of PDC bit.
Optimizing bit design, angle of cutter (back rack angle & side rack angle) and bit material have been shown to be able to increase ROP
2. The presence of drilling fluid in drilling operation is foresee to have an effect on ROP.
3. Parametric analysis on PDC bit can done by Autodyn as solver for more reliable and reasonable result.
5.2 Limitation of Project
There are some limitations from this project in order to get the full analysis of PDC bit components itself. Back rake angle and side rake angle are not the only parameter that can be analyzed. There are some other parameters as shown before in parameter analysis that can be considered for analyzing the study of dynamics of PDC bit by using ANSYS simulation. Due to time constraint, the author managed to analyze based on two common formations for the PDC bit to penetrate in order to achieve the high performance PDC bit.
42 5.3 Recommendation
The further studies need to be done in order to get the highest performance of PDC bit. The studies on the dynamic of PDC bit need to be conducted with different parameter analysis the shows the relationship between the PDC bit features and other parameter concerned. The additional of the fluid flow in ANSYS-Autodyn also need to be done with different approach to get the overview of the drilling fluid while drilling. The settings and assumption of the drilling fluid itself need to be consider again in order to predict more reliable results to compare with the current industry technologies approach.
43
REFERENCES
[1] Paiaman, A. M., Al-Askari, M. K., Salmani, B., Alanazi, B. D., & Masihi, M. (2009). Effect of Drilling Fluid Properties on Rate of Penetration.Nafta,60(3), 129-134.
[2] Caenn, R., & Chillingar, G. V. (1996). Drilling fluids: State of the art.Journal of petroleum science and engineering,14(3), 221-230.
[3] Nygaard, R., & Hareland, G. (2007, April). How to select PDC bit for optimal drilling performance. InThe 2007 SPE Rocky Mountain Oil and Gas Technology Symposium, Denver, Colorado, USA. Paper no.: SPE(Vol. 107530).
[4] Everhard, I., Willis, S., Villalobos, M., Clapper, D., Salem, H. A., & Hughes, B. (2014).
Reduced Drilling Days and Low Friction Factors Hallmark Eagle Ford Water-Based Fluid Performane.
[5] Watson, G. R., Barton, N. A., & Hargrave, G. K. (1997, January 1). Using New Computational Fluid Dynamics Techniques to Improve PDC Bit Performance. Society of Petroleum Engineers. doi:10.2118/37580-MS
[6] Romero, J., Chen, S., Anderle, S., & Arfele, R. (2013, March). A New Theory on Cutter Layout for Improving PDC Bit Performance in Hard and Transit Formation Drilling.
InInternational Petroleum Technology Conference. International Petroleum Technology Conference.
[7] Bilgesu, H. I., Tetrick, L. T., Altmis, U., Mohaghegh, S., & Ameri, S. (1997, January). A new approach for the prediction of rate of penetration (ROP) values. InSPE Eastern Regional Meeting. Society of Petroleum Engineers.
[8] Optimization of Weight On Bit During Drilling Operation Based on Rate of Penetration Model, Abd Rahman, Adib Mahfuz (2011).Universiti Teknologi PETRONAS.
[9] Bourgoyne, A. T., Millheim, K. K., Chenevert, M. E., & Young, F. (1986). Applied drilling engineering.
[10] Tuna, E., 2010. Real-time-optimization of drilling parameters during drilling operations (Thesis). Middle East Technical University,
[11] Kerr, C. J. (1988). PDC drill bit design and field application evolution.Journal of petroleum technology,40(03), 327-332.
[12] Gouda, G. M., Maestrami, M., Abu Saif, M. A., El-Moghrebi, S. S., Dahab, A. S. A.H., &
Farehat, M. S. (2011). A Mathematical Model To Compute The PdcCutter Wear Value To Terminate PDC Bit Run. Paper presented at the SPE Middle East Oil and Gas Show and Conference.
44
[13] Che, D., Han, P., Guo, P., & Ehmann, K. (2012). Issues in Polycrystalline Diamond Compact Cutter-Rock Interaction From a Metal Machining Point of View-Part I:
Temperature, Stresses, and Forces. Journal of Manufacturing Science and Engineering, Vol.
134.
[14] Nygaard, R., & Hareland, G. (2007). How to select PDC bit for optimal drilling performance. Paper presented at the The 2007 SPE Rocky Mountain Oil and Gas Technology Symposium, Denver, Colorado, USA. Paper no.: SPE.
[15] Barna Szabo, 1991, Finite Element Analysis, Canada, John Wiley and Sons Inc [16] Retrived from
http://www.ansys.com/Products/Simulation+technology/Structural+Analysis/Explicit+Dyna mics/Ansys-Autodyn/ , on 5 Disember, 2014

