Comparative Study of Correlation for the Densities of Ionic Liquids
By
Nur Eliana binti Shahrin
Dissertation submitted in partial fulfillment of the requirements for the
Bachelor of Engineering (Hons) (Chemical Engineering)
May 2013
Supervisor: Assoc. Prof. Dr. Khashayar Nasrifar Universiti Teknologi PETRONAS
Bandar Seri Iskandar
31750 Tronoh
Perak Darul Ridzuan
ii
CERTIFICATION OF APPROVAL
Comparative Study of Correlation for the Densities of Ionic Liquids
By
Nur Eliana binti Shahrin
A project dissertation submitted to the Chemical Engineering Program Universiti Teknologi PETRONAS in partial fulfillment of the requirement for the
BACHELOR OF ENGINEERING (Hons) (CHEMICAL ENGINEERING)
Approved by,
______________________
(Assoc. Prof. Dr. Khashayar Nasrifar)
Universiti Teknologi PETRONAS TRONOH, PERAK
May 2013
iii
CERTIFICATION OF ORIGINALITY
This is to certify that I am responsible for the work submitted in this project, that the original work is my own except as specified in the references and acknowledgements, and that the original work contained herein have not been undertaken or done by unspecified sources or persons.
_____________________________________
NUR ELIANA BINTI SHAHRIN Chemical Engineering
Universiti Teknologi PETRONAS
iv Abstract
This paper presents the comparative study of correlations as to estimate the densities of
ionic liquids. The correlations used in this study are of generalized correlation and the
one that is developed for the calculation of the density of saturated and normal liquid. 8
correlations are used in this study and the accuracy of the correlations is determined by
calculating the deviations. The generalized models used in the estimation of ionic liquids
density are Yamada and Gunn – YG (1973, pg. 234), Reid et al. – RR (1977), Bhirud –
BH (1978, pg. 1127), Hankinson and Thomson – HT (1979, pg. 653), Valderrama and
Abu Sharkh – VSY and VSD (1989, pg. 87), Mchaweh et al. – MH (2004, pg. 157) and
Valderrama and Zarricueta – VZ (2009, pg. 145). In this paper, 139 density data of
imidazolium based ionic liquids, 57 of ammonium based and 20 density data of
pyridinium based ionic liquids are assembled to conduct the study. The best correlation to
be used for the estimation of ionic liquids density is determined based on the lowest
deviations calculated.
v Acknowledgment
First of all, all praises be to Allah as for His willingness, I am able to complete the report and the project work. I would like to express my gratitude to Universiti Teknologi PETRONAS as in this course; I have the opportunity to be involved in managing a project on my own. This gives me the experiences of hectic deadlines and consequently challenges my problem solving and time management skills, which I believe will be useful in the future.
A full appreciation to my fellow supervisor, Dr. Khashayar Nasrifar, who had given me useful advises and guides for me to conduct the studies within the time constraints. Not to forget, the FYP coordinators for both semesters, Dr. Anis Suhaila binti Shuib and Dr. Nurhayati binti Mellon who have take a good care of us, the Chemical Engineering Final Year students and to keep us on track throughout these 2 semesters.
I would like to thank the lecturers that have given me advises and open up for any questions and helps that I need. Next, without my friends and fellow colleagues, it would also be a harsh semesters for me, thus, I would like to thanks them all for sharing their thoughts and useful tips.
Last but not least, I would like to thanks my family for their endless support and
those who have contributed, both directly and indirectly throughout the completion of the
project.
vi
TABLE OF CONTENTS
CERTIFICATION ii
ABSTRACT iv
ACKNOWLEDGEMENT v
CHAPTER 1: INTRODUCTION 1
1.1 Background of Study 1
1.2 Problem Statement 4
1.3 Objectives 5
1.4 Scope of Study 5
CHAPTER 2: LITERATURE REVIEW 6
2.1 Introduction 6
2.2 Valderrama and Zarricueta (2009) 6
2.3 Other Studies 8
2.4 Summary 10
CHAPTER 3: METHODOLOGY 11
3.1 Project Methodology 11
3.2 Selected Correlations for the Study 12
CHAPTER 4: RESULTS AND DISCUSSION 14
4.1 Average Absolute Percent Deviation – Result 14
4.2 Discussion 20
CHAPTER 5: CONCLUSION AND RECOMMENDATION 24
5.1 Conclusion 24
5.2 Recommendation 25
REFERENCES 26
APPENDICES 27
vii LIST OF FIGURES
Figure 3.1: Project Methodology Flowchart
Figure 4.1: Comparison of Deviations for Calculated Density of Ionic Liquids
LIST OF TABLES
Table 3.1: Model of Generalized Correlations Table 4.1: Average absolute percent deviation
Table 4.2: Deviations of experimental data and calculated density of imidazolium based ionic liquids
Table 4.3: Deviations of experimental data and calculated density of ammonium based ionic liquids
Table 4.4: Deviations of experimental data and calculated density of pyridinium based ionic liquids
ABBREVIATIONS AND NOMENCLATURES List of symbols
T
r: Reduced temperature T
br: Reduced base temperature T
c: Critical temperature T
b: Base temperature V
c: Critical volume M : Molecular weight Gas constant, R = 0.083145 List of basic equations
viii Greek Letters
: Density
c
: Critical density (M/V
c)
lit : Literature data of liquid density calc :
Calculated density of liquid : Accentric factor
: Parameters in VSY model : Parameters in Mchaweh model
δ : Parameters in Valderrama and Zarricueta model
∆ : Deviations
Abbreviations
BH Bhirud model
YG Yamada and Gunn model HT Hankinson and Thomson model LGM Linear generalized model MH Mchaweh model
RR Reid et al. model
VSY Valderrama and Abu Sharkh model
VSD Valderrama and Abu Sharkh model
VZ Valderrama and Zarricueta model
1
CHAPTER 1
INTRODUCTION
1. INTRODUCTION
1.1 Background of Study
Ionic liquids are molten salts at room-temperature and they are entirely comprised of ions; cation and anion (Shen et al., 2011, pg. 2690). They melt at low temperature – generally below normal boiling point of temperature of water – and thus existed in liquid phase under room temperature. Due to that reason, most ionic liquids are known as room temperature ionic liquids (RTIL) (Pratap Singh & Kumar Singh, 2011, pg. 1).
Currently, chemical industries and scientific communities have given their attention on the opportunities to utilize ionic liquids in as much application, replacing the conventional solvents in chemical processes (Shen et al., 2011, pg.
2690). This is due to the unique properties possessed by the substance which include; 1) negligible vapor pressure, 2) non-flammable, 3) good thermal and chemical stability, 4) low toxicity, 5) miscible with various compounds covering wide range of polarity, and most importantly, 6) the ability to be molecularly tuned or engineered for any specific applications (Shen et al., 2011, pg. 2690), (Roshan &
Ghader, 2012, pg. 33).
Abildskov et al. (2009, pg. 95) stated that ionic liquids can be used as
chemical reaction media, separation process fluids and for processing of metals and
2
polymers and electrolytes in electronic devices. Other possible applications of ionic liquids are extraction of metal from waste water through emulsion, as electrolytes in lithium rechargeable batteries and super-capacitors and as thermal fluids for heat storage (Hosseini et al., 2012, pg. 52). Due to these advantages and wide applications, they become the researchers’ focus and thus, knowing their properties becomes extremely important.
One of the important physical properties of a liquid is its density. As stated by Valderrama and Zarricueta (2009, pg. 145), liquid density is required in design problems, vessel sizing and liquid metering calculations. This property is usually measured experimentally and as for ionic liquids, there are many density data available as the result of the laboratory procedures for density identification of certain group of ionic liquids. However, due to the tunable properties of ionic liquids, lots of new ionic liquids are designed and hence, thousands of density data are required to be known. Due to this, the determination of density through experiments would be expensive and time consuming. Therefore, researchers need to come up with different method and that will be the estimation by using correlations.
Previous researchers had conducted various methods and developed several correlations in order to produce the most accurate result in estimating the density of ionic liquids. A group contribution method is one of the most practical choices in predicting the properties of ionic liquids. With the principle of assuming similar structures of chemical components in different molecules, chemical compounds are categorized based on the atoms and the bonds which then, a correlation can be developed. Thus, the properties of mixtures and pure components can be predicted by using the properties of the group or atom. Therefore, thousands of data on the properties of compounds would not be needed as knowing only hundreds of groups would be sufficient to estimate the properties of the constituents’ compounds.
The example of a group contribution method is the study by Qiao et al.
(2010). The paper presented the result of the density estimation based on 51 groups
3
of 123 pure ionic liquids with 13 binary ionic liquids mixtures, which shows the average relative error of 0.88% and the standard deviation of 0.0181.
Another commonly used method is through the developed correlations for the density estimation of ionic liquids. The correlations are basically generalized from the equations that are used for calculating the density of normal liquids. However, there are lacks of common basic data for ionic liquids, such as the critical temperature. As been stated in Valderrama and Zarricueta (2009), under low temperature, the ionic liquids start to decompose, especially at the temperatures approaching boiling point. This results in a failure to determine the critical properties of the ionic liquids. Therefore, under this circumstance, approximations of those properties are considered as reasonable option in order to estimate the density of ionic liquids. This is agreed by Qiao et al. (2010, pg. 852) which commands the necessities to estimate the properties of the compounds.
One of the previous studies which developed a generalized model for estimation of ionic liquids density is by Valderrama and Zarricueta (2009). The study had developed a model which considers much detail aspects of ionic liquids in order to yield more accurate results. The model includes the critical temperature, critical volume, normal boiling point and the molecular mass for the estimation of the density. The result shows that the model yields a low average deviation, which is 2.6% and can be applied for the estimation of ionic liquids density.
There are a lot of previous studies that presented the work in estimating the density of ionic liquids. However, these studies were only conducted on certain ionic liquids and do not provide much database in predicting the density of ionic liquids.
For example, the study by Valderrama and Zarricueta itself was considering only
146 ionic liquids from various groups of cations. Roshan and Ghader (2012, pg. 33)
conducted the study for only 48 ionic liquids which comprised of random groups of
cations, but mostly of imidazolium cation. Therefore, this study will estimate the
density of another 216 ionic liquids – 139 of imidazolium-based, 57 ammonium-
based and 20 pyridinium-based ionic liquids.
4
Through this study, this paper will present 8 correlations that are studied comparatively in order to determine the best correlations to be used to determine the density of ionic liquids. The selected correlations, except of Valderrama and Zarricueta, have not yet been applied for predicting density of ionic liquids. The accuracy of the correlations will be determined through the determination of absolute percent deviation for the calculated density of individual ionic liquids.
1.2 Problem Statement
According to the authors of previous papers, the density of ionic liquids can be estimated via correlations and yet, there are numbers of correlations developed for predicting the densities of normal liquids. However, the correlations could not be simply applied to estimate the density of ionic liquids, as critical properties are required for the estimation.
As been mentioned in the previous sub-chapter, the critical properties of ionic liquids could not be determined experimentally. Due to that reason, there are only few records on the correlations for calculating the density of ionic liquids. This leads researchers to developed correlations from various methods including the group contribution method and generalized models for the estimation of the density of ionic liquids.
It is stated that a good approximation values of the critical properties can be
considered in order to apply the correlations of normal liquids for predicting the
density of ionic liquids. Therefore, the accuracy of the correlations needs to be
calculated. In this study, the most appropriate correlations will be selected among
the 8 that are selected as the focus of this study.
5 1.3 Objectives
The main objective of this study is to determine the accuracy of the generalized correlations of liquid density in the estimation of the density of ionic liquids through calculation of relative and absolute percent deviations. It is essential to determine the density of ionic liquids via generalized correlations since there are some of the compounds that do not acquire any experimental data. Therefore, by determining the accuracy based on the experimental and the calculated density data, the best correlations can be highlighted and can be utilized for the estimation of the density of ionic liquids.
1.4 Scope of Study
In this project, the scope of study coverage is listed as follows:
- The assembled of ionic liquid density data of imidazolium-, ammonium- and pyridinium-based in different temperature range
- Finding at least 7 generalized density correlations available in the literature for the estimation of ionic liquid density
- Identifying the critical properties of ionic liquids (T
b, T
c, P
c, V
c, ⍵, etc.) and the required parameters based on the collected correlations
- Calculation of relative and absolute percent deviations of calculated density
and the experimental data for determining the accuracy of the correlations
used
6
CHAPTER 2
LITERATURE REVIEW
2.1 Introduction
As been mentioned in the previous chapter, researchers have come up with generalized correlations for estimating the density of ionic liquids. However, the existing correlations for calculating the density of normal liquids are expected to be possible for the estimation of ionic liquids density, by approximating the critical properties of the ionic liquids. Therefore, this study will be focusing on determining the accuracy of the correlations by calculating the percent deviations and hence, selecting the best correlations that yield the lowest deviations among others.
In this chapter, the studies done by previous authors will be presented as to give an overview on the project work. Afterwards, the problems addressed in the previous chapter will be further explained and the solutions to overcome the problems will be highlighted with accordance to the referred papers.
2.2 Valderrama and Zarricueta (2009)
The study conducted is basically determining the best correlations for estimating the
density of ionic liquids. The previous work that has the closest similarity by which
becoming the main reference for this project is the study by Valderrama and
7
Zarricueta (2009). In the paper, a simple model is developed for predicting the density of ionic liquids.
The model is a generalized correlation which is modified and includes the use of experimental data that is used to fit the parameters. The model also uses the critical temperature, critical volume, normal boiling temperature and the molecular mass as to estimate the density of ionic liquids. The correlation, which is named as Linear Generalized Model (LGM) is presented below:
Where,
The constants a, b, c, d and δ were determined in the study using the literature density data of ionic liquids and valid for any ionic liquid for future studies; where, a
= 0.3411; b = 2.0443; c = 0.5386; d = 0.0393; δ = 1.0476. In the study, Valderrama and Zarricueta had selected 146 random ionic liquids with 602 density data as their main focus. The calculated density is then compared with the literature density data of the respective ionic liquids to determine the percent deviations. The generalized model is studied comparatively with other 10 correlations which are used for the estimation of normal liquids density.
From the study, the deviations for each applied correlation is calculated and
compared as to determine which correlation resulted in the lowest percentage. The
result of the study shows that the LGM yield the average absolute percent deviation of
2.6% which is the lowest compared to others. The paper had proven that the
generalized model can be used confidently in estimating the density of any ionic
8
liquids. This is most probably due to the used of the constants obtained from the literature density data which provides the validity for the applications of other ionic liquids. Therefore, in the study, for 146 ionic liquids, it is presented that the best correlation would be the LGM.
2.3 Other Studies
There are various studies that have been conducted as to develop generalized correlations for estimating the density of ionic liquids. The following examples are the few studies that were done previously based on different methods. Nevertheless, the studies share the same goal; to develop an accurate correlation for predicting the density of ionic liquid.
2.3.1 Gardas and Coutinho (2008)
In the study done by Gardas and Coutinho (2008, pg. 26), the estimation of densities of ionic liquids is basically the extension of the Ye and Shreeve group contribution method. Ye and Shreeve (2007) had proposed a method for the estimation of ionic liquids densities based on group additivity and calculated volume parameters of groups and fragments for the stated estimation. Although, the model is reported to be simple, the method is not straightforward.
The extension studies had tested to estimate the density of ionic liquids in
wide ranges of temperature and pressure using the proposed parameter table from Ye
and Shreeve (2007). The coefficients of the new density correlation were estimated
using experimental densities data of nine ionic liquids which are of imidazolium,
pyridinium, pyrrolidinium and phosphonium cations.
9
Shown above is the correlations used by Gardas and Coutinho in order to determine the density of ionic liquids. The coefficients a, b and c can be estimated by fitting the equations with experimental data, W is the molar mass (kg/mol
-1), N is the Avogadro constant and V
0(m
3) molecular volume at the reference temperature, T
0and pressure, P
0. Based on the studies, the prediction are considered successful with experimental literature data in a wide range of temperatures (273.15-393.15 K) and pressures (0.10-100 MPa) with the mean percentage deviation (MPD) of 0.45%
for imidazolium-based ionic liquids, 1.49% for phosphonium-based ionic liquids, 0.41% for pyridinium-based and 1.57% for pyrrolidinium-based ionic liquids.
2.3.2 Chong Shen et al. (2011)
Other studies had also been conducted on the prediction of ionic liquids densities and some had presented the extension studies done by the previous researchers as to obtain further results on the prediction of ionic liquids densities. Chong Shen, et al.
(2011, pg. 2690) had extended the group contribution model by Valderrama and Robles into the prediction of densities and critical properties of ionic liquids at varying temperatures and pressures. Shown below is the correlation used in the study.
As seen above, the correlation is simple and does not require any complex
calculations.
10
2.3.3 Valderrama and Rojas (2010)
Valderrama and Rojas (2010, pg. 107) had proposed a general model for the density estimation based on the concept that was first introduced by Randic (1975). The new proposed concept is reported to be much easier to calculate than any of the connectivity indexes available in the literature. The correlation is defined as follows.
Where is the density at T
0= 298 K and λ is the mass connectivity index of the ionic liquids.
2.4 Summary
Presented above are few examples of developed and generalized correlations for the estimation of ionic liquid density. The correlations had been tested and the results give a feasible value of deviation, which is then agreed to have a good capability to estimate the density of ionic liquids.
However, it has been a wonder for researchers whether a correlation for estimating the density of pure and normal liquids is applicable for that of ionic liquids. The previous authors were then interested to carry out studies to determine the accuracy of the correlations. The studies were carried out on different type and groups of ionic liquids. As known, ionic liquid is a unique solvent which can be engineered and thus, newly developed ionic liquids are produced day by day.
Therefore, this study is carried out on another 214 ionic liquids which is
collected from Lazzus (2009) and the focus would be on -imidazolium, -ammonium
and –pyridinium based ionic liquids. This study is a continuation from Valderrama
and Zarricueta (2009), which a target is set – to determine the best correlation and
calculating the deviations for each of selected ionic liquid.
11
CHAPTER 3 METHODOLOGY
3.1 Project Methodology
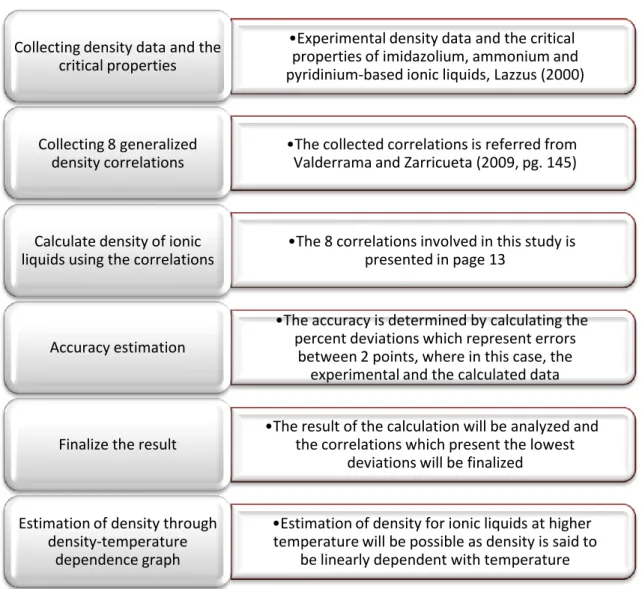
Generally, the methodology for the project is the analysis and reviews of previous studies and literatures. Specifically, the sequence of the project work is as shown in the diagram below.
Figure 3.1: Project Methodology Flowchart
•Experimental density data and the critical properties of imidazolium, ammonium and pyridinium-based ionic liquids, Lazzus (2000) Collecting density data and the
critical properties
•The collected correlations is referred from Valderrama and Zarricueta (2009, pg. 145) Collecting 8 generalized
density correlations
•The 8 correlations involved in this study is presented in page 13
Calculate density of ionic liquids using the correlations
•The accuracy is determined by calculating the percent deviations which represent errors
between 2 points, where in this case, the experimental and the calculated data Accuracy estimation
•The result of the calculation will be analyzed and the correlations which present the lowest
deviations will be finalized Finalize the result
•Estimation of density for ionic liquids at higher temperature will be possible as density is said to
be linearly dependent with temperature Estimation of density through
density-temperature
dependence graph
12
3.2 Selected Correlations for the Study
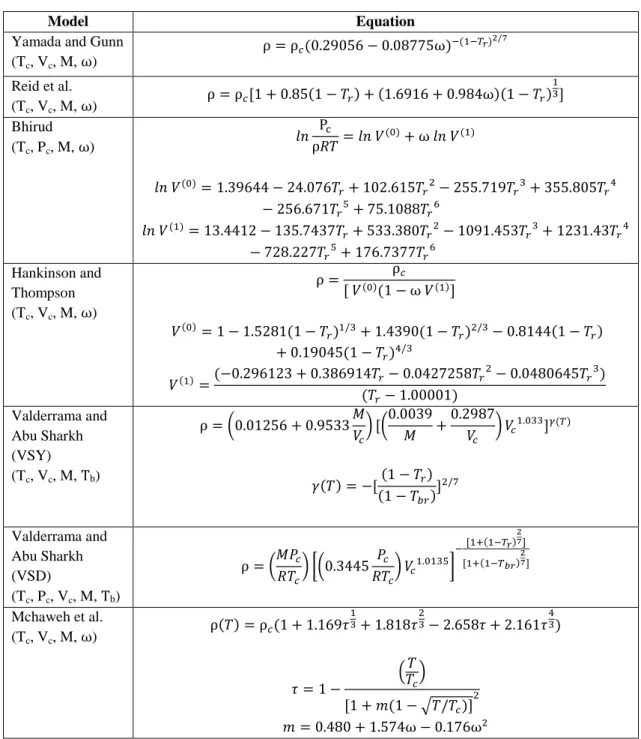
The generalized correlations for the estimation of ionic liquids density used in this study is as presented as follows.
Table 3.1: Model of Generalized Correlations
Model Equation
Yamada and Gunn
(T
c, V
c, M, ⍵)
⍵Reid et al.
(T
c, V
c, M, ⍵)
⍵Bhirud
(T
c, P
c, M, ⍵)
⍵
Hankinson and Thompson (T
c, V
c, M, ⍵)
⍵
Valderrama and Abu Sharkh (VSY) (T
c, V
c, M, T
b)
Valderrama and Abu Sharkh (VSD)
(T
c, P
c, V
c, M, T
b)
Mchaweh et al.
(T
c, V
c, M, ⍵)
⍵ ⍵
13 Valderrama and
Zarricueta (T
c, T
b, V
c, M)
a = 0.3411; b = 2.0443; c = 0.5386; d = 0.0393; δ = 1.0476
The deviations are calculated using the following equation.
Average relative percent deviation,
Average absolute percent deviation,
Based on the generalized correlations, the estimated density of ionic liquids
and the deviations is calculated as to determine the approximate error of each of the
presented model. The result is as shown in the following chapter.
14
CHAPTER 4
RESULTS AND DISCUSSION
The 216 ionic liquids which are of imidazolium, pyridinium and ammonium based cations are arranged and the calculated density is determined. The project fully utilized Microsoft Excel as to calculate the estimated density. The spreadsheet of the calculation, together with the properties and important values of the selected ionic liquids is presented in the Appendix.
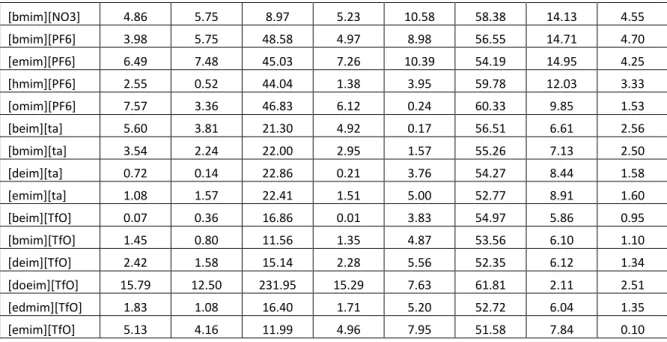
4.1 Average Absolute Percent Deviation – Result
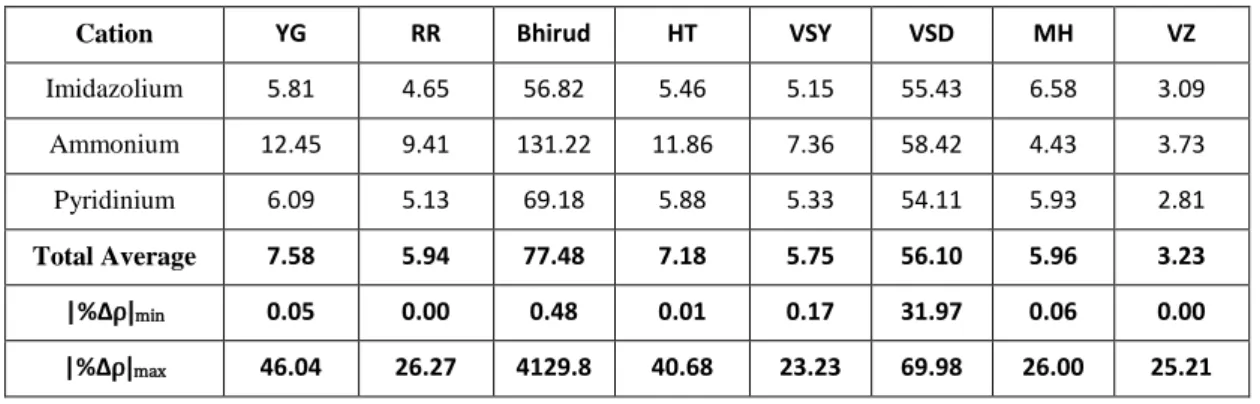
The following table presents the deviations between the experimental density data of ionic liquids and the estimated density, calculated from the generalized models, the average absolute percent deviation with the minimum and maximum values calculated from individual ionic liquids.
Table 4.1: Average absolute percent deviation, |%∆
Cation YG RR Bhirud HT VSY VSD MH VZ
Imidazolium 5.81 4.65 56.82 5.46 5.15 55.43 6.58 3.09 Ammonium 12.45 9.41 131.22 11.86 7.36 58.42 4.43 3.73 Pyridinium 6.09 5.13 69.18 5.88 5.33 54.11 5.93 2.81
Total Average 7.58 5.94 77.48 7.18 5.75 56.10 5.96 3.23
|%∆ min 0.05 0.00 0.48 0.01 0.17 31.97 0.06 0.00
|%∆ max 46.04 26.27 4129.8 40.68 23.23 69.98 26.00 25.21
15
Referring to Table 4.1, it is shown that Valderrama and Zarricueta model represent the lowest average absolute percent deviations. Table 4.2, 4.3 and 4.4 shows the deviation of the ionic liquids, individually.
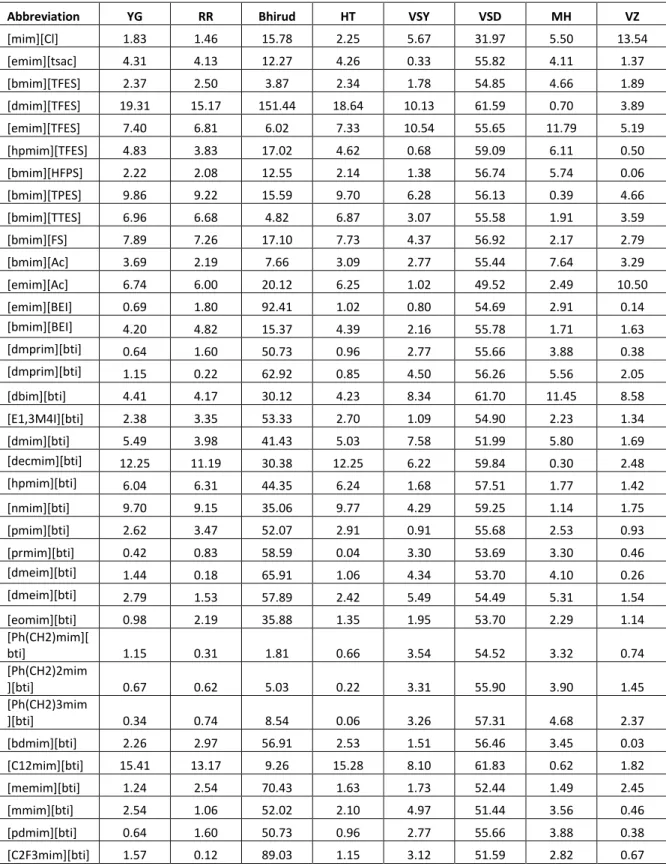
Table 4.2: Deviations of experimental data and calculated density of imidazolium based ionic liquids
Abbreviation YG RR Bhirud HT VSY VSD MH VZ
[mim][Cl] 1.83 1.46 15.78 2.25 5.67 31.97 5.50 13.54
[emim][tsac] 4.31 4.13 12.27 4.26 0.33 55.82 4.11 1.37
[bmim][TFES] 2.37 2.50 3.87 2.34 1.78 54.85 4.66 1.89
[dmim][TFES] 19.31 15.17 151.44 18.64 10.13 61.59 0.70 3.89
[emim][TFES] 7.40 6.81 6.02 7.33 10.54 55.65 11.79 5.19
[hpmim][TFES] 4.83 3.83 17.02 4.62 0.68 59.09 6.11 0.50
[bmim][HFPS] 2.22 2.08 12.55 2.14 1.38 56.74 5.74 0.06
[bmim][TPES] 9.86 9.22 15.59 9.70 6.28 56.13 0.39 4.66
[bmim][TTES] 6.96 6.68 4.82 6.87 3.07 55.58 1.91 3.59
[bmim][FS] 7.89 7.26 17.10 7.73 4.37 56.92 2.17 2.79
[bmim][Ac] 3.69 2.19 7.66 3.09 2.77 55.44 7.64 3.29
[emim][Ac] 6.74 6.00 20.12 6.25 1.02 49.52 2.49 10.50
[emim][BEI] 0.69 1.80 92.41 1.02 0.80 54.69 2.91 0.14
[bmim][BEI] 4.20 4.82 15.37 4.39 2.16 55.78 1.71 1.63
[dmprim][bti] 0.64 1.60 50.73 0.96 2.77 55.66 3.88 0.38
[dmprim][bti] 1.15 0.22 62.92 0.85 4.50 56.26 5.56 2.05
[dbim][bti] 4.41 4.17 30.12 4.23 8.34 61.70 11.45 8.58
[E1,3M4I][bti] 2.38 3.35 53.33 2.70 1.09 54.90 2.23 1.34
[dmim][bti] 5.49 3.98 41.43 5.03 7.58 51.99 5.80 1.69
[decmim][bti] 12.25 11.19 30.38 12.25 6.22 59.84 0.30 2.48
[hpmim][bti] 6.04 6.31 44.35 6.24 1.68 57.51 1.77 1.42
[nmim][bti] 9.70 9.15 35.06 9.77 4.29 59.25 1.14 1.75
[pmim][bti] 2.62 3.47 52.07 2.91 0.91 55.68 2.53 0.93
[prmim][bti] 0.42 0.83 58.59 0.04 3.30 53.69 3.30 0.46
[dmeim][bti] 1.44 0.18 65.91 1.06 4.34 53.70 4.10 0.26
[dmeim][bti] 2.79 1.53 57.89 2.42 5.49 54.49 5.31 1.54
[eomim][bti] 0.98 2.19 35.88 1.35 1.95 53.70 2.29 1.14
[Ph(CH2)mim][
bti] 1.15 0.31 1.81 0.66 3.54 54.52 3.32 0.74
[Ph(CH2)2mim
][bti] 0.67 0.62 5.03 0.22 3.31 55.90 3.90 1.45
[Ph(CH2)3mim
][bti] 0.34 0.74 8.54 0.06 3.26 57.31 4.68 2.37
[bdmim][bti] 2.26 2.97 56.91 2.53 1.51 56.46 3.45 0.03
[C12mim][bti] 15.41 13.17 9.26 15.28 8.10 61.83 0.62 1.82
[memim][bti] 1.24 2.54 70.43 1.63 1.73 52.44 1.49 2.45
[mmim][bti] 2.54 1.06 52.02 2.10 4.97 51.44 3.56 0.46
[pdmim][bti] 0.64 1.60 50.73 0.96 2.77 55.66 3.88 0.38
[C2F3mim][bti] 1.57 0.12 89.03 1.15 3.12 51.59 2.82 0.67
16
[bmim][Br] 1.11 1.12 5.93 1.35 5.16 51.59 7.57 2.47
[moeemim][Cl] 4.29 3.64 2.87 3.91 0.55 52.91 4.74 5.61
[bmim][Cl] 3.58 3.57 1.14 3.86 7.14 51.47 9.60 3.00
[hmim][Cl] 1.26 0.65 2.22 0.85 3.32 53.77 7.29 4.09
[omim][Cl] 5.50 4.05 3.60 4.94 0.21 56.14 5.92 4.24
[Bemim][Cl] 2.60 2.83 11.47 2.80 7.10 55.43 10.10 0.50
[C12mim][Cl] 24.57 20.40 13.42 23.55 15.34 56.45 4.87 13.56
[emim][Cl] 10.55 10.17 7.18 10.72 13.25 50.62 14.51 1.20
[mmim][Cl] 5.51 4.96 19.16 5.66 8.08 44.63 8.87 6.34
[ClBenmim][Cl] 0.75 0.19 11.39 0.53 4.35 56.20 8.22 0.09
[FBenMim][Cl] 3.24 3.84 1.46 3.53 8.07 57.09 11.84 3.01
[dbim][Cl] 3.94 2.93 2.70 3.45 1.21 54.75 6.05 4.77
[bmim][dca] 9.09 4.98 97.03 8.26 1.76 61.18 9.49 0.59
[emim][dca] 8.26 5.28 87.34 7.58 1.53 58.15 7.63 2.52
[omim][dca] 15.10 8.74 160.03 13.97 2.15 64.02 8.66 1.58
[emim][dca] 8.26 5.28 87.34 7.58 1.53 58.15 7.63 2.52
[emim][DEGly
MSO4] 5.81 5.42 146.55 5.79 0.39 56.88 3.70 2.25
[dmim][DMPO
4] 2.59 2.44 3.39 2.34 1.73 51.21 4.74 5.23
[edmim][ESO4] 0.14 0.16 10.56 0.22 5.50 51.64 5.90 2.79
[emim][ESO4] 0.74 0.11 82.18 0.62 5.68 53.15 5.77 2.06
[moim][PF6] 6.54 2.22 43.14 5.18 1.24 61.94 11.21 3.38
[moeemim][PF
6] 12.94 8.95 40.43 11.62 5.00 57.38 4.63 3.91
[bdmim][PF6] 10.70 7.16 38.79 9.38 3.27 56.38 5.51 4.06
[hpmim][PF6] 7.55 3.25 42.36 6.16 0.43 60.73 10.17 1.90
[nmim][PF6] 12.33 6.67 39.90 10.74 3.04 62.33 8.70 1.15
[oprim][PF6] 21.94 15.23 34.37 20.17 11.45 60.59 2.07 5.58
[pmim][PF6] 2.14 0.87 43.00 0.99 4.36 59.29 12.26 3.35
[eommim][PF6
] 2.84 0.62 43.43 1.81 2.89 55.58 9.67 0.10
[mommim][PF
6] 1.74 3.38 45.30 2.64 6.65 55.09 12.41 2.63
[Ph(CH2)3mim
][PF6] 2.08 0.98 38.16 1.20 4.47 62.36 13.03 6.19
[prmim][PF6] 3.01 1.03 40.39 2.01 2.40 54.38 8.85 1.45
[C2C6I][PF6] 7.53 3.23 42.37 6.14 0.44 60.74 10.19 1.92
[C2C8I][PF6] 12.35 6.69 39.89 10.76 3.05 62.32 8.68 1.14
[bmim][HSO4] 6.47 4.21 233.90 6.06 4.95 59.25 7.99 1.00
[emim][HSO4] 3.09 1.62 229.11 2.79 7.61 57.69 9.02 1.67
[mim][HSO4] 11.82 9.38 330.05 11.27 2.51 53.88 3.22 4.65
[bmim][I] 4.70 4.71 15.19 4.50 0.72 49.82 2.25 6.33
[bmim][mesy] 1.40 0.90 4.00 1.48 6.37 49.04 5.92 4.27
[emim][mesy] 4.84 4.02 87.22 4.69 9.47 52.56 8.56 0.16
[dmim][MOES
O4] 1.72 1.16 80.86 1.60 6.61 54.40 7.06 0.00
[dmim][MSO4] 3.63 2.71 93.70 3.44 8.19 51.09 6.97 1.36
[bmim][MSO4] 0.20 0.62 80.70 0.28 4.99 54.43 5.81 1.69
[bmim][NfO] 5.97 5.65 28.41 5.86 3.46 56.61 2.89 2.21
17
[omim][NfO] 12.47 10.61 5.67 12.12 8.24 59.78 1.46 2.99
[bmim][C8S] 21.92 19.20 378.40 21.53 12.53 57.54 4.74 10.53
[moeoemim][B
F4] 16.45 11.22 25.49 14.57 5.09 55.10 3.51 6.82
[bdmim][BF4] 16.56 11.92 19.87 14.63 5.75 51.83 1.91 10.41
[dmim][BF4] 24.00 15.83 24.13 21.63 9.96 59.64 2.37 6.66
[prmim][BF4] 1.81 0.75 23.82 0.39 6.03 51.62 10.94 1.83
[moemim][BF4
] 7.26 4.14 23.73 5.74 1.46 51.54 7.23 4.83
[mommim][BF
4] 2.54 0.13 24.82 1.18 5.18 50.50 9.92 2.53
[bmim][tca] 16.43 16.45 7.67 16.46 18.44 63.68 22.68 14.09
[emim][SCN] 21.86 21.45 0.48 21.81 23.15 63.15 26.00 16.50
[emim][ta] 8.83 9.27 29.49 9.24 12.45 56.19 15.99 6.20
[mpmi][TfO] 9.19 9.39 29.50 9.24 4.28 52.09 1.61 7.53
[dbim][TfO] 0.64 1.08 12.97 0.76 5.52 59.15 9.46 3.48
[Bemim][TfO] 6.79 7.23 66.73 6.91 2.30 52.86 0.13 6.10
[omim][TfO] 15.40 14.43 48.79 15.21 9.23 54.72 3.65 10.07
[dmpim][TME
M] 4.89 3.24 24.92 4.32 6.11 56.02 5.79 4.59
[bmim][TMEM
] 3.51 1.78 22.98 2.92 4.59 54.83 3.98 2.74
[bmim][BF4] 0.18 2.78 26.45 1.55 7.85 54.16 12.93 0.84
[emim][BF4] 2.31 3.85 21.40 3.46 8.68 48.92 12.25 1.65
[hmim][BF4] 5.92 1.93 27.78 4.28 3.43 56.97 10.48 0.37
[omim][BF4] 12.60 7.23 31.68 10.59 1.54 57.33 7.11 3.26
[beim][bti] 0.05 0.97 37.56 0.28 3.11 56.09 4.24 0.80
[bmim][bti] 1.03 0.18 40.04 0.66 3.81 54.89 4.13 0.51
[deim][bti] 1.55 0.19 42.47 1.14 4.09 53.45 3.65 0.18
[dmeim][bti] 2.74 1.48 57.89 2.37 5.45 54.47 5.27 1.50
[dmim][bti] 5.54 4.04 55.94 5.09 7.63 51.86 5.83 1.67
[edmim][bti] 3.60 2.35 45.15 3.22 6.28 55.02 6.13 2.44
[eDmim][bti] 1.96 0.69 47.62 1.58 4.69 54.26 4.53 0.79
[emim][bti] 4.66 3.22 40.57 4.23 6.92 53.26 5.80 1.88
[hmim][bti] 2.24 3.03 1526.31 2.49 1.19 55.90 2.98 0.62
[ibmim][bti] 1.22 0.05 33.54 0.83 3.85 54.55 3.96 0.34
[mdeim][bti] 0.42 0.70 45.63 0.07 3.43 55.21 4.05 0.46
[meim][bti] 5.09 3.66 51.00 4.66 7.34 53.32 6.20 2.24
[moemim][bti] 5.85 4.53 16.81 5.45 7.90 55.73 7.86 4.16
[omim][bti] 5.23 5.41 127.45 5.37 0.98 57.90 2.62 0.62
[tfemim][bti] 5.44 4.09 42.99 5.05 6.81 54.26 6.89 3.50
[omim][Cl] 1.01 0.02 7.72 0.54 3.95 56.99 8.90 1.17
[emim][EtSO4] 3.90 3.11 48.48 3.76 8.27 52.64 7.73 0.54
[bmim][hb] 28.87 26.27 33.48 27.95 23.23 49.04 12.95 22.23
[emim][hb 2.10 0.97 47.58 1.52 1.29 55.57 7.92 0.40
[beim][MsO] 2.77 2.28 66.36 2.68 7.56 55.66 8.23 0.41
[emim][MsO] 8.27 7.34 78.43 8.08 12.37 53.25 11.07 2.29
[beim][NfO] 5.67 5.26 27.06 5.55 3.16 57.61 3.50 1.41
[emim][NfO] 5.22 4.91 32.56 5.10 2.91 56.92 3.51 1.72
18
[bmim][NO3] 4.86 5.75 8.97 5.23 10.58 58.38 14.13 4.55
[bmim][PF6] 3.98 5.75 48.58 4.97 8.98 56.55 14.71 4.70
[emim][PF6] 6.49 7.48 45.03 7.26 10.39 54.19 14.95 4.25
[hmim][PF6] 2.55 0.52 44.04 1.38 3.95 59.78 12.03 3.33
[omim][PF6] 7.57 3.36 46.83 6.12 0.24 60.33 9.85 1.53
[beim][ta] 5.60 3.81 21.30 4.92 0.17 56.51 6.61 2.56
[bmim][ta] 3.54 2.24 22.00 2.95 1.57 55.26 7.13 2.50
[deim][ta] 0.72 0.14 22.86 0.21 3.76 54.27 8.44 1.58
[emim][ta] 1.08 1.57 22.41 1.51 5.00 52.77 8.91 1.60
[beim][TfO] 0.07 0.36 16.86 0.01 3.83 54.97 5.86 0.95
[bmim][TfO] 1.45 0.80 11.56 1.35 4.87 53.56 6.10 1.10
[deim][TfO] 2.42 1.58 15.14 2.28 5.56 52.35 6.12 1.34
[doeim][TfO] 15.79 12.50 231.95 15.29 7.63 61.81 2.11 2.51
[edmim][TfO] 1.83 1.08 16.40 1.71 5.20 52.72 6.04 1.35
[emim][TfO] 5.13 4.16 11.99 4.96 7.95 51.58 7.84 0.10
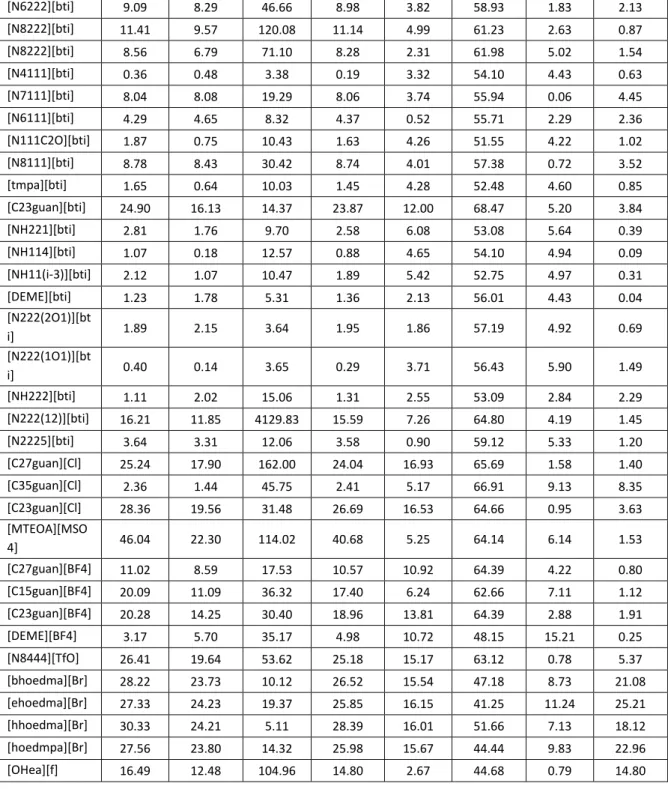
Table 4.3: Deviations of experimental data and calculated density of ammonium based ionic liquids
Abbreviation YG RR Bhirud HT VSY VSD MH VZ
[TEA][tsac] 3.48 1.96 28.80 2.97 2.18 59.10 8.14 1.91
[TMAIA][tsac] 4.10 3.63 27.13 3.78 0.45 54.22 4.42 2.71
[TMEA][tsac] 3.22 2.94 28.58 2.93 0.98 53.16 4.54 2.96
[TMiPA][tsac] 1.27 0.76 30.23 0.94 3.09 55.77 7.18 0.24
[TMPA][tsac] 3.76 3.11 28.86 3.39 0.92 55.07 5.29 1.80
[NH221][BEI] 0.36 1.10 24.69 0.50 1.84 54.97 4.20 0.03
[NH11(i-
3)][BEI] 0.96 0.22 25.68 0.81 3.12 55.56 5.45 1.33
[C27guan][bti] 22.05 13.43 47.56 21.14 10.88 69.98 7.66 7.16
[C15guan][bti] 7.42 3.93 176.87 6.98 0.90 66.44 10.41 7.84
[N723'3'][bti] 9.23 7.27 217.75 8.97 2.89 62.68 5.03 1.85
[BNM2E][bti] 1.77 2.39 1.38 1.89 1.57 54.99 3.49 1.36
[N1123][bti] 0.36 0.48 3.38 0.19 3.32 54.10 4.43 0.63
[N1134][bti] 3.51 3.87 7.51 3.59 0.23 56.04 3.02 1.60
[tda][bti] 9.02 8.91 67.83 9.39 13.38 64.99 1.45 3.38
[thpa][bti] 29.40 20.84 26.23 28.44 18.49 67.62 0.93 0.24
[tha][bti] 30.48 22.12 40.26 29.42 18.22 66.17 0.63 2.26
[tpa][bti] 23.53 17.58 273.53 22.72 12.99 64.87 0.89 1.55
[toa][bti] 27.35 20.79 53.11 26.77 20.58 67.06 0.59 0.29
[N7444][bti] 22.11 16.84 251.90 21.40 12.15 64.39 0.85 1.73
[N6444][bti] 23.55 18.89 473.44 22.92 14.03 62.80 1.74 4.59
[N1444][bti] 9.47 8.20 51.86 9.27 3.69 60.19 2.82 0.93
[N8444][bti] 28.21 22.01 171.41 27.39 17.26 63.75 2.74 5.21
[N7222][bti] 10.18 8.89 73.76 9.99 4.35 60.13 2.27 1.45
19
[N6222][bti] 9.09 8.29 46.66 8.98 3.82 58.93 1.83 2.13
[N8222][bti] 11.41 9.57 120.08 11.14 4.99 61.23 2.63 0.87
[N8222][bti] 8.56 6.79 71.10 8.28 2.31 61.98 5.02 1.54
[N4111][bti] 0.36 0.48 3.38 0.19 3.32 54.10 4.43 0.63
[N7111][bti] 8.04 8.08 19.29 8.06 3.74 55.94 0.06 4.45
[N6111][bti] 4.29 4.65 8.32 4.37 0.52 55.71 2.29 2.36
[N111C2O][bti] 1.87 0.75 10.43 1.63 4.26 51.55 4.22 1.02
[N8111][bti] 8.78 8.43 30.42 8.74 4.01 57.38 0.72 3.52
[tmpa][bti] 1.65 0.64 10.03 1.45 4.28 52.48 4.60 0.85
[C23guan][bti] 24.90 16.13 14.37 23.87 12.00 68.47 5.20 3.84
[NH221][bti] 2.81 1.76 9.70 2.58 6.08 53.08 5.64 0.39
[NH114][bti] 1.07 0.18 12.57 0.88 4.65 54.10 4.94 0.09
[NH11(i-3)][bti] 2.12 1.07 10.47 1.89 5.42 52.75 4.97 0.31
[DEME][bti] 1.23 1.78 5.31 1.36 2.13 56.01 4.43 0.04
[N222(2O1)][bt
i] 1.89 2.15 3.64 1.95 1.86 57.19 4.92 0.69
[N222(1O1)][bt
i] 0.40 0.14 3.65 0.29 3.71 56.43 5.90 1.49
[NH222][bti] 1.11 2.02 15.06 1.31 2.55 53.09 2.84 2.29
[N222(12)][bti] 16.21 11.85 4129.83 15.59 7.26 64.80 4.19 1.45
[N2225][bti] 3.64 3.31 12.06 3.58 0.90 59.12 5.33 1.20
[C27guan][Cl] 25.24 17.90 162.00 24.04 16.93 65.69 1.58 1.40
[C35guan][Cl] 2.36 1.44 45.75 2.41 5.17 66.91 9.13 8.35
[C23guan][Cl] 28.36 19.56 31.48 26.69 16.53 64.66 0.95 3.63
[MTEOA][MSO
4] 46.04 22.30 114.02 40.68 5.25 64.14 6.14 1.53
[C27guan][BF4] 11.02 8.59 17.53 10.57 10.92 64.39 4.22 0.80
[C15guan][BF4] 20.09 11.09 36.32 17.40 6.24 62.66 7.11 1.12
[C23guan][BF4] 20.28 14.25 30.40 18.96 13.81 64.39 2.88 1.91
[DEME][BF4] 3.17 5.70 35.17 4.98 10.72 48.15 15.21 0.25
[N8444][TfO] 26.41 19.64 53.62 25.18 15.17 63.12 0.78 5.37
[bhoedma][Br] 28.22 23.73 10.12 26.52 15.54 47.18 8.73 21.08
[ehoedma][Br] 27.33 24.23 19.37 25.85 16.15 41.25 11.24 25.21
[hhoedma][Br] 30.33 24.21 5.11 28.39 16.01 51.66 7.13 18.12
[hoedmpa][Br] 27.56 23.80 14.32 25.98 15.67 44.44 9.83 22.96
[OHea][f] 16.49 12.48 104.96 14.80 2.67 44.68 0.79 14.80
Table 4.4: Deviations of experimental data and calculated density of pyridinium based ionic liquids
Abbreviation YG RR Bhirud HT VSY VSD MH VZ
[4MOPY][BEI] 10.84 9.69 35.12 10.79 6.66 60.84 1.69 0.71
[bmpy][bti] 0.83 1.81 111.15 1.13 2.21 55.34 3.44 0.25
[N-epy][bti] 4.68 3.24 42.97 4.26 6.71 52.19 5.44 1.22
[pmpy][bti] 0.51 0.66 187.26 0.17 3.25 54.25 3.67 0.19
20
[N-bupy][bti] 1.67 0.42 155.21 1.31 4.16 54.18 4.30 0.42
[mbpyr][bti] 5.46 6.49 120.85 5.78 2.28 53.29 1.00 4.85
[bpyr][bti] 4.95 3.74 143.27 4.60 7.35 55.71 7.49 3.74
[4MOPY][bti] 9.10 8.83 61.12 9.19 4.28 58.47 0.69 2.38
[4MOPY][dca] 20.09 12.75 143.36 18.77 6.19 63.42 5.94 1.17
[py][EOESO4] 1.30 0.31 65.55 1.08 5.35 51.16 4.60 3.05
[N-bupy][PF6] 7.92 6.10 40.73 6.85 2.75 50.72 3.69 7.71
[N-epy][BF4] 6.79 7.95 26.84 7.88 12.34 47.77 15.35 0.91
[bpyr][BF4] 0.95 3.14 28.89 2.31 8.00 51.52 12.56 0.50
[4MOPY][BF4] 15.76 9.49 29.93 13.62 3.98 58.69 6.09 3.73
[N-epy][ta] 0.95 0.62 23.91 0.50 2.59 50.03 6.36 4.95
[mbpyr][TfO] 10.24 10.69 14.12 10.27 6.22 49.56 3.92 11.79
[4MOPY][TfO] 8.75 7.71 22.86 8.52 3.10 57.74 2.57 3.47
[mbupy][BF4] 3.14 0.00 28.87 1.56 5.17 53.78 11.01 1.17
[N-bupy][BF4] 1.81 3.79 32.41 3.20 8.72 49.41 12.78 1.10
4.2 Discussion
The result of the comparative study is as shown in the previous sub-chapter. It is mentioned earlier that the comparative study is carried out within 8 correlations, by which 7 are the one used for calculating the density of normal liquids, whilst the other one is a generalized model for estimating the density of ionic liquids.
The normal liquid correlations were selected because the main objective of this project is to determine the accuracy of normal liquids correlations to be applied to ionic liquids as to check the feasibility of the correlations. This is because, if the accuracy is known, the correlation that yields low percent deviation can be considered as one of the alternative to estimate the density of ionic liquids.
From the data above, the generalized model by Valderrama and Zarricueta
yields the lowest percentage of deviations, with the average of 3.23%. Meanwhile,
the highest percentage of deviation is produced by Bhirud’s model with the average
of 77.48%. The minimum and maximum deviations are also shown in Table 4.1.
21
According to the presented data, it can be observed that from the deviations, the models by BH and VSY show high values of average absolute percent deviations.
This represents a large amount of error estimating the density using the two models.
The maximum deviation calculated from each ionic liquid is obtained from the Bhirud’s model with the value of 4129.8% which is resulted from triethyldodecylammonium bis[(trifluoromethyl)sulfonyl]imide, [N222(12)][bti].
The data obviously shows that Bhirud’s is not applicable for the estimation of certain ammonium-based ionic liquid. However, it would not be fair to conclude that Bhirud is not a good model, as for 1-ethyl-3-methylidimazolium thiocyanate, the deviation obtained from Bhirud’s results in only 0.48% which is the lowest deviation compared to other correlations for that ionic liquid.
There are quite a number of acceptable minimum deviations that is successfully obtained from this study. Yamada and Gunn’s, Reid’s, Hankinson and Thomson’s, Mchaweh’s and Valderrama and Zarricueta’s models, all yield a deviation of less than 0.1% and even 0% error for certain ionic liquids. For example, Reid’s had resulted in 0% of deviation for 4-methyl-n-butylpyridinium tetrafluoroborate and Valderrama and Zarricueta’s had yield a 0% deviation for 1,3- dimethylidimazolium methoxyethyl sulfate. Other data can be referred to Table 4.2, Table 4.3 and Table 4.4.
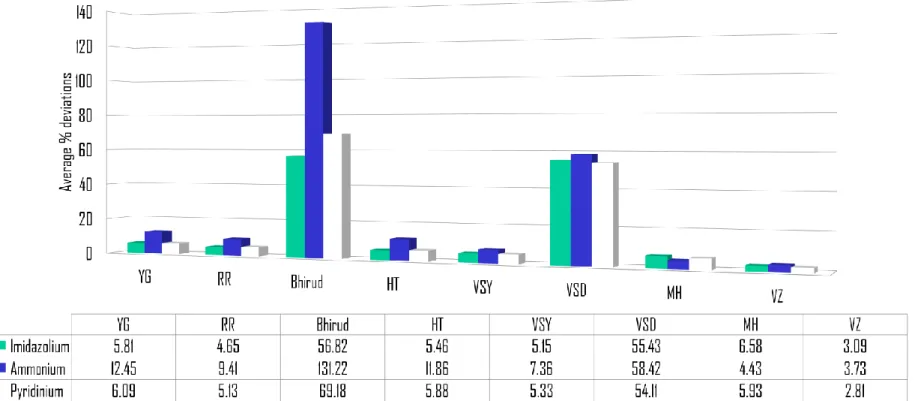
The following Figure 4.1 shows the comparison of the average deviations calculated from different correlations. From the figure, the difference in the percentage can be simply explained illustratively.
22
Figure 4.1: Comparison of Deviations for Calculated Density of Ionic Liquids
23
From Figure 4.1, it is shown that the lowest average percent deviation is
presented by Valderrama and Zarricueta with the average percentage of 3.23%, and
the highest would be Bhirud’s which shows a very high average deviation in
estimating the ammonium-based ionic liquids – 77.48%, followed by Valderrama
and Abu Sharkh’s (VSD) with the second highest total average of 56.10%. Other
correlations result in less than 10% of average absolute percent deviation which is
7.58% for Yamada and Gunn’s, 7.18% by Hankinson and Thomson’s, 5.96% for
Mchaweh’s, 5.94% by Reid’s, 5.75% by Valderrama and Abu Sharkh’s (VSY).
24
CHAPTER 5
CONCLUSION AND RECOMMENDATION
5.1 Conclusion
Through this study, it is found that the model that gives out the lowest average percent deviation is Valderrama and Zarricueta. The model that gives the highest average percent deviation is Bhirud and Valderrama and Abu Sharkh (VSD).
However, from the presented data, Bhirud’s and VSD’s do not shows a constant high deviation, which in fact, Bhirud’s do successfully yield the lowest percentage of deviations compared to other correlations for certain ionic liquids, where in this case, 1-ethyl-3-methylidimazolium thiocyanate with the deviation of 0.48%.
Therefore, through this study, it can be concluded that the correlations presented is the best correlation for certain ionic liquids, even if not for all.
In this work, it is observed that the deviations yielded from Valderrama and Zarricueta’s are mostly below 20%. Therefore, in overall, it is conclude that the most appropriate correlation for estimating the density of ionic liquids would be the model developed by Valderrama and Zarricueta, wherein it can be confidently used for any ionic liquids.
This study had successfully determined the accuracy of the selected
correlations for estimating the density of 214 ionic liquids. From the study, the
objective of the project work is finally achieved.
25
5.2 Recommendation
For both the project and institutional aspects, there are 2 things where I would like to voice out my opinions:
The student should be exposed to various sources and wide access to the educational search engine (e.g ScienceDirect). This is because; there are too many useful documents that have limited access, which cause the student not to be able to get useful information for the project works.
The time constraints due to the tri-semester system had gives a very limited
duration for both students and lecturers. Wider view of the project studied
can be explored by the students if the time given is longer, herein referred to
the previous two-semester system.
26
REFERENCES
1. Valderrama, J.O. and Zarricueta, K., 2009, “A simple and generalized model for predicting the density of ionic liquids,” Fluid Phase Equilibria 275: 145-151 2. Lazzus, J.A., 2009, “ -T-P prediction for ionic liquids using neural networks,”
Journal of the Taiwan Institute of Chemical Engineers 40: 213-232
3. Gardash, R.L. and Coutinho, J.A.P., 2008, “Extension of the Ye and Shreeve group contribution method for density estimation of ionic liquids in a wide range of temperatures and pressures,” Fluid Phase Equilibira 263: 26-32
4. Abildskov, J., Ellegard, M.D. and O’Connel, J.P., 2010, “Densities and isothermal compressibilities of ionic liquids – Modelling and application,” Fluid Phase Equilibria 295: 215-229
5. Valderrama, J.O., Sanga, W.W. and Lazzus, J.A., 2008, “Critical properties, normal boiling temperature, and accentric factor of another 200 ionic liquids,” Industrial &
Engineering Chemistry Research 47:1318-1330
6. Valderrama, J.O. and Robles, P.A., 2007, “Critical properties, normal boiling temperature, and accentric factor of fifty ionic liquids,” Industrial & Engineering Chemistry Research 46:1338-1344
7. Mulero, A., Cachadina, I. and Parra, M.I., 2006, “Liquid saturation density from predictive correlations based on the corresponding states principle. Part 1: Results for 30 families of fluids,” Industrial & Engineering Chemistry Research 45: 1840- 1848
8. Abildskov, J., Ellegard, M.D. and O’Connel, J.P., 2009, “Correlation of phase equilibria and liquid densities for gases with ionic liquids,” Fluid Phase Equilibria 286: 95-106
9. Singh, M.P. and Singh, R.K., 2011, “Correlation between ultrasonic velocity, surface tension, density and viscosity of ionic liquids,” Fluid Phase Equilibria 304:
1-6
10. Shen, C. et al., 2011, “Estimation of densities of ionic liquids using Patel-Teja equation of state and critical properties determined from group contribution method,” Chemical Engineering Science 66: 2690-2698
11. Valderrama, J.O. and Rojas, R.E., 2010, “Mass connectivity index, a new molecular parameter for the estimation of ionic liquid properties,” Fluid Phase Equilibria 297:
107-112
27
APPENDIX
28
APPENDIX 1 - Density data of imidazolium-based ionic liquids
IUPAC
Abbreviat
ion M Tb (K) Tc (K)
Pc (bar)
Vc (cm3/
mol) ω T (K)
(g/cm3) 1-methylidimazolium chloride [mim][Cl] 119 461.1 687.7 48.2 316.1 0.4564 353.15 1.1832 1-ethyl-3-methylimidazolium(2,2,2-
trifluoro-n-(trifluoromethyl sulfonyl))acetamide
[emim][ts
ac] 355 764.4 1069.9 25.2 833.5 0.4977 298.15 1.4600
1-butyl-3-methylimidazolium 1,1,2,2- tetrafluoroethane sulfonate
[bmim][TF
ES] 320 729.4 1030.5 25.7 827.8 0.4583 301.45 1.3240
1-dodecyl-3-methylimidazolium 1,1,2,2-tetrafluoroethane sulfonate
[dmim][TF
ES] 433 912.5 1171.0 15.6 1284.7 0.8065 301.35 1.1360 1-ethyl-3-methylimidazolium 1,1,2,2-
tetrafluoroethane sulfonate
[emim][TF
ES] 292 683.7 998.2 30.4 713.6 0.3743 301.45 1.5020
1-heptyl-3-methylimidazolium 1,1,2,2-tetrafluoroethane sulfonate
[hpmim][
TFES] 362 798.1 1080.8 20.7 999.2 0.5903 301.15 1.2740 1-butyl-3-methylimidazolium
1,1,2,3,3,3-hexafluoropropane sulfonate
[bmim][H
FPS] 370 747.6 1032.1 21.3 912.6 0.4933 298.15 1.4090 1-butyl-3-methylimidazolium 1,1,2-
trifluoro-2-(perfluoroethoxy)ethane sulfonate
[bmim][T
PES] 436 788.2 1061.3 17.9 1012.9 0.5488 298.15 1.4230 1-butyl-3-methylimidazolium 1,1,2-
trifluoro-2-(trifluoromethoxy)ethane sulfonate
[bmim][TT
ES] 386 770.0 1058.3 20.9 928.2 0.5085 298.15 1.3930
1-butyl-3-methylimidazolium 2- (1,2,2,2-tetrafluoroethoxy)-1,1,2,2- tetrafluoroethane sulfonate
[bmim][FS
] 436 788.2 1061.3 17.9 1012.9 0.5488 298.15 1.4490
1-butyl-3-methylimidazolium acetate
[bmim][Ac
] 198 624.6 847.3 24.5 658.2 0.6681 298.15 1.0550
1-ethyl-3-methylimidazolium acetate
[emim][Ac
] 170 578.8 807.1 29.2 544.0 0.5889 298.15 1.0270
1-ethyl-3-methylimidazolium bis(pentafluoroethylsulfonyl)imide
[emim][B
EI] 491 853.1 1231.4 21.9 1045.4 0.2895 298.15 1.5900 1-butyl-3-methylimidazolium
bis(pentafluoroethylsulfonyl)imide
[bmim][B
EI] 505 841.3 1175.4 19.3 1117.4 0.3837 298.10 1.5140 1,2-dimethyl-3-propylimidazolium
bis[(trifluoromethyl)sulfonyl]imide
[dmprim][
bti] 419 867.4 1269.7 27.5 988.6 0.3226 295.15 1.4567 1,2-dimethyl-3-propylimidazolium
bis[(trifluoromethyl)sulfonyl]imide
[dmprim][
bti] 419 867.4 1269.7 27.5 988.6 0.3226 299.15 1.4810 1,3-dibutylimidazolium
bis[(trifluoromethyl)sulfonyl]imide
[dbim][bti
] 461 931.1 1305.0 22.3 1161.5 0.4349 298.15 1.4910
1,3-diethyl-4-methylimidazolium bis[(trifluoromethyl)sulfonyl]imide
[E1,3M4I]
[bti] 419 867.4 1269.7 27.5 988.6 0.3226 295.15 1.4320 1,3-dimethylimidazolium
bis[(trifluoromethyl)sulfonyl]imide
[dmim][bt
i] 377 783.2 1235.7 35.8 835.8 0.1418 295.15 1.5590
1-decyl-3-methylimidazolium bis[(trifluoromethyl)sulfonyl]imide
[decmim][
bti] 504 999.7 1345.1 18.7 1332.8 0.5741 298.15 1.2710 1-heptyl-3-methylimidazolium
bis[(trifluoromethyl)sulfonyl]imide
[hpmim][
bti] 461 931.1 1305.0 22.3 1161.5 0.4349 298.15 1.3440 1-nonyl-3-methylimidazolium
bis[(trifluoromethyl)sulfonyl]imide
[nmim][bt
i] 490 976.8 1331.2 19.8 1275.7 0.5276 298.15 1.2990
1-pentyl-3-methylimidazolium bis[(trifluoromethyl)sulfonyl]imide
[pmim][bt
i] 433 885.3 1281.1 25.6 1047.2 0.3442 298.15 1.4030
1-propyl-3-methylimidazolium bis[(trifluoromethyl)sulfonyl]imide
[prmim][b
ti] 405 839.6 1259.3 29.9 933.0 0.2573 298.15 1.4750
1,2-dimethyl-3-ethylimidazolium bis[(trifluoromethyl)sulfonyl]imide
[dmeim][
bti] 392 817.8 1235.8 31.6 888.9 0.2492 293.15 1.5100 1,2-dimethyl-3-ethylimidazolium
bis[(trifluoromethyl)sulfonyl]imide
[dmeim][
bti] 405 833.9 1254.1 29.7 948.4 0.2447 298.15 1.4802 ethoxymethyl-3-methylimidazolium
bis[(trifluoromethyl)sulfonyl]imide
[eomim][
bti] 421 862.0 1285.2 29.0 948.6 0.2694 298.15 1.4960 1-(1-phenylalkyl)-3-
methylimidazolium
bis[(trifluoromethyl)sulfonyl]imide
[Ph(CH2)
mim][bti] 453 948.1 1429.7 28.1 1039.5 0.2139 298.15 1.4910
29
1-(2-phenylalkyl)-3-methylimidazolium
bis[(trifluoromethyl)sulfonyl]imide
[Ph(CH2)2
mim][bti] 467 971.0 1436.9 26.1 1096.6 0.2573 298.15 1.4700 1-(3-phenylalkyl)-3-
methylimidazolium
bis[(trifluoromethyl)sulfonyl]imide
[Ph(CH2)3
mim][bti] 481 993.8 1444.9 24.3 1153.7 0.3018 298.15 1.4550 1-butyl-2,3-dimethylimidazolium
bis[(trifluoromethyl)sulfonyl]imide
[bdmim][
bti] 433 890.3 1281.1 25.5 1045.7 0.3669 298.15 1.4200 1-dodecyl-3-methylimidazolium
bis[(trifluoromethyl)sulfonyl]imide
[C12mim]
[bti] 532 1045.5 1374.6 16.8 1447.0 0.6662 293.15 1.2460 1-methyl-3-ethyl-4-
methylimidazolium
bis[(trifluoromethyl)sulfonyl]imide
[memim][
bti] 392 817.8 1235.8 31.6 888.9 0.2492 293.15 1.4700 1-methyl-3-methylimidazolium
bis[(trifluoromethyl)sulfonyl]imide
[mmim][b
ti] 377 793.8 1239.9 35.8 818.8 0.1752 295.15 1.5590
1-propyl-2,3-methylimidazolium bis[(trifluoromethyl)sulfonyl]imide
[pdmim][
bti] 419 867.4 1269.7 27.5 988.6 0.3226 295.15 1.4567 1-trifluoroethyl-3-methylimidazolium
bis[(trifluoromethyl)sulfonyl]imide
[C2F3mim
][bti] 431 788.8 1202.7 29.2 871.5 0.1879 293.15 1.6600 1-butyl-3-methylidimazolium bromide
[bmim][Br
] 219 586.8 834.9 29.8 583.3 0.4891 298.40 1.2990
1-[2-(2-methoxyethoxy)ethyl]-3- methylidimazolium chloride
[moeemi
m][Cl] 221 625.8 863.6 24.8 657.1 0.5707 298.15 1.1400 1-butyl-3-methylidimazolium chloride
[bmim][Cl
] 175 558.0 789.0 27.8 568.8 0.4908 298.15 1.0800
1-hexyl-3-methylidimazolium chloride
[hmim][Cl
] 203 603.8 829.2 23.5 683.0 0.5725 298.15 1.0300
1-octyl-3-methylidimazolium chloride
[omim][Cl
] 231 649.6 869.4 20.3 797.2 0.6566 298.10 1.0000
1-benzyl-3-methylidimazolium chloride
[Bemim][
Cl] 209 653.4 921.3 28.4 631.8 0.5145 298.15 1.1930
1-dodecyl-3-methylidimazolium chloride
[C12mim]
[Cl] 287 741.1 951.5 16.0 1025.6 0.8212 298.15 0.8806 1-ethyl-3-methylidimazolium chloride
[emim][Cl
] 147 512.3 748.6 34.2 454.5 0.4165 294.65 1.1860
1-methyl-3-methylidimazolium chloride
[mmim][C
l] 133 489.4 728.2 38.5 397.4 0.3825 298.15 1.1399
1-p-chlorobenzyl-3- methylidimazolium chloride
[ClBenmi
m][Cl] 243 695.8 969.6 26.8 682.6 0.5521 298.15 1.2670 1-p-fluorobenzyl-3-
methylidimazolium chloride
[FBenMim
][Cl] 227 657.6 913.1 26.4 652.0 0.5660 298.15 1.2830 1,3-dibutylimidazolium chloride [dbim][Cl] 217 626.7 849.2 21.8 740.1 0.6144 298.15 1.0082 1-butyl-3-methylidimazolium
dicyanamide
[bmim][dc
a] 205 783.0 1035.8 24.4 712.0 0.8419 297.15 1.0580
1-ethyl-3-methylidimazolium dicyanamide
[emim][dc
a] 177 737.2 999.0 29.1 597.8 0.7661 298.15 1.0600
1-octyl-3-methylidimazolium dicyanamide
[omim][dc
a] 261 863.9 1103.9 18.4 957.4 0.9543 298.15 1.0000
1-ethyl-3-methylidimazolium dicyanoamides
[emim][dc
a] 177 737.2 999.0 29.1 597.8 0.7661 298.15 1.0600
1-ethyl-3-methylidimazolium diethyleneglycol
monomethylethersulfate
[emim][D EGlyMSO
4] 310 826.2 1162.9 28.1 862.3 0.5176 298.15 1.2365
1,3-dimethylidimazolium dimethyl phosphate
[dmim][D
MPO4] 222 623.0 880.4 28.6 598.4 0.5065 303.15 1.2530 1-ethyl-2,3-dimethylidimazolium
ethyl sulfate
[edmim][E
SO4] 250 740.5 1082.6 35.8 715.3 0.4341 353.15 1.1970 1-ethyl-3-methylidimazolium ethyl
sulfate
[emim][ES
O4] 236 712.7 1067.5 40.5 659.8 0.3744 298.15 1.2388
1-octyl-3-methylidimazolium hexafluorophosphate
[moim][PF
6] 340 635.5 800.1 14.0 1007.9 0.9069 298.15 1.2360
1-[2-(2-methoxyethoxy)ethyl]-3- methylidimazolium
hexafluorophosphate
[moeemi
m][PF6] 330 622.3 795.3 16.1 850.8 0.8676 298.15 1.3200 1-butyl-2,3-dimethylidimazolium
hexafluorophosphate
[bdmim][
PF6] 298 582.4 746.3 16.2 818.0 0.8526 295.65 1.2416
30
1-heptyl-3-methylidimazoliumhexafluorophosphate
[hpmim][
PF6] 326 623.2 787.8 14.7 933.8 0.9055 298.15 1.2620
1-nonyl-3-methylidimazolium hexafluorophosphate
[nmim][PF
6] 354 669.0 834.1 13.4 1048.1 0.9680 298.15 1.2120
1-octyl-3-propylimidazolium hexafluorophosphate
[oprim][P
F6] 368 691.9 857.6 12.8 1105.2 0.9937 298.15 1.1182
1-pentyl-3-methylidimazolium hexafluorophosphate
[pmim][PF
6] 298 577.5 742.1 16.3 819.6 0.8316 294.10 1.3330
ethoxymethyl-3-methylidimazolium hexafluorophosphate
[eommim]
[PF6] 286 554.1 723.7 18.2 721.0 0.7692 298.15 1.4000 methyloxymethyl-3-
methylidimazolium hexafluorophosphate
[mommim
][PF6] 272 531.2 701.2 19.3 663.9 0.7274 298.15 1.4800 1-(3-phenylalkyl)-3-
methylidimazolium hexafluorophosphate
[Ph(CH2)3
mim][PF6] 346 686.0 883.8 16.3 926.1 0.8053 298.15 1.4070 1-propyl-3-methylidimazolium
hexafluorophosphate
[prmim][P
F6] 270 531.7 696.7 18.3 705.4 0.7504 293.00 1.3330
1-hexyl-3-ethylimidazolium hexafluorophosphate
[C2C6I][PF
6] 326 623.2 787.8 14.7 933.8 0.9055 298.15 1.2622
1-octyl-3-ethylimidazolium hexafluorophosphate
[C2C8I][PF
6] 354 669.0 834.1 13.4 1048.1 0.9680 298.15 1.2118
1-butyl-3-methylidimazolium hydrogen sulfate
[bmim][H
SO4] 235 782.4 1103.8 43.2 664.9 0.7017 298.15 1.2770 1-ethyl-3-methylidimazolium
hydrogen sulfate
[emim][H
SO4] 207 736.7 1073.8 57.4 550.7 0.6394 298.15 1.3673 1-methylidimazolium hydrogen
sulfate
[mim][HS
O4] 179 685.5 1019.6 91.7 412.2 0.7158 298.15 1.4835
1-butyl-3-methylidimazolium iodide [bmim][I] 266 613.7 871.2 28.6 607.5 0.4831 298.15 1.4400 1-butyl-3-methylidimazolium
methane sulfonate
[bmim][m
esy] 234 713.1 1054.8 37.4 701.3 0.3990 373.15 1.1284 1-ethyl-3-methylidimazolium
methane sulfonate
[emim][m
esy] 206 667.4 1026.0 48.1 587.1 0.3307 298.15 1.2437 1,3-dimethylidimazolium
methoxyethyl sulfate
[dmim][M
OESO4] 252 735.1 1094.4 38.9 675.4 0.3854 298.15 1.3140 1,3-dimethylidimazolium methyl
sulfate
[dmim][M
SO4] 208 666.9 1040.0 52.9 545.6 0.3086 298.15 1.3280 1-butyl-3-methylidimazolium methyl
sulfate
[bmim][M
SO4] 250 735.6 1081.6 36.1 716.9 0.4111 298.15 1.2124 1-butyl-3-methylidimazolium
nonafluorobutane sulfonate
[bmim][Nf
O] 438 762.3 1028.8 17.3 1004.8 0.5150 295.15 1.4730
1-octyl-3-methylidimazolium nonafluorobutane sulfonate
[omim][Nf
O] 494 843.2 1094.2 14.2 1250.2 0.6591 298.15 1.3300
1-butyl-3-methylidimazolium octyl sulfate
[bmim][C
8S] 349 895.7 1189.8 20.2 1116.7 0.7042 298.15 0.9971 1-[2-(2-methoxyethoxy)ethyl]-3-
methylidimazolium tetrafluoroborate
[moeoemi
m][BF4] 272 562.9 720.2 18.8 743.3 0.9644 298.15 1.2200 1-butyl-2,3-dimethylidimazolium
tetrafluoroborate
[bdmim][
BF4] 240 523.1 671.0 18.9 710.5 0.9476 300.15 1.0935
1-decyl-3-methylidimazolium tetrafluoroborate
[dmim][B
F4] 310 632.5 784.6 14.5 997.7 1.0817 298.15 1.0400
1-propyl-3-methylidimazolium tetrafluoroborate
[prmim][B
F4] 212 472.3 619.7 21.8 597.9 0.8479 298.15 1.2400
ethyloxymethyl-3-methylidimazolium tetrafluoroborate
[moemim]
[BF4] 228 494.8 647.0 21.7 613.5 0.8686 298.15 1.2600 methyloxymethyl-3-
methylidimazolium tetrafluoroborate
[mommim
][BF4] 214 471.9 623.7 23.3 556.4 0.8291 298.15 1.3300 1-butyl-3-methylidimazolium
thiocyanate
[bmim][tc
a] 197 763.1 1047.4 19.4 780.7 0.4781 298.15 1.0696
1-ethyl-3-methylidimazolium thiocyanate
[emim][SC
N] 169 717.3 1013.6 22.3 666.4 0.3931 298.15 1.1140
1-ethyl-3-methylidimazolium trifluoroacetate
[emim][ta
] 224 562.8 775.7 24.2 610.4 0.5664 298.15 1.3900
1-(4-methoxyphenyl)-3-
methylidimazolium trifluoromethane sulfonate
[mpmi][Tf
O] 338 830.4 1184.7 28.0 827.7 0.4481 323.15 1.3200