No part of this publication may be reproduced, stored in a retrieval system or transmitted in any form or by any other means, whether electronic, mechanical, photocopying, recording and/or otherwise, without the prior written permission of the Publisher (MOSTI).
ACKNOWLEDGEMENT
RESEARCH TEAM
MALAYSIAN SCIENCE AND TECHNOLOGY INFORMATION CENTRE (MASTIC)
UNIT PERUNDINGAN UNIVERSITI MALAYA (UPUM)
EXECUTIVE SUMMARY
WHAT IS THIS REPORT ALL ABOUT?
All the four pillars are inextricably linked to capture the dynamics of the country's national innovation system.
MAIN FINDINGS
- BASIC SUPPORTING ENVIRONMENT
- EDUCATION ADVANCEMENT Positive Trends
- SOCIETY & STI Positive Trends
- DIGITAL INFRASTRUCTURE Positive Trends
- PUBLIC AND PRIVATE INVESTMENT
- R&D INVESTMENT & RESEARCH WORKFORCE Positive Trends
- PUBLIC R&D INVESTMENT: MAJOR GRANTS AND PROGRAMMES Positive Trends
- INDUSTRIAL DEVELOPMENT
- MANUFACTURING AND SERVICES SECTORS INNOVATION Positive Trends
- KNOWLEDGE AND TECHNOLOGY INTENSIVE INDUSTRIES (KTI) Positive Trends
- ENERGY AND GREEN TECHNOLOGY Positive Trends
- SCIENTIFIC CAPABILITIES
- BIBLIOMETRICS: PUBLICATIONS AND CITATIONS Positive Trends
- INTELLECTUAL CAPITAL Positive Trends
- COMMERCIALISATION Positive Trends
However, as a share of world value added, Malaysia's contribution is still low given the size of the industry. Malaysia's medium R&D-intensive industry contribution is lower than other ASEAN peers such as Singapore, Thailand and Indonesia. However, Malaysia's high R&D-intensive industries have dominated other ASEAN counterparts (Indonesia, the Philippines, Singapore and Thailand) in achieving a significant trade surplus.
WAY FORWARD
Malaysia's performance is well below that of advanced countries in AI-related PCT patents. The highest revenue generation from government-funded research occurred during the 9th MP, worth RM3,431.98 million. A recent initiative to promote a more focused and collaborative approach to research and technology development is the identification of 30 niche areas by the Academy of Sciences Malaysia under its 10-10 MySTIE Framework, which was adopted by the government to support of the implementation of the NSTIP. 2021-2030.
CONCLUSION
LIST OF TABLES
LIST OF BOX ARTICLES
INTRODUCTION
INTRODUCTION
- Future Challenges, STI and Report Objectives
- Framework and Methodology
- Scope and Limitations
- What’s New in STI 2020 Report
The 2020 report – the 10th edition in this series of reports – presents Malaysia's performance in ICT in a number of areas, including human capital development; public awareness; ICT; Investments in R&D and the research workforce; public sector investments in Research and Development; innovation in the production and service sectors; energy and green technologies; bibliometric; IP rights; Our approach is anchored by the adoption of standard S&T indicators such as the OECD S&T Indicators and Science &. First, where possible, STI indicators are aligned with the SDGs and other current developments to reflect STI positioning for inclusive development.
Innovation
Some of these pillars are critical to support, directly or indirectly, the Shared Prosperity Vision, Inclusive Development and achieving the targets of SDGs.
4 PILLARS
6 KEY TAKEAWAYS & 38 ACTIONS
Snapshot of Past Progress
In most cases, the decline in the number of researchers is due to the R&D project cycle and the reduction in the R&D budget. The number of enrollments and graduates in S&T at undergraduate and postgraduate levels in public universities has remained unchanged over the years. A significant increase in the number of patents filed and granted, with a notable increase in the number of Malaysian applicants.
Summary
Technology • The trade surplus in high-tech products decreased in 2009 and the trade deficit in medium-technology products decreased dramatically in 2009. In 2008, Malaysia ranked 8th among the world's largest exporters of high-tech. Establishment of Apex and research universities helped increase the number of publications and citations for Malaysia.
EDUCATION
ADVANCEMENT
EDUCATION ADVANCEMENT IN MALAYSIA
- Introduction
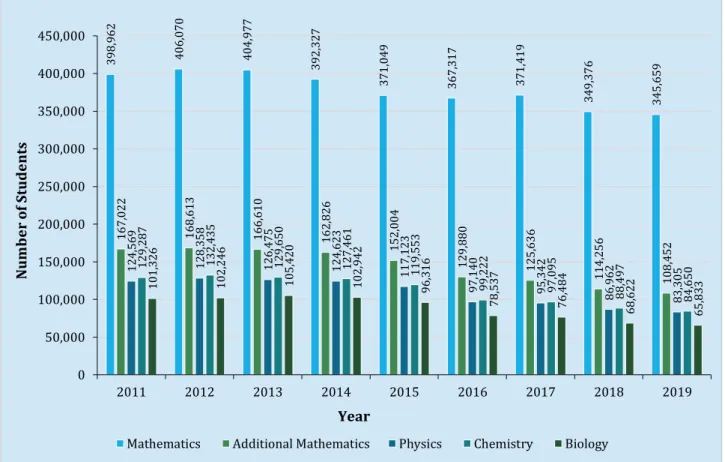
- Science, Mathematics and Technology Education at Secondary and Pre- University Levels
- Science, Mathematics and Technical Subjects at SPM Level
- Science and Mathematics at STPM Level
- Science, Mathematics and Technical Enrolment at Matriculation Level
- Enrolment and Graduations in TVET Diploma Programmes
- Science and Technology at Public HLIs
- First Degree Courses Enrolment and Graduations at Public HLIs
- Enrolment and Graduations in Master’s Degree at Public HLIs
- Enrolment and Graduations in Doctoral Degree Programmes
- Science and Technology Degrees Awarded by Gender at Public HLIs
- Education in Science and Technology at Private HLIs
- Enrolment and Graduations at Private HLIs
- Malaysian Student Performance at International Level
- Performance in Mathematics
- Performance in Science
- Malaysian Students Profiles
- Benchmarking with High Performers in PISA
- Malaysian Student Performance at TIMSS
- Summary
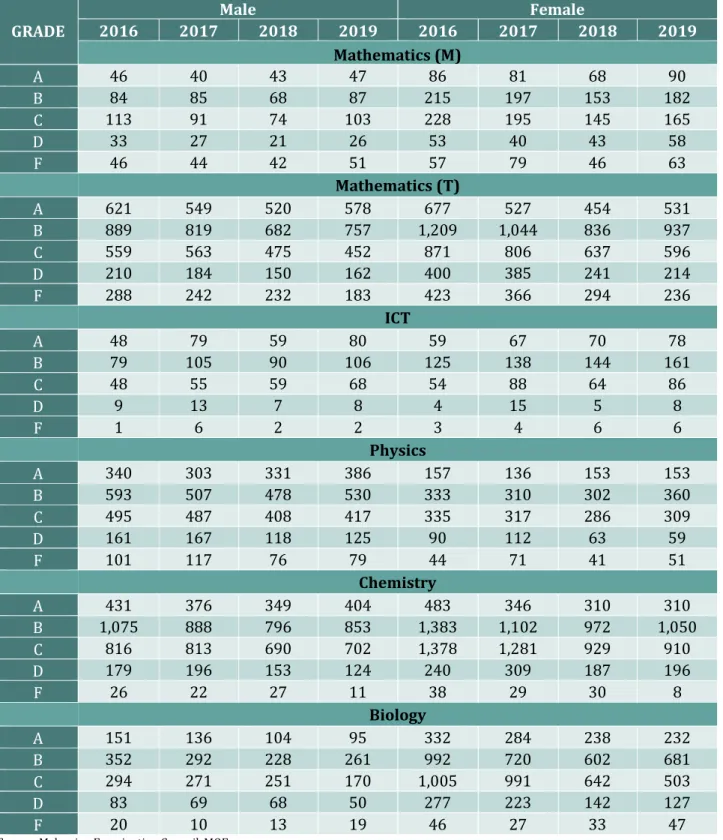
This section discusses the trends in science, mathematics and technology education in terms of student enrollments and grades obtained at the SPM, STPM and Matriculation levels. Pupils' performance in mathematics and science has improved over the time period in Table 2.8). The TVET Diploma programs offered under Malaysia Technical Universities (MTUN) focus on two broad programs (by NEC code): Engineering, Manufacturing & Construction and Science, Mathematics and Computing.
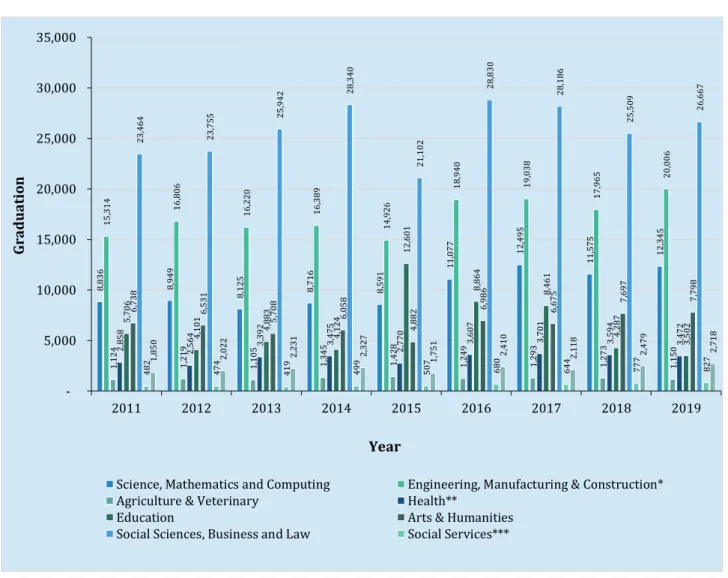
Construction in 2019 compared to 2015, while science, mathematics and computer science saw a 22% increase over the same period. Science, Mathematics and Computing, Engineering, Manufacturing and Construction (by Narrow Field Agriculture & Veterinary Arts & Humanities Social Sciences, Business and Legal Services. At diploma level, it is noted that Engineering, Manufacturing and Construction recorded an enrollment of 55% - 60% of all registrations for the period (table 2.11).
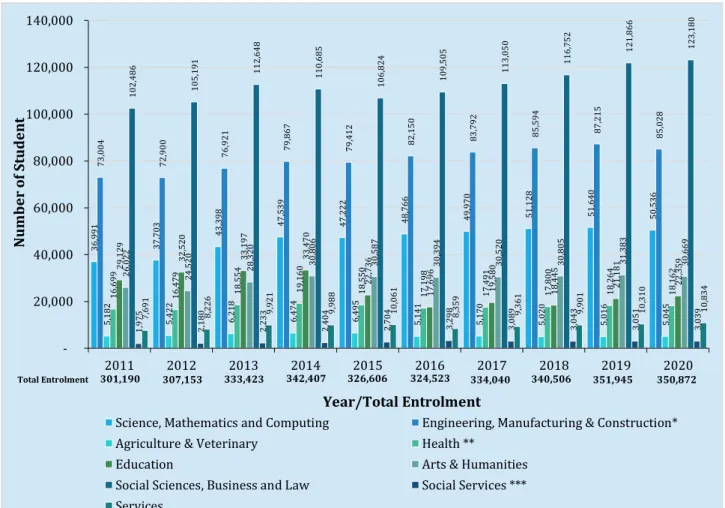
At the Certificate level, Engineering, Manufacturing and Construction recorded an enrollment of 40% - 42% while Science, Mathematics and Computing contributed about 14% of all total enrollments for the year Table 2.12). STEM programs offered by public universities are classified according to NEC codes that include these broad programs: Science, Mathematics and Computer Science, Engineering, Manufacturing and Construction, Agriculture and. Enrollment in Engineering, Manufacturing and Construction represents about 25% of all enrolments, while enrollment in Science, Mathematics and Computer Science saw an increase from 12% to 15% during this period.
Of all science-based enrollments in Comprehensive Universities, 44% are from Engineering, Manufacturing and Construction enrolments, followed by Science, Mathematics and Computing with 38% in 2020.
SOCIETY AND STI
SOCIETY AND STI
- Introduction
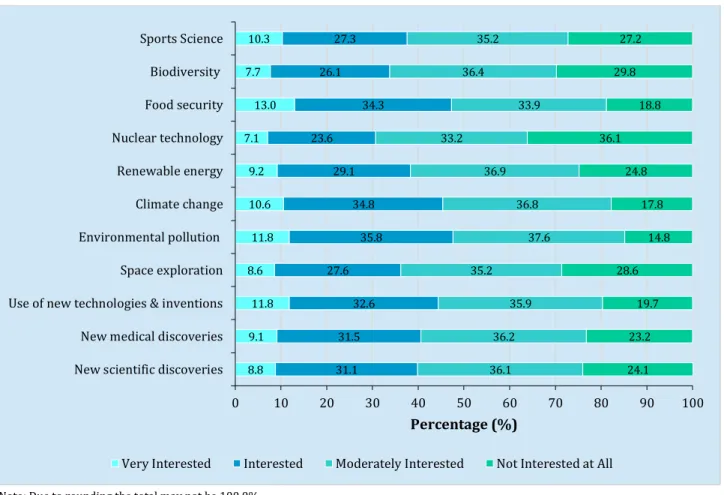
- Public Interest in STI
- Public Perceived Knowledge in Selected STI Issues
- Public Knowledge and Understanding of STI Issues
- Knowledge and Understanding of STI Terms and Concepts
- Understanding of Pseudoscience
- Public Attitudes towards STI
- Public Attitudes towards Scientific Research
- Public Attitudes towards STI, Scientific Research and Science
- Public Attitudes towards the Impact of STI
- Reasons for Low Enrolments in Science
- Interest in Science among Malaysian Adults and School-Going Students
- Should Science Be Taught in English?
- Public Attitudes towards Specific STI-Related Issues
- Environmental Pollution
- Plastic Waste Pollution
- Climate Change
- Renewable Energy
- Information Sources on STI
- Top 5 Most Trusted Sources of STI Information
- Visits by Malaysians to STI-Associated Places
- Public Awareness and Participation of STI Programmes
- Awareness of the Government's STI Policies
- Awareness of STI-Related Government Policies (2014 and 2019)
- Public Opinion on Government’s Spending on STI-Related Matters
- International Comparison
- Public Interest in STI
- Knowledge and Understanding of STI Concepts and Ideas
- Understanding of Astrology as Pseudoscience: International Comparison
- Public Attitudes towards Scientific Research
- Public Attitudes towards Science and Technology in Selected Countries
- Concern for Environmental Pollution
- Climate Change Concerns
- Information Sources on STI
- Public Opinion on Government STI Policy Spending
- Summary
Public knowledge and understanding of STI is assessed based on two aspects: (i) the correct understanding of STI terms and concepts through ten factual questions; and (ii) the ability to distinguish between science and pseudoscience. The 2019 survey shows encouraging trends in the increasing use of the internet as a major source of STD information. The responses are largely consistent with the sources of STD information among Malaysians listed in Table 3.3, with the exception of the third ranked item, which is websites and videos (43.3%) (Figure 3.16).
Between 2014 and 2019, there is a decrease in the level of awareness of STI-related government policies in five out of six policies, namely the National Policy on Science. This section describes the comparison of public interest and knowledge about STI as well as public attitudes towards STI in Malaysia with other countries. However, television is declining as a source of STI information in the US, but represents the leading source of STI information in Malaysia.
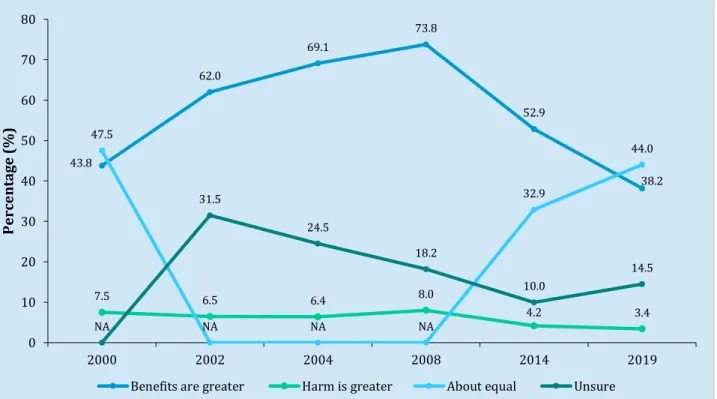
Source: Public Awareness of STI Malaysia 2019; Department of Business, Energy and Industrial Strategy (2020) Public attitudes to science 2019; Key Findings from the Survey of Public Understanding of Science in China, 2018; National Science Board (2020) Science and Technology: Public Attitudes, Knowledge, and Interest 2018. A worrying trend is the decreasing percentage (38.2%) of Malaysians who express that the benefits of STI outweigh its harmful effects. Awareness of STI-related government programs and STI-related policies, respectively, is on the rise.
However, knowledge and understanding of STI concepts and ideas among the public in Malaysia is lower than in these countries.
DIGITAL
INFRASTRUCTURE
DIGITAL INFRASTRUCTURE
- Introduction
- ICT Contribution to the Economy
- ICT Access and Infrastructure
- ICT Funding and Support
- International Comparison
- Summary
As the country embraces the emerging technologies of IR 4.0, it may face more cyber threats over the years. It is noted that the advent of IR 4.0 is seen as the opportunity for ASEAN members to achieve high-income status. By riding the wave of IR 4.0 with capital investments (both locally and abroad), ASEAN could improve their infrastructure and production capabilities.
However, some doubt that such anticipation and enforcement of IR 4.0 can exacerbate the middle-income trap problems faced by ASEAN members. IR 4.0 could then also lead to the cost of automation plummeting and manufacturing activities in ASEAN moving back to the developed world. If IR 4.0 becomes a reality, it is expected by some that global supply value chains will become flat.
Whether IR 4.0 can be the window of opportunity therefore depends on how ready an economy is to adopt the technologies under IR 4.0. Given Malaysia's strong presence in ICT manufacturing as well as the ability to leverage technologies under IR 4.0 through various initiatives, it is expected that Malaysia can use IR 4.0 as the windows of opportunity. There are funds for industrial research and deployment of technologies under IR 4.0 and policy to reduce broadband prices in the market with various efforts to align ICT with economic growth and development.
It is hoped that the pursuit of upgrading via technologies of IR 4.0 will boost Malaysia's competitiveness.

R&D INVESTMENT AND
RESEARCH WORKFORCE
R&D INVESTMENT AND RESEARCH WORKFORCE
- Introduction
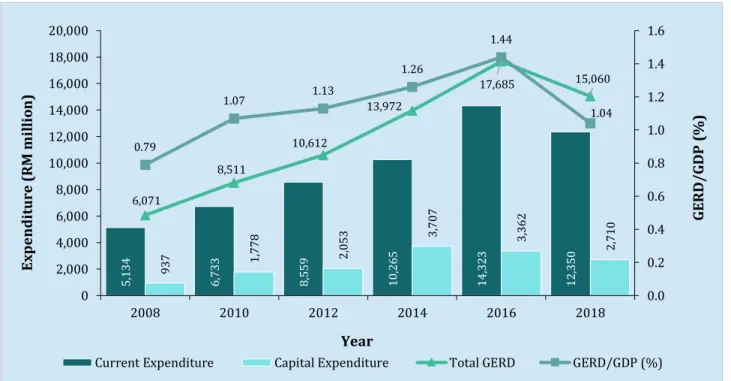
- R&D Investments .1 Expenditure on R&D
- Expenditure by Types of Activity
- GERD by Types of Research and Sector
- Sources of R&D Funds
- BERD: Industrial Classification, Size, Ownership, Research Method
- Research Workforce
- Researchers Headcount by Qualifications, 2006-2011
- Full-Time Equivalent of R&D Personnel
- Researchers by Gender
- Registered Engineers
- Registered Technologists and Technicians
- International Comparison
- Summary
This chapter assesses Malaysia's progress in terms of R&D investment and research workforce. Source: Malaysia National R&D Survey 2019 Note: NGO data is not available before 2016. Regarding SEO, as shown in Figure 5.4, about half of R&D expenditure was related to advanced experimental and applied science (26.7%). and sustainable economic development (25.5%).
In terms of sectoral contribution to the total BERD, Services and Manufacturing contribute 55.2% and 40.1% respectively4 (Figure 5.11). Nevertheless, in terms of R&D expenditure, the major BE contributed the largest share to BERD in Malaysia accounting for 69.1% (RM3,179.8 million) of total spending. The classification of industry size is based on NESDC definition, and derived from survey question A(1) – Main activity of the company and A(3) – Total number of full-time employees in 2018 Source: National Survey of R&D in Malaysia 2019 .
Except in 2014, researchers with PhD qualifications were the largest group of R&D workforce in Malaysia. As shown in Figure 5.17, similar to other indicators, FTE experienced a decline in 2018. In terms of GERD/GDP ratio, Israel and the Republic of Korea were among the leading OECD countries in terms of R&D intensity.
In terms of researcher qualification, researchers with PhD qualification were the largest group of R&D workforce in Malaysia.
PUBLIC R&D
INVESTMENT: MAJOR GRANTS AND
PROGRAMMES
PUBLIC R&D INVESTMENT: MAJOR GRANTS AND PROGRAMMES
- Introduction
- R&D Grants .1 MOSTI
- Ministry of Higher Education (MOHE)
- Ministry of Health (MOH)
- Collaborative Research in Engineering, Science and Technology
- Industry and Commercialisation Funds
- Malaysian Technology Development Corporation
- BioeconomyCorp Fund
- PlaTCOM Ventures
- Malaysia Venture Capital Management Berhad
- Malaysia Debt Ventures Berhad
- Malaysia Social Innovation Fund
- Kumpulan Modal Perdana Sdn. Bhd
- Cradle Fund Sdn. Bhd
- STI Tax Incentives
- MSC Malaysia Status and Research Incentive
- MIDA R&D Investment Incentives
- Issues and Challenges
- Summary
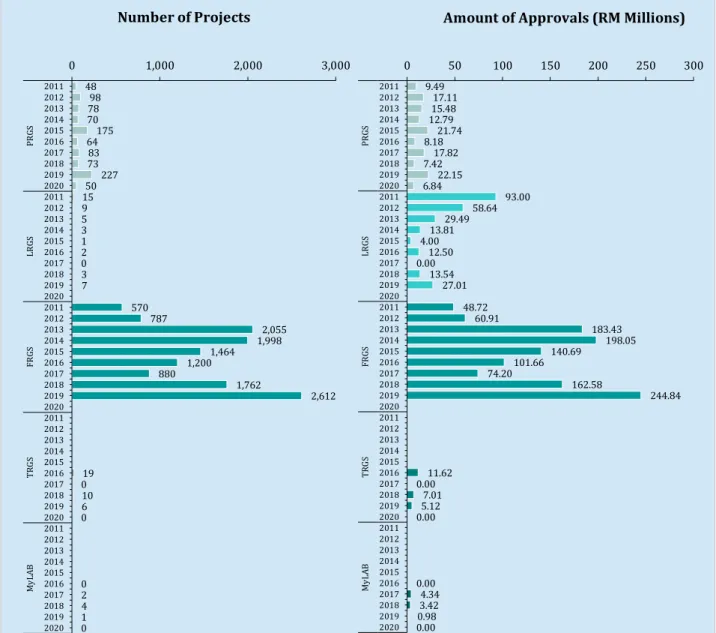
In the 11th MP, Dana R&D has the highest number of approved projects with a total of 77 approvals. The total approvals of MOSTI R&D grants, both in terms of number and number of projects, have seen a sharp decrease in the 11th MP compared to the 10th MP. FRGS is the major MOHE's R&D grant both in terms of expenditure and number of approved projects.
As for the BGF, although the number of approved projects has decreased from 14 projects in MP 10 to 11 projects in MP 11, the fund amount has increased from RM42.50 million to RM63.76 million. On the other hand, the number of projects approved by the Business Expansion Fund was relatively low. Notably, the number of new companies approved has dropped significantly from 91 companies in the 10th MP to only 34 companies in the 11th MP.
The same downward trend is observed in terms of the number of jobs created and knowledge workers employed by BioNexus companies during the same period (Figure 6.7). Data shows that the number of approved projects will be in the range of 3-5 projects during 2015-2019. Meanwhile, there has been a significant decline in terms of number and quantity of R,R&D projects approved in the 11th MP as compared to the 10th MP.
Although the Government is always supportive in encouraging and promoting R,D&C, there has been a significant decline in the quantity and number of projects approved in the 11th MP.