Leung Kar Hang___ (supervisor) from the Department of ____Computer Science___, Faculty of Information and Communication Technology. The optical flow of the important features was calculated and the traces are plotted using random color lines. HSV to RGB Conversion Lookup Table Color Optical Flow of Normal Video Color Optical Flow of Combat Video (1) Color Optical Flow of Combat Video (2) Delaunay Triangulation & Voronoi Diagram of Combat Video.
Kernel Density Estimation Space-Time Interest Points Histogrammer of Oriented Gradients Histogrammer of Optical Flow Artificial Neurale Networks.
Introduction
- Problem Statement and Motivation
- Project Objectives
- Impact, significance, and contribution
- Background information
The contribution of this project is to develop intelligent computer vision algorithms for automatic detection of video anomalies to alleviate the waste of labor and time and improve public safety in our country. Computer vision is one of the most powerful types of artificial intelligence (AI) that practically everyone has encountered without even realizing it in everyday life. Computer vision makes computers understand images in the same way that humans do by mimicking the human visual system.
Image recognition and analysis are computer vision operations that can help computers interpret any digital image.
Literature Reviews
- Non-Deep Learning Approaches
- Motion-aware Feature with Temporal Augmented Network
- MoSIFT Feature and Sparse Coding
- Conventional Methods
- STIP Spatio-temporal Descriptors
- Histogram-of-Oriented-Rectangles (HOR)
- Deep Learning Approaches
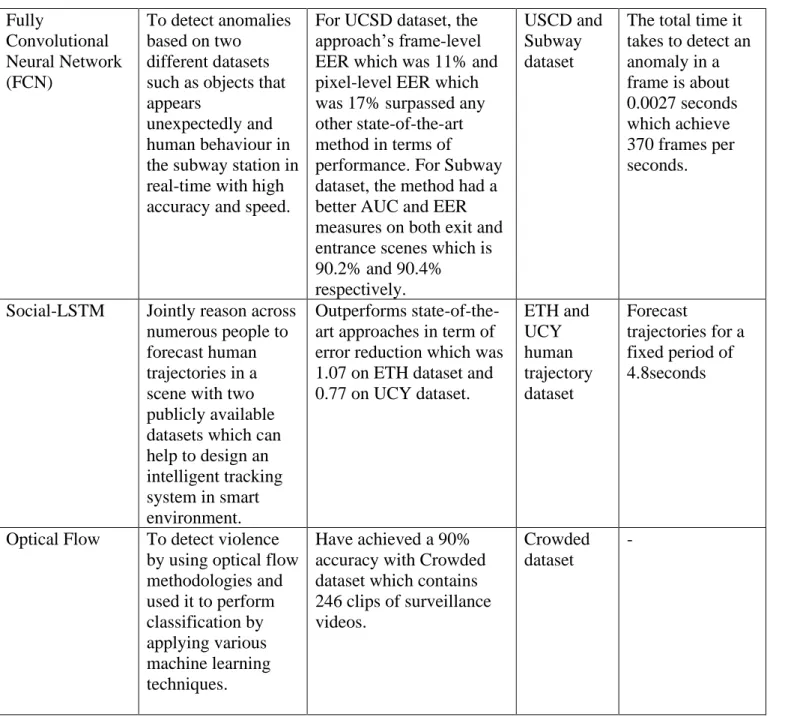
- Fully Convolutional Neural Network (FCN)
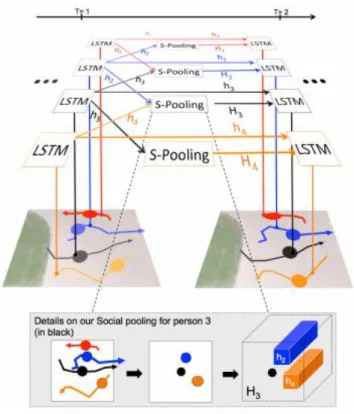
- Social-LSTM
- Survey of Vision-based Methods for Action Recognition
- Overview of Research Methodologies in Deep Learning Based Anomaly Detection
- Survey on Deep Learning Techniques for Video Anomaly Detection
- Optical Flow on Violence Detection
- Critical Remarks of previous works
By combining the MoSIFT technique with a sparse coding framework, they claimed to outperform state-of-the-art solutions on both datasets. 13] evaluated the effectiveness of an action recognition method known as STIP in detecting violence. These significant locations can be located at different spatial and temporal scales. The feature vectors in the range of detected salient points are then extracted using HOG, HOF and a combination of HOG and HOF called HNF.
The relative importance of these factors is determined by the type of accepted acts. The second technique was to use global histogramming to integrate all spatial histograms of series oriented rectangles. They put their strategy to the test on a variety of public data sets and found that in some circumstances, it outperformed state-of-the-art alternatives.
8] examined state-of-the-art deep learning based anomaly detection techniques and categorized them by model type and detection conditions. Chalapathy and Chawla have classified state-of-the-art research techniques into different categories based on the assumptions and methods used. As the size of the data grows, deep learning outperforms conventional machine learning, as shown in Figure 2.3.5.1.
Using ROC curve, EER and AUC, FCN's results are compared with those of state-of-the-art approaches. The proposed methodology has a pixel-level EER of 17 percent, which is 2 percent better than any other state-of-the-art solution in the pixel-level EER metric. As a result, this method achieved 370 frames per second, which is much faster than any of the other modern methods.
For the UCSD dataset, the frame-level EER, which was 11%, and the pixel-level EER, which was 17%, outperformed all other state-of-the-art methods in terms of
![Figure 2.1.1: Overall framework of motion-aware feature [10]](https://thumb-ap.123doks.com/thumbv2/azpdforg/10248356.0/20.892.175.771.465.629/figure-overall-framework-motion-aware-feature.webp)
Proposed Method/Approach
Design Specifications
- Methodologies and General Work Procedure
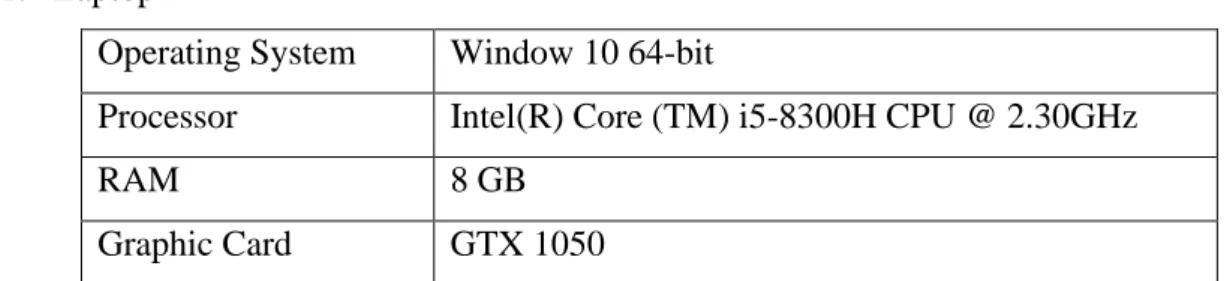
- Tools to use Hardware
- System Performance Definition
- Verification Plan
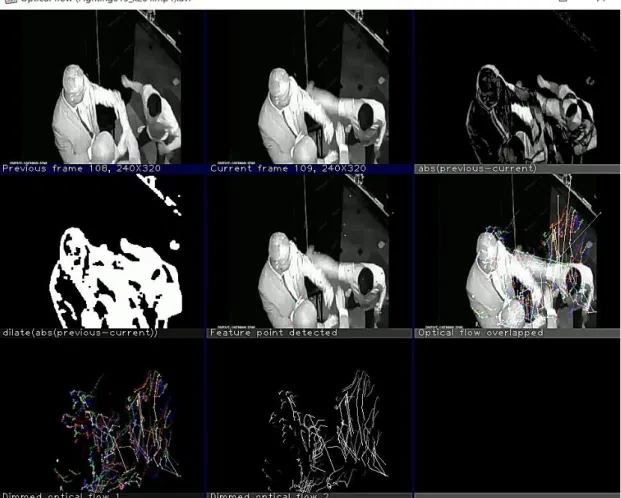
Optical flow was used to identify the pattern of observable motion of image objects between two consecutive frames produced by human motion in the videos of the dataset. Many existing anomaly detection approaches used optical flow, and it was generally best suited for detecting unusually high velocity regions. 16] In this project, the fight scenes should have unusually high speed areas, which is why optical flow was used.
Previous work used sparse optical flow and selected a sparse set of pixel features such as interesting features such as corners to track its motion. After extracting the important features of the input video frames and drawing the motion pattern using optical flow, different types of methods are used for observation purposes to prove that the generated optical flow was meaningful and suitable for the design solution. Then, the relevant optical flow data were acquired and extracted to train the classifier model.
Battle event takes place on a cluttered background with irrelevant objects and people passing by in the battle scene; the system must be able to recognize the combat event accurately. Therefore, several verification steps should be performed to ensure the accuracy and consistency of the system. Purpose/Scope To recognize the category of combat events from a cluttered background, such as the video with irrelevant object and many people walking by.
Acceptance criteria The system classified the combat events accurately and displays timing, accuracy and the category of combat events on the screen. Timing, accuracy and the category of combat events are displayed by the system after performing classification.
System Design/Overview .1 Flowchart
- Descriptions of System Design
The important features between two successive frames of input videos are then extracted using optical flow. Then follows the observation process to prove that the generated optical flow was meaningful and suitable for the project solution. YOLOv3 was used to compare human body size to the generated optical stream to validate that the optical stream generated on the battle scenes was accurate and meaningful.
The second method is to use the orientation of good feature points of optical flow to recolor the optical flow. The aim is to show that the movement of the same direction should generate the same color of optic flow and vice versa. Thus, the optical flow of battle scenes should have many different colors, since battles involved complex movements and many different directions, while the color of optical flow of normal scenes should be the same for the people walking in the same direction.
The next method is to draw the Voronoi diagram and the Delaunay triangle using the characteristic points of the optical flow. In our solution, the good features of the optical flow were represented by individual data points. A frequency histogram of optic flow orientation was also created for combat and normal videos to observe the differences in values between videos.
The orientation value of the optical flow for combat video will normally fluctuate widely, while for normal video it will not fluctuate much. After observation, the optical flow program was run to obtain the standard deviations of the orientation of optical flows on all dataset videos.
Implementation Issues and Challenges
After the model training, classification was done to detect the battle events on the dataset videos. The final step is to perform model evaluation to determine the system performance using confusion matrix, classification report, AUC-ROC curve and also the learning curve of the trained SVM. Last implementation challenge is that some of the combat events occurring in the dataset videos may not be detected by the optical flow.
This was caused by the reasons such as the human involved in the fighting is very far away from the surveillance camera so that their movement cannot be detected and traced. Another reason is that if there are obstacles blocking the view of the combat events, the optical flow may not be able to detect the movement of the combat events. To overcome this challenge, the combat events were categorized into combat videos containing interesting patterns, combat videos containing non-interesting patterns, and normal videos.
The battle videos that contain the above reasons that make the battle events undetectable in the videos are categorized as battle videos that contain non-interesting patterns. Battle videos that contain interesting patterns are the videos that optical flow can accurately detect the battle event, while the normal videos are videos that do not involve the battle event.
Project Implementation
- Dataset
- Implementation Details .1 Pre-Processing
- Optical Flow
- YOLOv3
- Obeservation using Orientation of Optical Flow
- Delaunay Triangulation & Voronoi Diagram
- Generate Frequency Histogram using Orientation of Optical Flow
- Model Training
- System Performance
- Comparison of System Performance
- Error Analysis & Future Work
- Contributions
- Conclusion
- Project Review, Discussions and Conclusions
- Novelties
- Contributions
- Future Work
In the optical flow program, initialization was done to get the suitable previous and current frames of the input videos. Based on the observation of the output video, it is deduced that the optical flow generated on the fight scenes is very significant and it can be used to classify the fight scenes. To support this statement, the optical flow of normal videos in the dataset was generated with the same program.
It was observed that the bounding box generated in Figure 4.4 has the same size compared to the optical flow generated in Figure 4.2.2.1. Then the orientation value for optical flow can be set as Hue value for HSV. Faculty of Information and Communication Technology (Kampar Campus), UTAR Figure 4.2.4.4 Colored optical flow of combat video (2).
To generate the frequency histogram, the orientation of the optical flow was stored and passed to a vector for storage. This shows that the orientation of the generated optical flow was meaningful and can be used to train the classification model. Among the implementation challenges mentioned earlier, one of the challenges is that some battle events that take place in the dataset videos may not be detected by the optical flow.
Future work that can be done is to detect the connected regions of the optic flow. For each region, the histogram of the optical flow strength with reference to the orientation value can be constructed. Some of the combat events occurring in the dataset videos may not be detected by the optical flow is also one of implementation challenges.
The strength of the optical flow can be used to build a histogram for each area with reference to the orientation value.
BIBLIOGRAPHY
POSTER
PLAGIARISM CHECK RESULT
The originality parameters required and the restrictions approved by UTAR are as follows: i) The overall similarity index is 20% and below, and. ii) Match of individual sources listed must be less than 3% each and (iii) Matching texts in continuous block must not exceed 8 words. Note: Parameters (i) – (ii) will exclude quotes, bibliography and text matching that are less than 8 words. Note The Supervisor/Candidate(s) must/are required to provide the Faculty/Institute with a full copy of the complete set of originality report.
Based on the above results, I declare that I am satisfied with the originality of the final year project report submitted by my students as mentioned above. Form Title: Supervisor Comments on Originality Report Generated by Turnitin for Final Year Project Report Submission (for Undergraduate Programs).
UNIVERSITI TUNKU ABDUL RAHMAN FACULTY OF INFORMATION & COMMUNICATION
TECHNOLOGY (KAMPAR CAMPUS)
![Figure 2.1.2: Framework of MoSIFT feature and sparse coding approach [11]](https://thumb-ap.123doks.com/thumbv2/azpdforg/10248356.0/22.892.160.781.192.325/figure-framework-mosift-feature-sparse-coding-approach.webp)
![Figure 2.2.2: Process of Histogram-of-Oriented-Rectangles(HOR) [14]](https://thumb-ap.123doks.com/thumbv2/azpdforg/10248356.0/24.892.181.754.590.720/figure-process-of-histogram-of-oriented-rectangles-hor.webp)
![Figure 2.3.1: Schematic sketch of FCNN detection method [5]](https://thumb-ap.123doks.com/thumbv2/azpdforg/10248356.0/26.892.195.740.738.1018/figure-schematic-sketch-fcnn-detection-method.webp)
![Figure 2.3.3: A general process flow for generic action recognition system [7]](https://thumb-ap.123doks.com/thumbv2/azpdforg/10248356.0/30.892.235.707.339.541/figure-general-process-flow-generic-action-recognition.webp)
![Figure 2.3.5.1: Deep learning-based algorithms Versus traditional algorithms performance comparison [9]](https://thumb-ap.123doks.com/thumbv2/azpdforg/10248356.0/32.892.294.669.234.427/figure-learning-algorithms-versus-traditional-algorithms-performance-comparison.webp)
![Figure 2.3.7: General Process of Violence Detection. [12]](https://thumb-ap.123doks.com/thumbv2/azpdforg/10248356.0/34.892.211.750.357.596/figure-general-process-violence-detection.webp)