10 Figure 2.4 Scraping data from Shopee using BeautifulSoup and request 13 Figure 2.5 The scraped data is embedded in various HTML tags 13 Figure 2.6 Creating a session in Web Data Extractor 15 Figure 2.7 Web scraping performance of Web Data Extractor 15 Figure 2.8 Options provided by Tableau for the import format and the . 22 Table 2.3 Critical Note of D3.js, Tableau and Plotly'sDash 23 Table 3.1 Use Case Description for Using "View About Dashboard".
INTRODUCTION
- Background Information
- Problem Statement
- Motivation
- Project Objectives
- Project Scope and Direction
- Contributions
- Report Organization
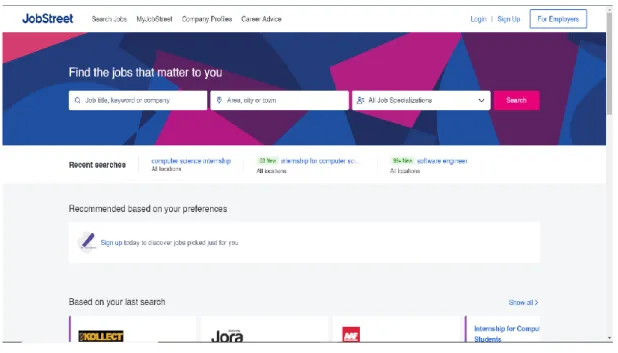
However, this becomes one of the motivations for developing a dashboard to monitor the work in this project. Online recruitment platforms such as JobStreet and Indeed were chosen as data collection sources for this project because they have a large and up-to-date collection of job postings.
LITERATURE REVIEW
- Introduction
- Online Job Recruitment Platform in Malaysia
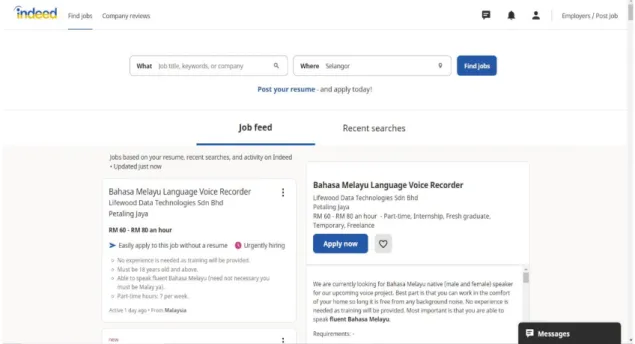
- Indeed.com
- Web Scraping and Data Analysis
- Python Library
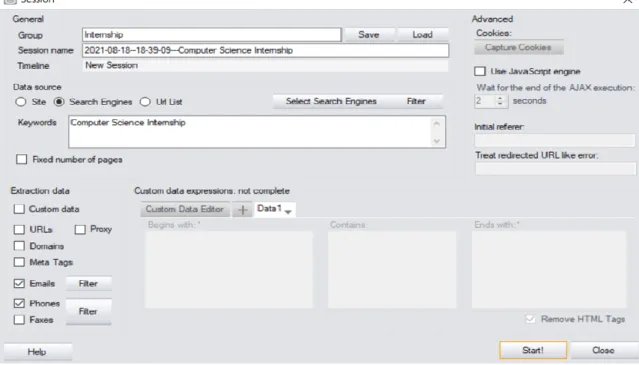
- Web Data Extractor
- Dashboard
- D3.js
- Tableau
- Plotly’s Dash
- Limitation of The Reviewed Tools
- Web Scraping and Data Analysis
- Dashboard
- Critical Remark
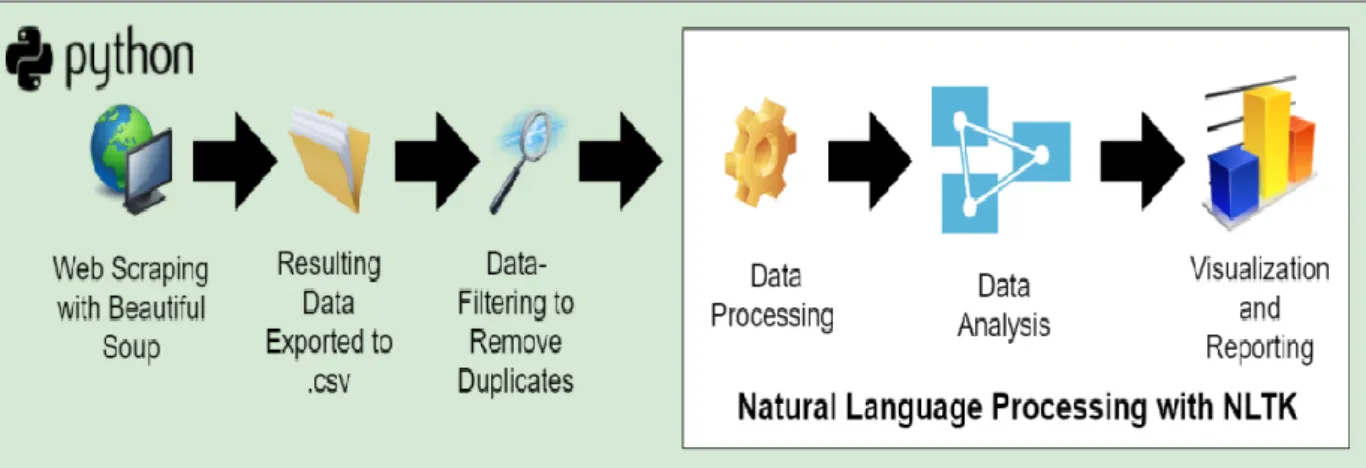
This paper has used Python to web-scrape Indeed.com (an online job platform) to collect data about the computer science industry, including job titles, salaries, qualification requirements and other relevant data [6]. This tool allows the user to change the web scraping settings according to the user's preferences.
SYSTEM DESIGN
- Overview
- System Architecture
- Use Case Diagram
- Use Case Description
- Activity Diagram
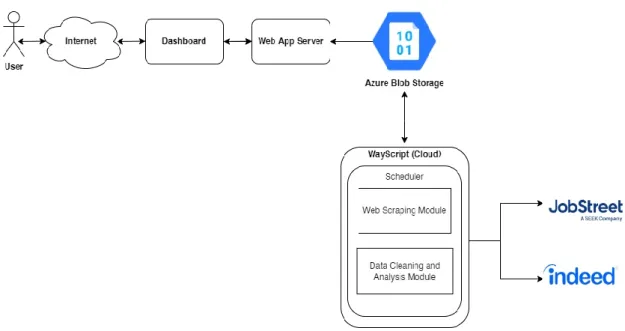
The user's request will be accepted by the web application server's listening port, which will launch the dashboard and return data and the dashboard UI to the user. In addition, the two modules mentioned above are programmed in python and installed on the WayScript platform. The web scraping script will run at 1:00 AM on the 12th and 26th of each month to scrape the requested data from JobStreet and Indeed and store the results in Azure Blob Storage.
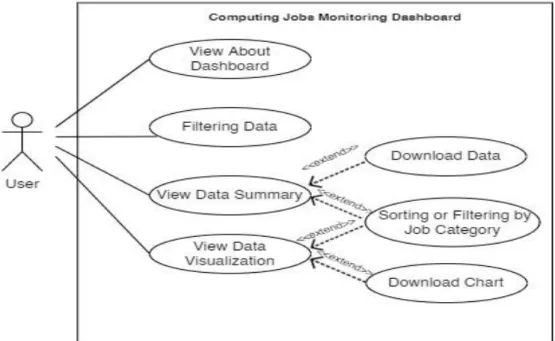
6 The system displays the filtered results in the "Data summary" tab, including the updated data summary and data tables. 4a.4.1 The system returns null values after querying the data based on the job category selected by the user. The interactive dashboard updates the data or content in the chart based on the filter options selected by the user, giving the user a new understanding of the data.
There is also a submit button on the filter interface that allows the user to determine the final selected filter option. Once the user has clicked the submit button, the backend will request the correct data based on the filter options selected by the user.
METHODOLOGY AND TOOLS
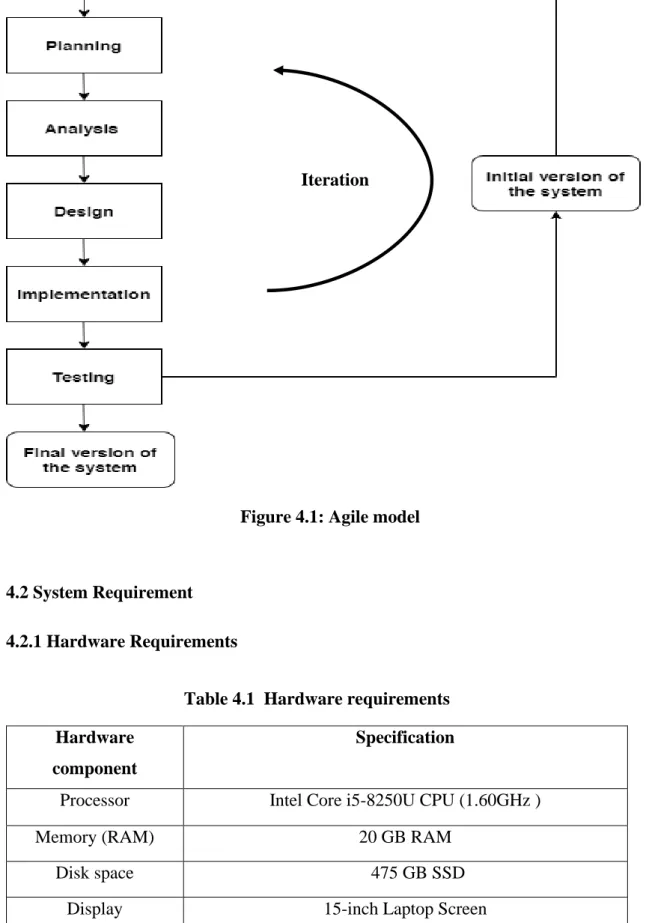
- System Methodology
- System Requirement
- Hardware Requirements
- Software Requirements
- User Requirements
- Non-functional Requirements
- Filtering Data
- Filtering and Sorting Job Postings in Data Table
- Regenerate a New Chart when Further Filtering is Performed
- Implementation Issues and Challenges
- Timeline
The control panel must display a description of the control panel, such as its purpose, services offered, and features. The dashboard can update data and charts based on user-selected filtering options. Acceptance Criteria The system must query the data based on the filtering options selected by the user and display accurate data and charts on the dashboard.
Purpose/Scope To increase the dashboard's interactivity by further filtering and sorting job postings in the data table. Acceptance Criteria The system must filter or sort data based on the filtering or sorting options selected by the user and display accurate job postings in data table. The data table can be filtered by job category and sorted by salary range.
If no query results are returned, the data table will not display any content. An unbalanced classification means that the distribution of data within the classes is biased or skewed.
SYSTEM IMPLEMENTATION
WayScript
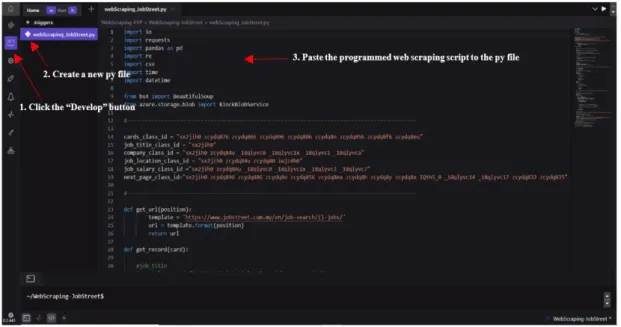
The following steps will be used as a web scraping deployment example, which is the same as the deployment steps for the data cleaning and analysis module. The user has to click the second button named "Develop" in the left sidebar to start developing the project. After that, create a new py file named "py webScraping_JobStreet.py" and paste the programmed web scraping script into it.
Enter the code in Figure 5.5 into the terminal to automatically generate requirements.txt. 52 Clicking the fifth button labeled "Deploy" in the left sidebar will take you to the final deployment page. Finally, click the "Deploy" button as shown in Figure 5.6 to deploy the project to run automatically to the cloud.
Azure Blob Storage
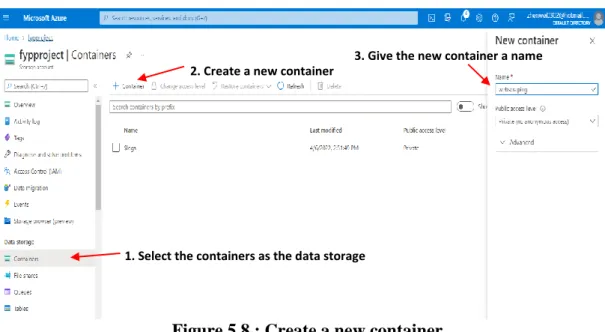
53 Navigate to the storage account created and find the data storage in the right sidebar and select containers. The purpose of the access key is for the data scraping script to access the specified storage account and container to store the latest scraped data. 54 Figure 5.10 shows how the access key of the storage account is placed in the web scraping script.
The 140th line of code assigns parameters about the storage account name and access key to the BlockBlobService built-in function. Then line 142. line of the code is about saving the scraped data in a container named webscraping and the uploaded file name is jobStreet_Computer_Science.csv.
Web Scraping
This project only scrapes the first 100 pages of JobStreet because job posting information after 100 pages is incomplete and out of date. If the program has not yet scraped 100 pages of the job posting, it will begin querying the URL of the next page and assign it back to the request library's get method to scrape the next page of data. However, the webframing process will only be interrupted if the URL of the next page cannot be found in Indeed.
The accumulated data stored in the list is converted to a DataFrame when the program has completed the data scraping process. Since the final format to be saved is csv, the DataFrame is converted to csv format and uploaded to Azure Blob Storage.
Data Cleaning
57 is displayed in "RM" as the currency unit will be removed, which will ensure that the deleted data is in Malaysia. Since JobStreet salary has a lower and upper range, the data cleaning process will split this salary data format into two separate attributes. Also, convert the data type of salary and years of experience from character to float.
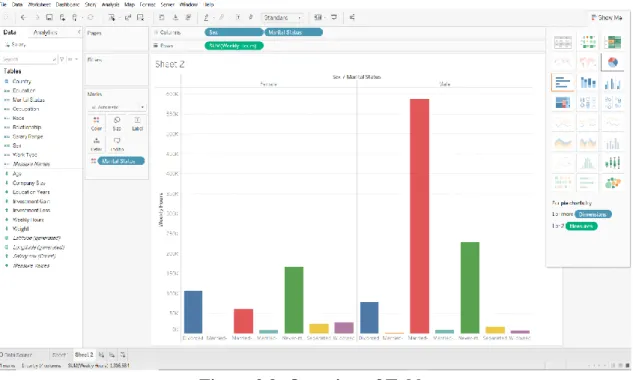
The final data cleaning is according to the job location to classify to another state. The backend has a total of 3891 records about different locations and its state to classify the job location attribute in the scraped data. The purpose of classifying the location to another state is because the state as a filter options in the dashboard.
In addition, the program will sort and group reference information and job information by the first letter of the alphabet. This proposed search method will improve the efficiency of classifying the job location into different states instead of searching sequentially.
Data Analysis
- Multiclass Classification
- Named-Entity Recognition (NER)
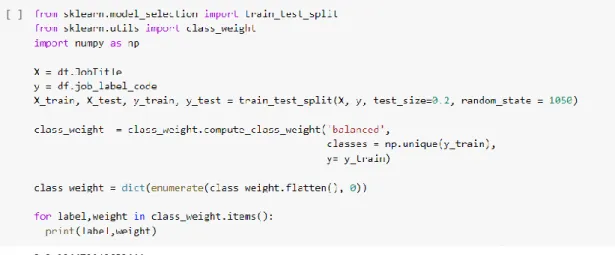
This is because text cleaning is very useful to improve the accuracy of the training model. 61 Grid search will be used for all training models to tune the model accuracy. Furthermore, Figure 5.17 shows that the accuracy of the Logistic Regression is 0.989 after using the hyperparameters returned from the network search, while the accuracy of the original model is only 0.945.
The larger value of C specifies lower regularization, which means that the training model algorithm is more prone to overfit. The evaluation data has a total of 666 different jobs and is completely new data to test the accuracy of the training models to detect whether the training models will be overfitted and underfitted. The 'Title' attribute of the training data has listed several ICT skills, which are well suited for training this NER model.
After data cleaning, a total of 46,508 records were used as the final training data, with 20% of the data used for testing and the rest for training. As shown in Figure 5.20, the loss of the training model is decreasing in each epoch, which is a good sign that the model is learning from the data.
Dashboard
- Overview of Dashboard
- Data Summary in the Dashboard
- Data Visualization in the Dashboard
- Filtering in the Dashboard
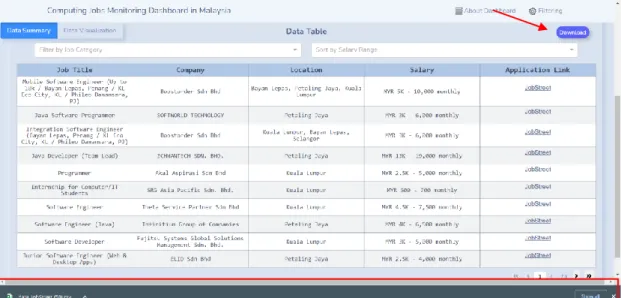
The data summary should allow the user to have a superficial understanding of the data. The data summary includes the number of companies in the market, the number of jobs offered and the date of data scraping. A data table gives the user a more intuitive view of the information they want to know.
The tasks in the data table can be further filtered by 10 different computer task categories. Finally, all the statistics in the data summary and the data in the data table will change according to the filtering options that the user has chosen in the settings. The backend will query for relevant data and update the dashboard data through multiple user-selectable filtering options.
In addition, the system must also ensure that the data in both tabs of the data summary and data visualization must be updated simultaneously. Its main purpose is to filter the data by performing the filter option selected by the user.
CONCLSION
Project Review
Novelties
Future Work
Li, "Revealing the Gap Between Skills of Students and the Evolving Skills Required by the Industry of Information and Communication Technology", in International Journal of Software Engineering and Knowledge Engineering, 2017, pp. Jena, "An Approach for Forecast Prediction in Data Analytics Field by Tableau Software” in International Journal of Information Engineering & Electronic Business, 2019, pp 19-26, doi: 10.5815/ijieeb.2019.01.03. Hossain, "Visualisering van bioinformatika-data met dash bio", in Proceedings of the 18th Python in Science Conference, 2019, pp.
Lenka, "Big data visualization: Tools and challenges", in 2016 2nd International Conference on Contemporary Computing and Informatics (IC3I), Dec. Singh, "Anti-scraping application development" in 2015 International Conference on Advances in Computing, Communications and Informatics (ICACCI), Aug. This is because the first impression and experience is also a key factor in determining the success of the product.
Note Supervisor/candidate(s) are expected to provide a soft copy of the complete set of originality report to Faculty/Institute. Based on the above results, I hereby declare that I am satisfied with the originality of the Final Year Project Report submitted by my student(s) as mentioned above.