Homepage Did you know in Malaysia 158 Exhibit 4.19: Percentage of what are the important factors of using online. The purpose of this research is to determine the factors influencing the adoption of online grocery shopping among Generation X in the Klang Valley.
RESEARCH OVERVIEW…
Introduction
Research Background
- Generation X
- E- Commerce
- Online Grocery Shopping
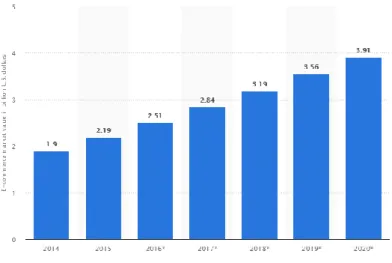
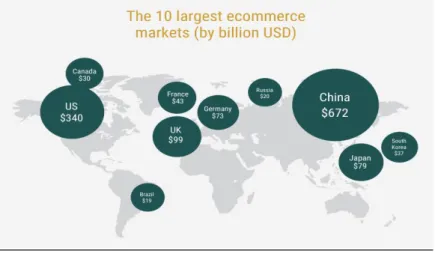
Based on the statistics of figure 1.1, although Malaysia is not in the top 10 e-commerce market, but it shows that Malaysia has had an increase in e-commerce market value from 2014 to 2020 in figure 1.2. Finally, Malaysia is still improving on their online food, but some of the internet users usually do not use online food.
Problem Statement
Research Objective
- General Objective
- Specific Objective
Research Questions
H2: There is a significant positive correlation between perceived ease of use and the introduction of online grocery shopping. Convenience, subjective norms and trust have the most significant relationship with the adoption of online grocery shopping.
Hypothesis of the Study
Significance of the Study
In addition, it also protected under the law in the Personal Data Protection Act 2010 and is included in the Digital Free Trade Zone (DFTZ) and the National E-Commerce Strategic Roadmap (NeSR) to raise Malaysia's Gross Domestic Product (GDP). Also, technology has become more advanced and some of the grocery retailers started to create their own online grocery stores to sell their products online to provide better service to consumers in Malaysia.
Chapter Layout
Conclusion
Introduction
Review of the Literature
- Dependent Variable: Adoption of Online Groceries
- Independent Variable: Convenience
- Independent Variable: Perceived Ease of Use
- Independent Variable: Subjective Norms
- Independent Variable: Trust
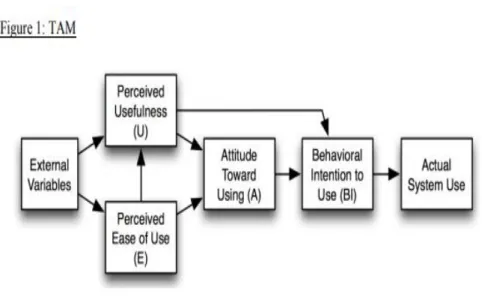
The perceived ease of use with an interpretation that it is part of the technology can be used in an easy way. The perceived ease of use is the important consideration for using the technology under the technology adoption model (TAM) framework.
Review of relevant Theoretical Models
- Independent Variable: Convenience
- Technology Acceptance Model (TAM)
- Independent Variable: Perceived Ease of Use …
- Independent Variable: Subjective Norms …
- Independent Variable: Trust
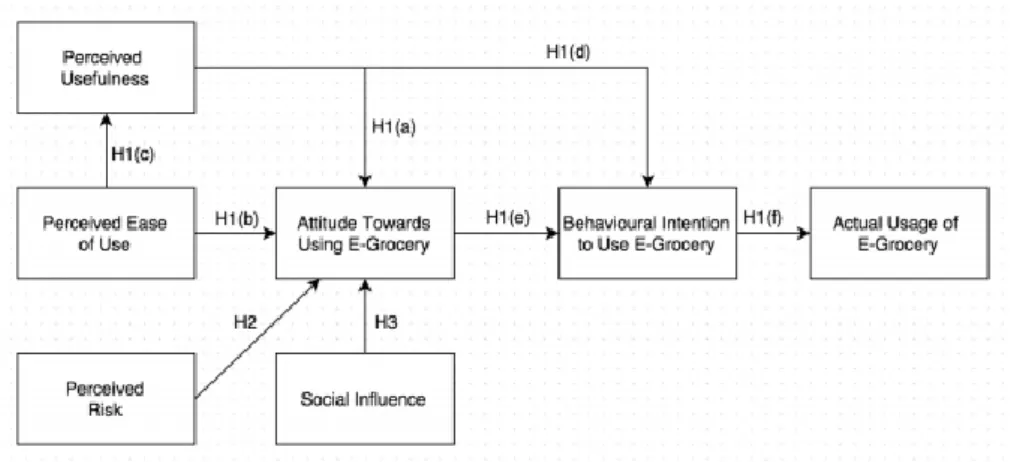
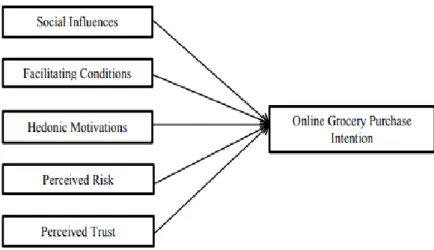
Based on Figure 2.3, the framework shows that the perceived ease of use influences the attitude of consumer regarding the use of the online grocery shopping. Based on the figure 2.4, there is the direct effect of intention on the use of online grocery through subjective norm, attitude utilitarian hedonistic and perceived behavioral control.
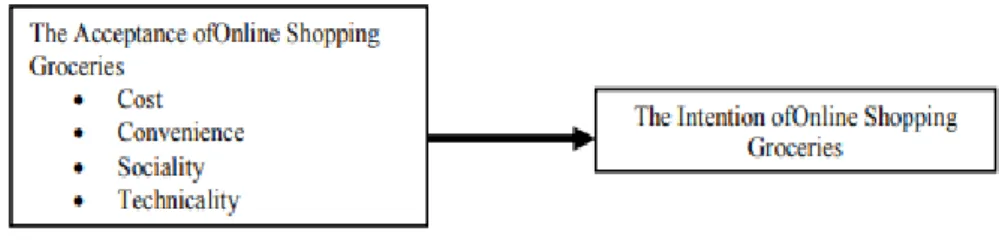
Proposed Theoretical/ Conceptual Framework
Hypothesis Development
- The relationship between Convenience and Adoption of
- The relationship between Perceived ease of use and Adoption
- The relationship between Subjective norms and Adoption of
- The relationship between Trust and Adoption of online
Hasbullah, Osman, Abdullah, Salahuddin, Ramlee and Soha (2016) predicted that subjective norms have a very strong intention of consumers to buy online. However, there is also a relationship between online shopping behavior and intention with online information trust.
Conclusion
RESEARCH METHODOLOGY
Introduction
Research Design
- Quantitative research
- Descriptive Research
This research study conducts the quantitative research and descriptive research to determine which variables influence the adoption of online grocery shopping (Sekaran & Bougie, 2003). This research provides knowledge about the factor influencing generation X towards adoption of online grocery shopping.
Data Collection Methods
- Secondary Data
Primary data will be obtained by distributing the questionnaire through Google Form to generation X. The result of the survey will be automatically collected and stored in the Google form.
Sampling Design
- Target Population
- Sampling Frame and Sampling Location
- Sampling Elements
- Sampling Technique
- Sampling Size
Convenience sampling is a non-probability sampling technique where components have been selected due to the convenient availability and proximity of the target population. Therefore, the researchers allocate the questionnaire to the target population of generation X in Klang Valley by using the convenience sampling (Explorable.com, 2009).
Research Instrument
- Questionnaire Design
- Pilot Test
These questions include whether they use the Internet, whether they know about online grocery shopping, whether they know that a Malaysian store offers online grocery shopping to consumers, which online grocery shopping website they know in Malaysia, and what factors are important to choose online grocery shopping. Parts Variables Independent and Dependent Variables A Dependent Variable Acceptance of Online Grocery Shopping B Independent Variable Convenience.

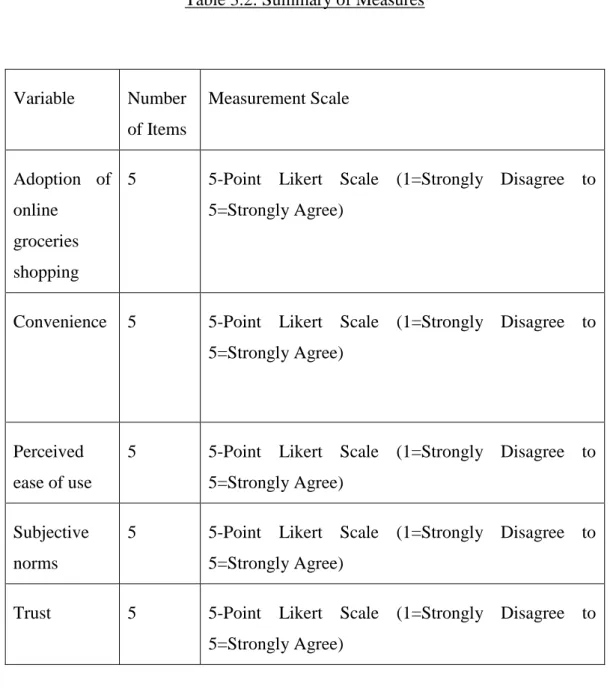
Constructs Measurement (Scale and Operational Definitions)
- Ordinal Scale
- Nominal Scale
- Interval Scale
- Origin of Construct
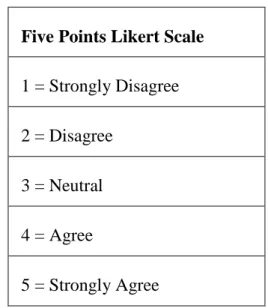
Nominal scale is a measurement of the numerical values only "name" where it is uniquely characteristic and it does not involve ordering the cases, is implied (William M.K. Trochim, 2006a). In other words, it refers to the differences between points on the scale being measurable and exactly equal (Stephanie, 2014)). In Section C of the questionnaire, the researchers use the interval scale known as a five-point Likert scale.
The Likert scale is divided into two types; five-point scale or seven-point scale that will allow the respondent to express how much they agree or disagree with a particular statement given by researchers. The effect of online e-grocery on consumer value in the Iranian market (Doctoral dissertation, Lulea University of Technology).
Data Processing
- Questionnaire Checking
- Data Editing
- Data Coding
- Data Transcribing
- Data Cleaning
The data encoder must ensure that the valuable points of the information are not lost in data encoding (ReadingCraze.com, 2015). Data transcription is an observational data through a repeated confirmation and it was the first step in the data analysis process. It determines that the data must be familiar with what the researchers expected, and it will take a long time to transcribe into final data.
After the researchers have collected all the data encoding in the SPSS software program, the data is transcribed onto a disk. Data cleaning is the final data processing, it mainly includes preventing error data after data transcribing.
Data Analysis
- Statistical Packaging for the Social Science (SPSS) …
- Descriptive Analysis
- Scale Measurement
- Reliability Test
- Inferential Analysis
- Pearson’s Correlation Analysis
- Multiple Regression Analysis
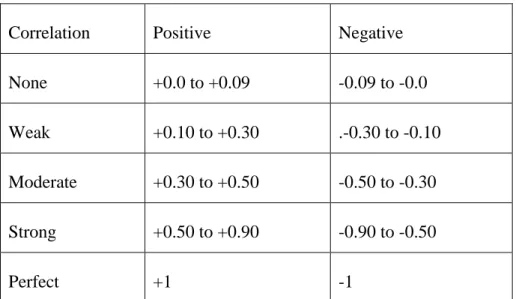
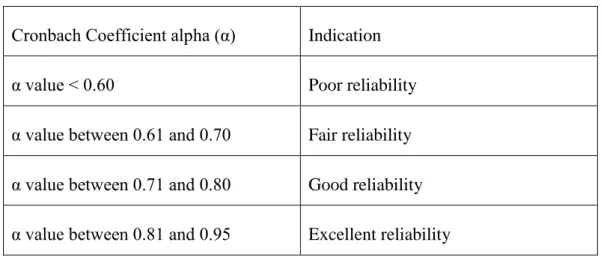
When the results come out with a smaller alpha value, it means there is a weaker relationship between the dependent and independent variable. Pearson's correlation analysis is used to measure the strength of the association between the relationship between dependent variable and independent variables (University of the West of England, 2018). According to Table 3.7, the reader can know that the value for Pearson Correlation Analysis is the different result of the different relationship between dependent variable and independent variables.
The higher the Pearson correlation value, the stronger the relationship between the independent variables and the dependent variables. It is a method that helps researchers to define the relationship between one dependent variable and four independent variables, which are convenience, perceived ease of use, subjective norms, and trust towards the adoption of online grocery shopping in this research (Statistics Solutions, 2018).
Conclusion
DATA ANALYSIS
Introduction
- Respondents Demographic Profile
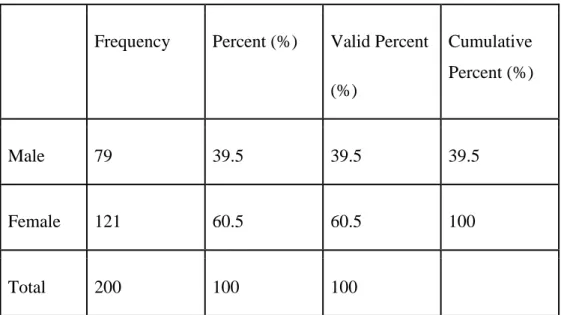
- Gender
- Age
- Ethnicity
- High Education Level
- Monthly Income
- Respondents General Information
- Do You Use Internet
- Do You Know About Online Groceries Shopping…
- Do You Know That Malaysia Store Provides Online
- Which Online Groceries Shopping Website Did
- What Are the Important Factors of Using Online
- Central Tendencies Measurement of Constructs
According to table and figure 4.7, there are a total of respondents who have knowledge of online grocery shopping. While the rest of the respondents do not know about online grocery shopping in Malaysia. According to the table and figure 4.8, there are total respondents who know that the Malaysian store has provided online grocery shopping service to their consumers.
Moreover, another one of the respondents does not know that the grocery store in Malaysia has online grocery shopping service. The top online grocery shopping site recognized by most of the respondents is Tesco.
Scale Measurement
- Reliability Analysis Test
The overall reliability analysis test result shows that the independent variable, perceived ease of use, has the highest reliability with an alpha value of 0.861 compared to the other independent variables and the dependent variable. While the independent variable shows subjective norms the lowest alpha value, 0.707 compared to other independent variables and dependent variable. In sequence, the second highest alpha value is the independent variable perceived ease of use with a value of 0.818, while the second lowest alpha value is 0.710 represented by the dependent variable acceptance of online grocery shopping.
In conclusion, all constructs of independent variables and dependent variables have alpha values greater than 0.7, which means that all constructs are in strong internal consistency.
Inferential Analyses
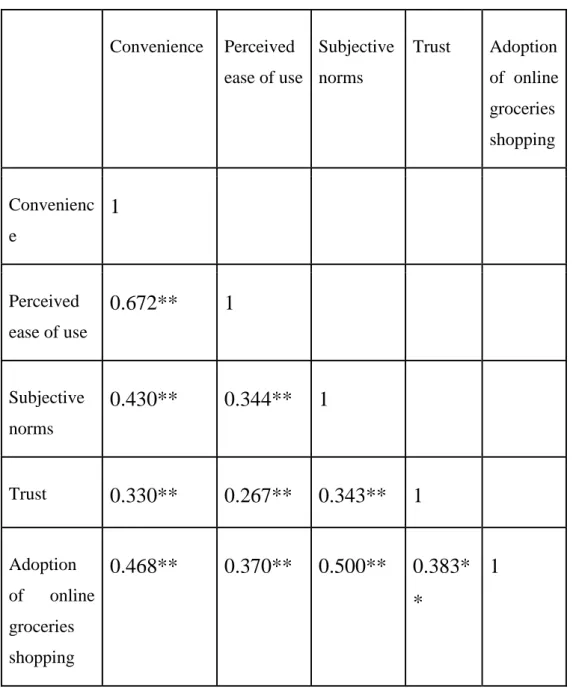
- Pearson’s Correlation Analysis
- Implication of Correlations
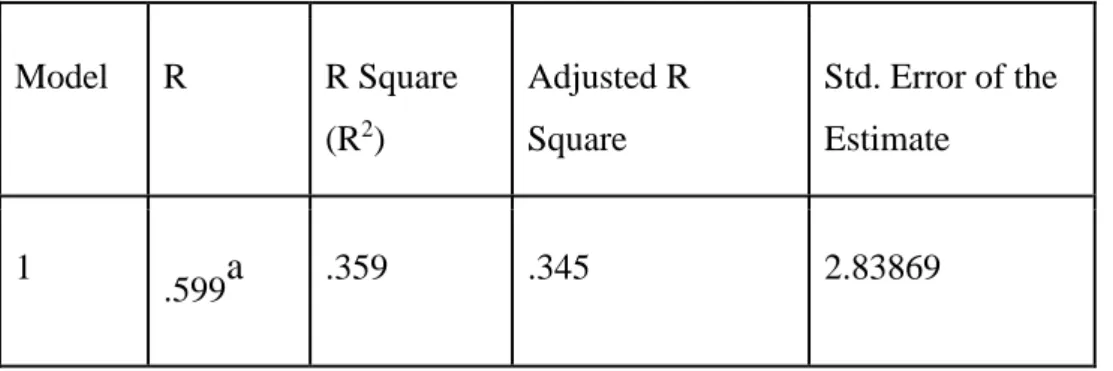
- Multiple Regression Analysis
- Implication of Correlations
Table 4.13 shows that the r-value is 0.500, with the subjective norms having a significant moderately positive linear correlation with the adoption of online shopping. As shown in Table 4.16, the estimated adoption of online grocery shopping is 0.996 where βo is 0.996. Based on Table 4.16, the estimated attitude towards online grocery adoption is expected to increase by 0.359 points at β3 equals .
Based on Table 4.16, the estimated attitude towards the adoption of online grocery shopping takes an expectation to increase by 0.203 points at β4 is equal to. Furthermore, when the p -value is 0.040 where it is less than α at 0.05, trust has a significant effect for Generation X towards adopting online grocery shopping.
Conclusion
DISCUSSION, CONCLUSION AND IMPLICATIONS…
Introduction
Summary of Statistical Analyses
- Descriptive Analysis
- Demographic Profile
- General Information
- Central Tendencies Measurement of Constructs
- Inferential Analysis
- Pearson’s Correlation Analysis
- Multiple Regression Analysis
While the highest standard deviation is the dependent variable, adoption of online grocery shopping with 3.50869 and the lowest standard deviation is the independent variable, subjective norms with 3.10778. The second highest value is 0.818, the independent variable, convenience, the third highest value is 0.726, independent variable, trust and the second lowest value is 0.710, the dependent variable, adoption of online grocery shopping. According to the result in chapter 4, all the independent variables in this research have correlation with the dependent variable, adoption of online grocery shopping.
The result said that the highest correlation value is the relationship between subjective norms and acceptance of online grocery shopping with the value of 0.500. The lowest correlation value is the relationship between perceived ease of use and acceptance of online grocery shopping with the value of 0.370.
Discussions of Major Findings
Based on the table above, the beta value shows that the independent variable, subjective norms, has the highest beta value at 0.359, which means it is able to raise the point of the dependent variable, acceptance of online shopping for everyone. However, the independent variable, perceived ease of use, has a weak influence on the point increase of the dependent variable, acceptance of online shopping for each point increase in perceived ease of use with constants of other variables where the beta value is 0.055. In conclusion, the independent variable convenience, subjective norms, and trust are supported by this study and have a positive relationship with the research question and research goal, while the independent variable perceived ease of use is not supported by the study because its p-value is greater than 0.05 at 0.495.
Reasons have been found to explain the reason why the independent variable, perceived ease of use, has a negative relationship in this research and why the independent variable, perceived ease of use, does not influence generation X to take online grocery shopping. The reason is the perceived risk, which is an opportunity to measure the consumer's perceived ease of use and perceived usefulness in relation to online purchases.
Implications of the Study
- Managerial Implications
A Study of Factors Affecting the Adoption of Online Grocery Shopping Among Generation X in the Klang Valley. Online grocery shopping is easy to learn how to use online shopping website will be easy for me.
Limitations of Study
Recommendations for Future Research
Then, researchers can distribute not only the online Google form, but also distribute the paper questionnaire to those Gen Xers who do not understand how to use the online Google form. It may be more accurate to learn them one by one instead of just choosing any answer without reading the instruction from the questions. The result can be defined on how the variables will affect the adoption of online grocery shopping by Generation X and Generation Y.
Finally, payment risk can be reduced if there is stronger security to protect consumer or bank data. The government can also increase the awareness of cybercrime so that all consumers who buy online can feel safer.
Conclusion