With regard to board independence, the 2002 code mandated that publicly listed firms have at least two independent directors or at least 20% of the board must be composed of independent directors, whichever is the least. On the other hand, large controlling shareholders may also be more inclined to appoint non-strictly independent directors who do not. Again, independent directors can mitigate this problem by monitoring the actions of the controlling shareholders in the interest of minority shareholders.
Model 1: Presence of non-strict independent directors and ownership structure
If the agency theory holds true, the proportion of non-strictly independent directors will have a negative effect on firm performance. If agency theory holds, the proportion of non-strict independent directors on the audit committee will have a negative effect on firm performance.
10.Is not involved in a non-profit organization that receives funding from the covered company; Interlock is measured as the ratio between the number of interconnected executive directors and the size of the board. An interlocking executive director is defined as an executive director who serves as a non-executive director in another company, while an executive director acts as a non-executive director in the first company (Hallock, 1997).
We also included the variable Fsize, the natural logarithm of the company's market capitalization, to control for any effect related to company size. Industry (Industry) and year (Year) dummies are also included to check for sector-wide and macroeconomic effects that may affect the presence of non-strictly independent directors in a company.9. Like Crespi-Cladera and Pascual-Fuster (2014), we estimated this binary response model using three alternative logit models for checking the robustness of our results: (1) a pooled logit regression model with robust standard errors clustered by firms, ( 2) a panel data log model with random effects, and (3) a panel data log model with generalized estimation equations (GEE).
This method is related to the possible generalized linear models (Crespi-Cladera & Pascual-Fuster, 2014). By specifying the GEE model, we set the distribution of the dependent variable to binomial, the link function to the logit or logistic function, and.
Firm Performance, Non-Strict Board Independence, and Ownership Structure To analyze the effect of non-strict independence and ownership structure on firm
ROA is calculated as net profit plus interest expense before tax (EBIAT) divided by the book value of assets (BVA) of the previous period; ROE is calculated as EBIAT divided by the book value of equity (BVE) of the previous period; and NEGPROF is a dummy variable that takes the value 1 if the firm's EBIAT is negative and 0 otherwise.13. Similar to Crespi-Cladera and Pascual-Fuster (2014), NSID is the ratio of the number of non-strictly independent directors to the total number of directors on the board. We included an interaction term between ownership and loose independence (TopOwn × NSID) to investigate whether there is a differential effect of loosely independent directors on firm performance based on firm ownership structure.
We controlled for firm characteristics that may affect firm performance, including firm size (Fsize) as measured previously, firm growth opportunities (Fgrowth) relative to one-period lagged market-to-book asset ratio,14 leverage (Flev) as the ratio of long-term debt to total assets .15 and the company's age (Fage) measured as the natural logarithm of the number of years since the company's founding date. 14 This is the ratio of the sum of the market value of common equity, book value of preferred stock and book value of total debt less deferred tax liabilities and book value of total assets. ED is the ratio of the number of CEOs to the total number of directors.
EDown and NEDown both represent board ownership, Busy monitors NEDs with commitment issues (Fich & Shivdasani, 2007), and Interlock represents NEDs' effort monitoring (Hallock, 1997). According to Adams, Hermalin, and Weisbach (2010), empirical research on corporate governance topics is difficult to conduct because of the interrelationship between corporate governance variables and firm performance measures.
Firm Performance, Non-Strict Board Independence in the Audit Committee, and Ownership Structure
The first measure is the proportion of audit committee members who are non-strictly independent directors (ACNSID). We included an interaction term between ownership and non-strict independence in the audit committee (TopOwn × AC) to examine whether there is a differential effect of the power of non-strictly independent directors in the audit committee on firm performance based on the firm 's ownership structure. On the other hand, almost a fifth of declared independent directors exceeded the term limit of nine years.
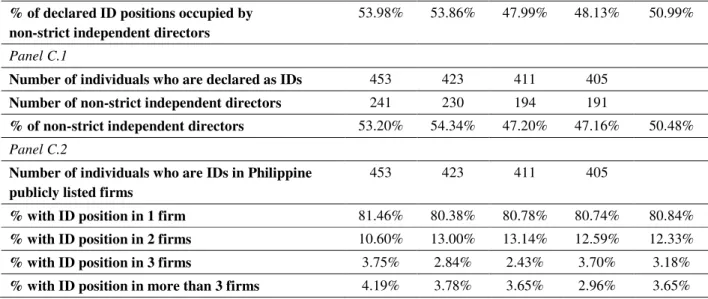
Panel B of Table 3 presents the number of declared independent director positions per year and the number of these positions held by non-strictly independent directors. On average, 50.99% of declared independent directors can be classified as non-strictly independent directors. This indicates that companies with a higher ownership concentration (72.13%) tend to have a higher presence of non-strictly independent directors on the board than companies with a lower ownership concentration (64.88%).
Based on Panel A of Table 5, we note that audit committees consist of almost 50% of independent directors on average; however, on average, more than half of these independent directors are non-strictly independent directors. These results are not surprising and may be due to firms' decision to appoint non-strictly independent directors, as evidenced by the figures in Table 3, where more than 50% of all reported independent directors are non-strictly independent directors.
Results and Discussion Table 7
Contrary to the findings of Crespi-Cladera and Pascual-Fuster (2014), our GEE and RELM estimation results show a positive and significant relationship between ownership concentration and the likelihood that a non-strict independent director is present on the board . This suggests that the larger the ownership share of the firm's principal owner, the more likely the firm is to have a non-strictly independent director on the board. Such a finding is also consistent with the summary statistics reported in Table 4, which show a greater presence of non-strictly independent directors among firms with more concentrated ownership (72.13%) than among firms with less concentrated ownership. concentrated (64.88%).
We also find substantial evidence that larger and busier boards are more likely to have non-strictly independent directors on the board. Finally, we find no significant evidence that CEO duality and interlocking directorates affect the likelihood of having a non-strictly independent director on the board. These results indicate that powerful CEOs are as likely as their non-powerful counterparts to demand the presence of friendly independent directors.
All in all, we find some important evidence that firms with large controlling shareholders tend to have more non-strictly independent directors. To confirm whether controlling shareholders appoint more non-strictly independent directors to the board to hide agency problems, we estimate and present the results for Model 2 in the next section.
Results and Discussion Table 8
For our models using ROA and ROE as firm performance measures, the results of the Wald's test and the Breusch-Pagan Lagrange Multiplier (BPLM) test indicate the presence of firm-specific effects on firm performance. On the other hand, the results of the probability ratio tests for our models using NEGPROF as the firm measure of performance indicate that the random effects estimator is more appropriate to the data than the pooled logit estimator, while the Wald test indicates that logistic regression with fixed effects no better than the pooled logit estimator. The results of the Hausman test further confirm that the random effects estimator is more appropriate than the fixed effects estimator when using NEGPROF as the fixed performance measure.
Overall, regardless of the performance measure used, we believe that the presence of non-strictly independent directors does not have a significant impact on the performance of the company. The finding of an insignificant relationship supports the theory of optimal board independence, which states that companies may nominate non-strictly independent directors just to meet recommended levels of board independence, even if such directors are no longer or have less impact than their strictly independent counterparts. when it comes to improving business performance. The results of Model 1 show that companies with a higher degree of ownership concentration are more likely to have a non-strict, independent director on their board of directors; However, in Model 2, we find that the interaction term between top ownership and the proportion of non-strictly independent directors (NSID x TopOwn) is negative and significant when NEGPROF is used as a measure of firm performance.
We also find some significant evidence that larger firms have lower firm performance when ROA is used as a measure of firm performance. For our corporate governance variables, we find some significant evidence that non-executive director stock ownership improves firm performance.
Results and Discussion Table 9
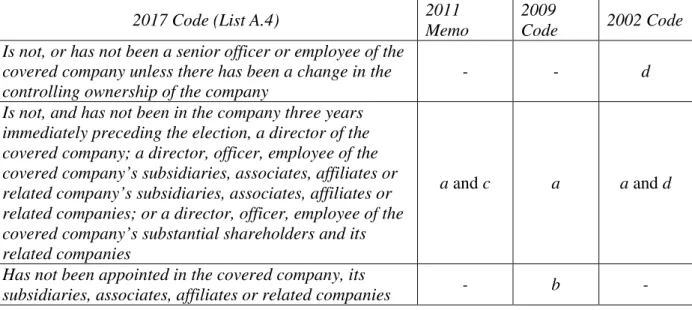
Is not a director or officer of, or a material shareholder of, the Company or its affiliates or any of its material shareholders (other than as an independent director of any of the foregoing). He is not a relative of any director, officer or material shareholder of the Company, any of its affiliated companies or any of its material shareholders. Not acting as a proxy or representative of a significant shareholder of the Company, any of its affiliated companies or any of its significant shareholders;.
is not or has not been a senior employee or employee of the covered company, unless there has been a change in the controlling ownership of the company. is not the owner of more than two percent of the outstanding shares of the covered company, its subsidiaries, associates, affiliated companies or related companies. Is not a relative of a director, officer or material shareholder of the Covered Company or any of its related companies or of any of its material shareholders.
He is not employed as an executive director of another company where one of the crit. He does not own more than two percent of the outstanding shares of the covered company, his. It is not acting as an agent or representative of any director of the covered company or any of its affiliates.
Is not, or has not been, a senior officer or employee of the Covered Company, unless there has been a change in control ownership of the Company.