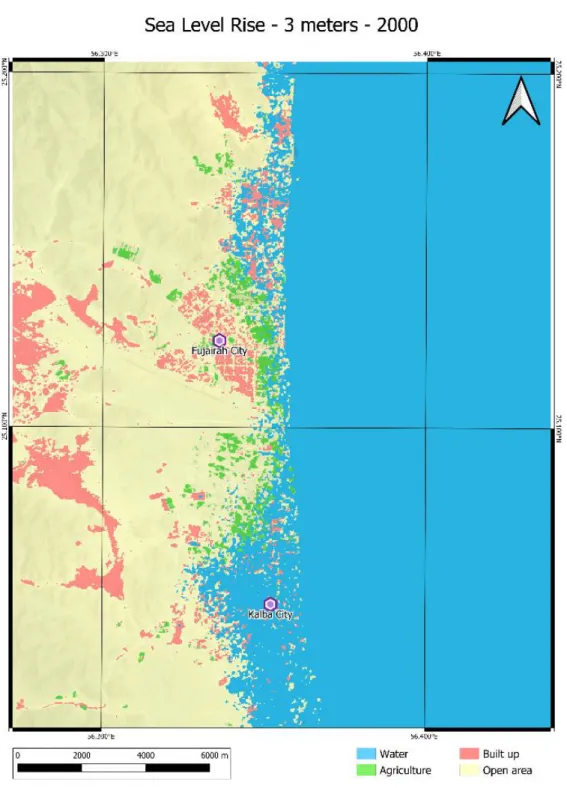
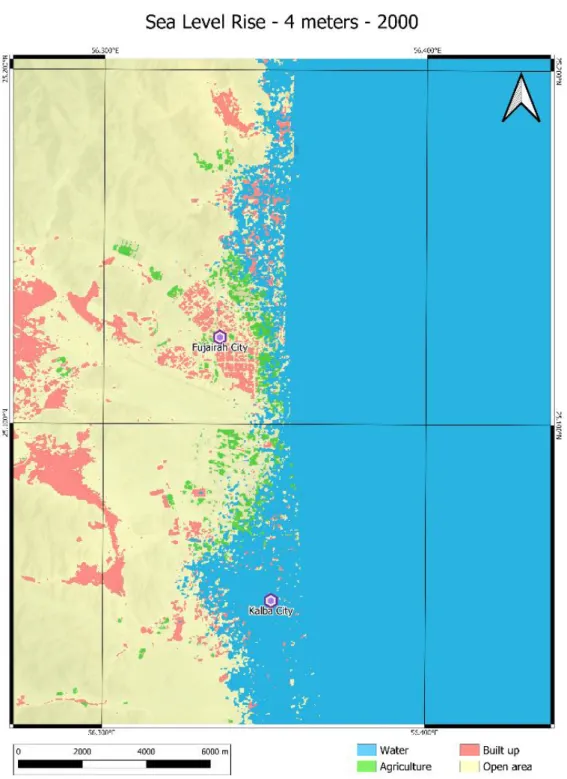
40 Figure 7: 3 m sea level rise scenario and its effect on the land use of the j Fujairah - Kalba coastline in the year 2000. 41 Figure 8: 4 m sea level rise scenario and its effect on the land use of the j Fujairah - Kalba coastline in the year 2000.
Introduction
Overview
In the study by Hereher (2016), he assessed the coastal vulnerability of Saudi Arabia's coastal cities in the Red Sea coast to sea level rise. The study found that urban areas and beaches have high vulnerability to sea level rise in addition to the areas of coral reefs and mangroves that make up 48% of the coast (Hereher, 2016).
Literature Review
- Climate Change at Global Levels
- Climate Change at Regional Levels
- Climate Change at Local Levels
- Sea Level Rise at Global Levels
- Sea Level Rise at Regional Levels
- Sea Level Rise at Local Levels
- Land-Use at Global Levels
- Land-Use at Regional Levels
- Land-Use at Local Level
Radhi's (2009) review assessed the potential impact of global warming on residential buildings in the United Arab Emirates and stated that the United Arab Emirates is one of the largest energy. One of the direct scientific implications of current climate change is the rise in sea levels associated with global warming and the melting of glaciers and polar ice caps. Conversely, in the study of Titus et al. 1991) regarding the effect of greenhouse gases and sea level rise.
In the literature of Massoud et al. 2003), they reported that coastal areas of the Mediterranean Sea, Red Sea, Arabian Gulf and Atlantic Ocean are. The vulnerability of the Arab region to the passive impacts of climate change is extremely high. In addition, most of the notable developments are also located on the coast and islands.
Industrial metabolism and land-use and land-cover change both contribute to the global systematic changes such as deposition of greenhouse gases in the troposphere and depletion of ozone in the stratosphere (Council, 1990; Turner et al., 1994). Climate change and human land use will contribute to potential fire regimes in the future. The literature by Abahussain et al. 2002) proposed the concept of desertification, which is well known and experienced in the Arab region as one of the main outcomes of climate change.
Available information in the literature of Shakhatra (1987) indicates that most of the land resources in the Arab region are either vulnerable to desertification or desertification.
Study Area and Methodology
- Study Area
- Remote Sensing Protocol
- Satellite Image Sources
- Image Classifications
- Construction of SLR Scenarios
- Construction of Confusion Matrix
- Construction of Coastal Vulnerability Index
Flooding due to sea-level rise is evident in hazardous areas, which sometimes suffer from heavy rains. Therefore, Landsat 8 images were needed in light of studying land use variation due to sea level rise in the study area over 20 years. In addition to assessing the vulnerability of land use variation in the study area over 20 years to sea level rise.
After clipping the DEM to the mass, the elevation threshold data is Sea Level Rise (SLR). The result will be a raster layer which is the binary representation of for example; a 1 m rise in sea level that will cover agricultural land. This was used to classify land use and the Digital Elevation Model to model sea level rise scenarios.
The lower the elevation, the more likely the area will be flooded with less significant sea level rise. All 12 expressions were entered into the “Raster Calculation Expression” tool and a vulnerability map of the study area was generated for all sea level rise scenarios.
Results
- Changes in Land Cover 2000 - 2020
- SLR Effects on Land-Use - 2000
- SLR Effects on Land-Use - 2020
- Confusion Matrix
- Coastal Vulnerability Index (CVI)
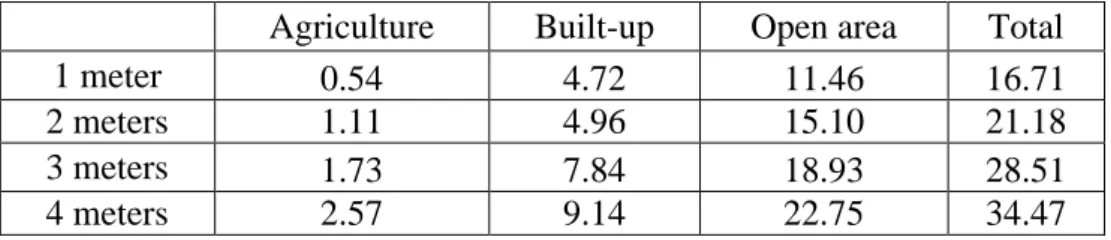
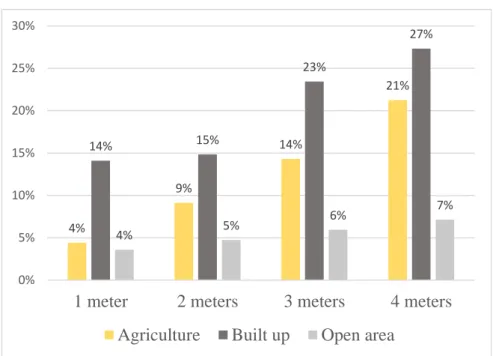
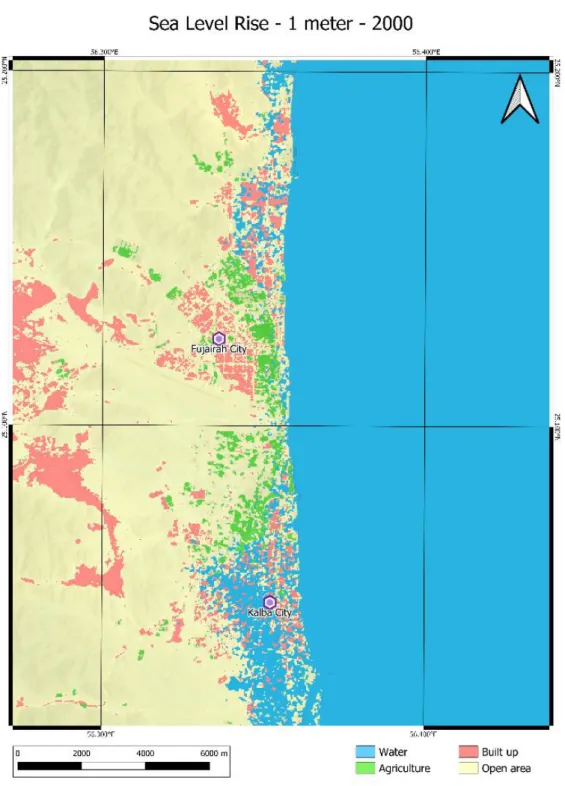
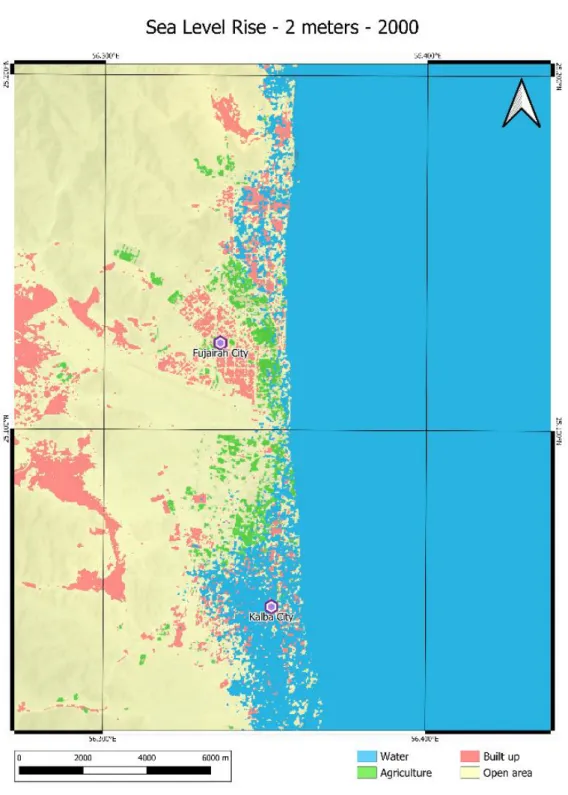
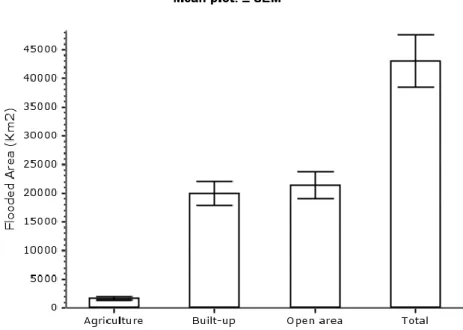
Figures 5,6,7 and 8 show the effects of the four sea level rise scenarios on land use in the study area within the year 2000 using Landsat 7 satellite imagery. As can be seen from Table 1 and Figure 4, in an SLR scenario of 1 m 1.25 km2 of agricultural area will be flooded, which is approximately 17% of the total agricultural area in the year 2020. Due to the results of the year 2020 with 2000 there to compare was a significant increase in the level of damage to the agricultural areas in the year 2020, where it started at 17% and reached 29% with a sea level rise of 4 meters, compared to 2000, where it started at 4% and reached 21% reached with a sea level rise of 4 metres.
On the other hand, the built-up inundated areas in 2020 were 14.99 km2 and in Figure 10 this represents 17% of the inundated area in the 1 m sea level rise scenario, the same as the amount of agricultural area flooding at the same time. scenario. These results go beyond the previous step that was applied to the 2000 residential areas that started at 14% and reached 27% in the 4 m sea level rise scenario. Figures 11,12,13 and 14 show the effects of 4 sea level rise scenarios on land uses in the study area by 2020 using Landsat 8 satellite imagery.
Seven locations of built-up areas on the classified map exactly match real-life locations where three of the ten locations turned out to be open areas in real-life. However, eight locations of agricultural areas are correct against two misclassified pixels, one of them is a built-up area that was a ladies' club and the other is an open land in real life. Seven open area locations on the classified map are correct, with one location appearing to be a building on a farm and the other two locations being plant areas, in Kalba Cornich and a children's fun ground in Fujairah city.
To calculate accuracy, the number of correct pixels will be divided by the total pixels.
Discussion
General Discussion
This loss of agricultural land is equivalent to 2.14 km2 of the total flooded areas under the 4 m SLR scenario, including the loss of the mangrove reserve on the shoreline of Kalba town. The loss of the mangrove reserve means the loss of several local animal species, marine life and birds. The percentage of flooded open areas gradually increases, with the scenarios of 2 m, 3 m and 4 m sea level rise reaching 7%, which is equivalent to 22.75 km2 of the total area of the open areas.
Seven out of ten pixels of the built-up areas are correct and this shows 70% of the accuracy of the built-up areas in the study area. In the year 2000, about 5.20 km2 of the total study area is considered to be highly vulnerable to SLR representing 15% of the total area. Compared to the same area in the year 2020, approximately 15.33 km2 are located in the areas of high vulnerability represented by 29% of the affected area.
It was reported in the study by Ksiksi et al., (2012) that 3% of the study area in the Emirate of Abu Dhabi has a very high vulnerability index and 7% has a high vulnerability index. Additionally, a research report by al Kabban, (2019) assessed the SLR effect on various aspects of the emirate of Abu Dhabi.
Study Limitations
The city of Fujairah appears to be almost reduced in size in the 1 m SLR scenario and completely submerged in the 4 m SLR scenario. The vulnerability of the Emirate population to SLR is reported to be 16% of the governmental population will be affected by a 1 m SLR, 23% by a 2 m SLR, and 30% of the governorate's total population will be affected by a 3 m SLR sea level rise. However, calculating the maximum inundation depth of the land cover classes was 13 m, 14 m and 15 m in a sea level rise of 1 m, 2 m and 3 m, respectively.
It is worth noting that 92% of Abu Dhabi's emirate coastline would experience inundation in a 1 m SLR scenario due to the low-lying area on the coast. Compared to other studies on the sea of Oman, it is expected that in the least SLR scenario, about 400 km2 of the total area in the Sultanate of Oman will be flooded. In the context of global warming, climate change and rising seas, this flexibility is required in the long term.
The images have some percentage of cloud cover, which affects the vision of the study area. In addition, the study area is slightly enlarged in the analysis of the Landsat 8 image to cover the mangrove reserve in Kalba town, where this area was not included in the Landsat 7 image due to the ambiguity of the 2000 data.
Future Studies
Regardless of the resolution of both sensors being similar, finding images on the same date and for the same area will limit the chance of getting absolutely clear images. The effects of climate change will certainly exacerbate the effects of sea level rise, which will make natural disturbances such; hurricanes and seasonal sea storms are getting worse. Sheikh Sultan Alqasmi of the rural emirate of Sharjah has announced the construction of breakwaters on the coastline of the city of Kalba.
The number of breakwaters is 4, the length is 3.6 km and they are 400m away from the sea beach to protect the coastal area. This project ensures the importance and the severity of the sea level rise effects on the land uses, human lives and the construction work on the coastline (Wam, 2021).
Conclusion
GIS-based framework for simulating the effects of sea level rise and coastal flooding on Oman Journal of Earth Science &. Sea Level Rise Vulnerability Assessment for Abu Dhabi, United Arab Emirates - Master, Lund University, Sweden. Vulnerability Assessment and Adaptation to the Effects of Sea Level Rise on the Kingdom of Bahrain.
Predicting the extent of inundation due to sea level rise: Al Hamra Development, Ras Al Khaimah, UAE. Assessing the impact of climate change on sea surface temperatures and sea level rise - Arabian Gulf. December 2021, from: https://www.climate.gov/news- features/understanding-climate/climate-change-global-sea-level.
Sea level rise and its impact on wetlands, water, agriculture, fisheries, aquaculture, migration, public health, infrastructure and adaptation. Sea level rise and Abu Dhabi's coastlines: an initial assessment of the impact on land and mangrove areas.