Getting Started with Futures by Todd Lofton Getting Started with Mutual Funds by Alan Lavine. No part of this publication may be reproduced, stored in a retrieval system, or transmitted in any form or by any means, electronic, mechanical, photocopying, recording, scanning, or otherwise, except as permitted under Section 107 or 108 of the U.S. copyright 1976. Acting without the prior written permission of the publisher, or authorization by payment of the applicable per copy fee to the Copyright Clearance Center, 222 Rosewood Drive, Danvers, MA fax.
INTRODUCTION
Research the sector (or, if it is a diversified company, key industries) of the security's issuer. Try to learn about the company's employees: middle management and the factory.
PART ONE—
TOOLS OF THE TRADE
- Accounting for business transactions
- Economics
- The mathematics of finance
- Quantitative analysis using basic statistics and regression analysis
Chapter 3, "Mathematics of Investments," covers the basics of the entire study of investment finance—the mathematics behind the future value of money. The quantitative approach to investment analysis is critical when the investor is making a hypothesis about the relationship.
Chapter 1—
Accounting
The classical theory
The market-based research approach
The positive accounting theory
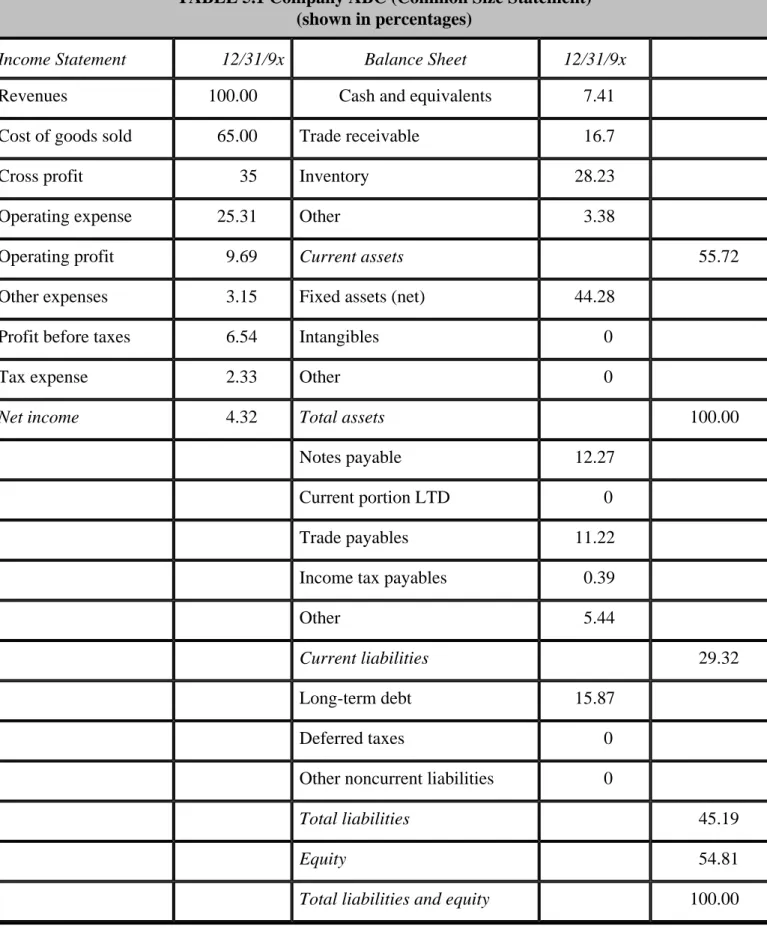
The book value of a company is calculated as its equity: assets minus liabilities. Ironically, this is the starting point for much of what is known as fundamental analysis: the analysis of a company that uses quantitative models to determine earnings and subsequent valuation.
Chapter 2—
Economics
The international parity theorems that serve as the underpinning for financial currency and international trade valuations
The U.S. government's monthly economic releases
The business cycle and the implications to investment timing
In the ivory towers of Wall Street, the sources of this economic research have a difficult time determining the health of the economy. If trained economists cannot assess the health of the economy with consistent accuracy, what is the likelihood that today's typical investor can.
Futures on interest rates begin to decline in price immediately (increase in yield)
Treasury bond prices also decrease sharply, and therefore yields on treasuries are now 7.22%
The price of the zero-coupon bond is now $168.98 (offered price or buy price) per bond, with a yield to maturity of 7.22%
The currency market can be a hub for discussing the differences between investments in different countries. The exchange rate between the dollar and the pound will increase (eg the number of pounds needed to "buy" one dollar will increase).
A Japanese car manufacturer exports cars to the United States, and expects to receive 10,000 Yen (¥) for each car sold
The economic incentives for domestic importers decrease (their currency, used to purchase foreign goods, is decreased in value), while the fortunes of domestic-based
The economic information released by the government from time to time, collectively known as indicators, is believed to indicate the health of the economy. The effect depends on the type of portfolio (equity or debt) and the extent and direction of the economic release.
Employment and Unemployment
Income and Production
Consumption
Housing
Autos
Credit
Deficit
Confidence Measures
Composites
Financial Indicators
Prices, Costs, and Productivity
Business Sector
The basic premise of this publication is its strong correlation with the future direction of the economy. The design of the LEI allows it to serve as a barometer of the future direction of the economy.
Average workweek of production workers in manufacturing. Due to the uncertainty associated with timing of the business cycle (the economic outlook in the early stages of a
The basic tenet of the LEI is that changes in the business cycle can be a guide to the future direction of the economy, and its forward-looking nature warrants close attention from Wall Street. Due to the uncertainty related to the timing of the business cycle (economic outlook in the early stages of a.
Average initial weekly claims for state unemployment insurance. Like the preceding
The LEI is measured on a monthly basis in percentages for the period of the previous month (i.e. the report for June is published at the end of July); this remains one of the main criticisms.
Manufacturer's new orders for consumer goods and materials, adjusted for inflation
Vendor performance (companies receiving slower deliveries from suppliers). This is an interesting approach to determining the strength (on a forward basis) of the economy—the
Also as mentioned, the increased level of permits for new construction has a direct, positive relationship with a stronger economy.
Change in manufacturers' unfilied orders, durable good industries. The rate of accumulation of inventories indicates the expectation of future sales
Index of consumer expectations. Two organizations report a measure of consumer confidence—University of Michigan's Survey Research Center (index of consumer
It is important to examine the fundamentals surrounding the formation of the leading economic indicators as well as the related lagging and lagging indicators. The leading, coinciding and lagging indices of economic activity are based on the concept that each phase of the business cycle (see Figure 2.1) contains the seeds for the following phase. Adapted from Wesley Mitchell's early twentieth century business cycle concepts, this system assesses the strengths and weaknesses of the economy to find clues to future growth rates as well as cyclical turning points (changes from recession to expansion).
The leading index attempts to pinpoint the time when the economy begins to shift from a contracting phase (recession) to an upward bias or recovery
As of August 1996, the Conference Board is considering a proposal to remove two indicators (change in unfilled orders, the durable goods industry, and change in sensitive materials prices) from the leading indicators index because of their poor forecasting power over the past decade. This Federal Reserve study is firmly rooted in the interest rate expectations hypothesis, which posits a relationship between long-term interest rates and current investor expectations of inflation: A normal-shaped yield curve (higher long-term interest rates than short-term interest rates) illustrates that investors expect inflation in the future and thus fixed-income investors demand a higher interest rate to go further out on the curve, whereas an inverted yield curve (short interest rates higher than long interest rates) illustrates little fear of future inflation and therefore a. Although the LEI is most commonly used in investment finance (for its forward-looking design), the coinciding and lagging indicators can also provide important levels of investigation for industry analysis.
The coincident index mimics the cyclicality of the overall economy and tends to coincide with recessions and expansions
Furthermore, there appears to be a movement in the Conference Board towards adding to the LEI an indicator representing a yield curve component (a spread-based indicator that quantifies the difference between the 10-year Treasury yield with either the 3-month or 1-year discount rate ). A recently published report by two economists at the Federal Reserve Bank of New York credits the yield curve with strong predictive abilities for upcoming economic downturns (about four quarters before the onset of a recession). The lagging index falls after the beginning of the recession and turns up after the beginning of the expansion.
The lagging index turns down after the beginning of the recession and turns up after the beginning of the expansion
The personal consumption expenditure category is the largest segment of gross domestic product (GDP), accounting for almost 66%. Personal consumption expenditure is measured as a monthly percentage (change from the previous report) and is reported as a percentage. Trend analysis plays an important function in this indicator as it indicates an expansion or contraction of the trade deficit.
You are a manufacturer producing widgets in a highly competitive industry
You begin to notice price increases in your raw materials
Deciding to lock in these prices before they rise any further, you purchase more of the raw material than normal
The new widgets are more expensive than those previously in inventory, lowering your profit margins. If it wasn't for the highly competitive nature of the widget industry you
This report is published in the month following the measurement (in June the CPI for May is reported). As any traveler to the Far East would attest, PKM is not true, at least not in the short term (Adler & Dumas research shows that inflation differentials contribute less than 5% to short-term exchange rate volatility). How could the parity condition (which reflects the effect of one variable on another) be expected to hold in the short run when costs such as taxes and shipping are barriers to trade.
Multinational businesses use these forecasts to calculate their exchange rate exposure (and the respective risk management techniques) during a given period
Multinational companies use these forecasts to calculate their exchange rate exposure (and respective risk management techniques) over a given period.
Government policymakers utilize these forecasts when determining an effective monetary and fiscal policy plan
Intuitively, this makes sense - prices are higher in France compared to those in the US, and so the franc is depreciating against the dollar. Therefore a careful examination of the IRP equation will suggest that the IRP does not currently hold because the future price should be or.5503 £/$1). Borrow £100 in the UK (at 5% interest payable in 1 year) because the cost of borrowing is less than in the US.
But we will still need to pay back the U.K. loan in pounds next year and therefore you would want to hedge this currency exposure by locking in next year's exchange rate today
The exchange rate on the futures exchange has not (according to IRP) correctly valued the British pound against the dollar; it trades at a discount to the value perceived by the IRP. The United States pays more interest than Britain, so if IRP holds rates, so will the US.
That's not to say a currency investor can't make a profit – because the difference between a speculator and an investor revolves around the fact that the speculator has 'placed a bet' and is not risk averse, while the investor may have mountains of research backing his support the statement. trade and aims for a defined expected time horizon and an expected return. The £/$ exchange rate (the number of Irish currencies per US dollar) is currently (the Irish inflation rate is 7% and the US inflation rate is 5%). This makes sense because the interest rate difference points to approximately 2%. % decline of the point against the dollar.
Suppose that
Chapter 3—
Investment Mathematics
- Using the equation as previously shown
- Using a scientific calculator's (HP12C) future value (FV) function
- Using the future value tables (see Appendix B)
- Enter the following
- Using the Rule of 72, we can estimate that it will take about 12 years for this investment to double (72 divided by 6 is 12 years)
The future value of this annuity (as shown) is simply the sum of these three calculations. Well, there is—the future value (and present value) of annuity tables (see Appendix B, Tables B.9–B.12). Using Appendix B, Table B.9, find the future value factor (FVF) for a 6 percent interest rate (horizontal axis) for 5 years (vertical axis).
Chapter 4—
Quantitative Analysis
Basic statistical constraints
Regression equation analysis
The mean is the sum Σ (sigma) of all observations of X from the first (Xi) to the Nth divided by the population size (N). This fact becomes important to the investor who is evaluating the returns of a particular investment opportunity - the CAGR removes some of the volatility inherent in calculating the arithmetic mean. What is the geometric mean (compound annual growth rate), arithmetic mean, variance, and standard deviation of the following set of return figures.
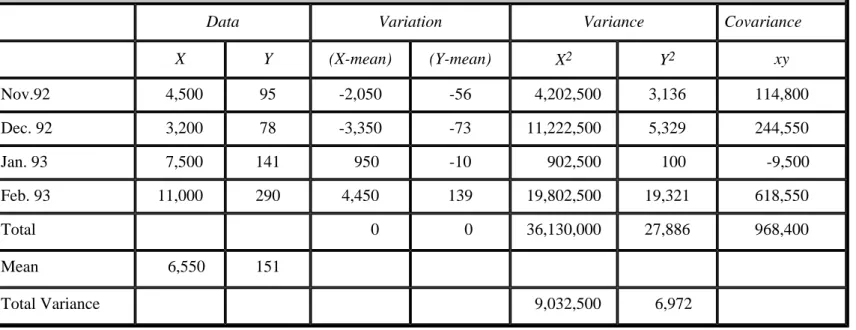
Add each of the preceding products to get total variation
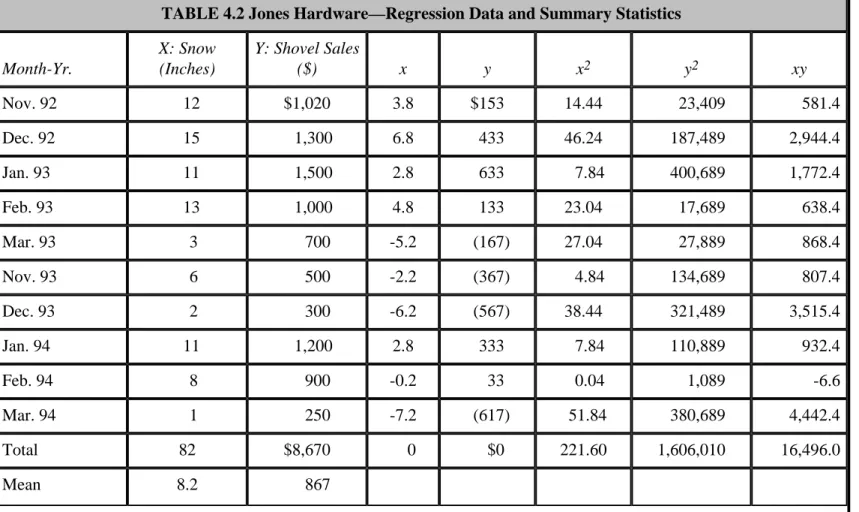
Because of its simplicity, this example serves as an excellent illustration of the basic principles of regression analysis. Jones wanted a better way to predict how much snow shoveling he might need for the upcoming winter season. Jones realizes that the variability of the weather cannot really be estimated, but has confidence in the written forecasts (for snowfall) of the Farmer's Almanac.
Jones' small retail space, he felt it was critical to try to figure out the best estimate so the store wouldn't be burdened with storing shovels in the off-season. In discussions about this project with his business manager, Jones agreed that there must be some connection between snowfall (in his area) and the demand for snow shovels. Once the coefficients of the equation are calculated, the expected snowfall for the upcoming season can be entered and a sales estimate calculated.
Beta (β) represents the slope or the ratio between the change in snowfall and the change in sales of shovels
While this example is simple, the result is important for investment analysis - the use of. Population of 49-year-olds (in the United States) in the S&P index. For the latter example, one suggests Harry Dent's work, The Great Boom Ahead.) Because of the ability of regression analysis to predict future trends, its use has been widespread in the practice of investment analysis. Tom believes there is a relationship that can be estimated through regression analysis between nail sales.
PART TWO—
FUNDAMENTAL FINANCIAL SECURITY ANALYSIS
Once the quantitative formulation is developed, the stock and credit analyst turns his attention to the qualitative measures that are critical to the valuation of all securities. 34;kick-the-tire routine that is equivalent to the valuation process and requires the practitioner to keep an open mind and a skeptical eye at the same time. Although this anatomical performance may take many years (or several market cycles) to master, without qualitative measures the true measure of a security's value can never be fully calculated.
Chapter 5—
Equity Analysis and Valuation
Bargaining power of buyers
Bargaining power of suppliers
Threat of new entrants
Threat of substitute products or services
Rivalry among existing firms
In this stage, which is usually the longest stage, the company's product market matches that of the aggregate economy/industry. This threat is currently low, mainly due to the lack of a unifying protocol (AN 4, 5), but is increasing somewhat due to the selective provision of some router functions by other pieces of equipment (AN 6). Any discussion of risk in investment financing should focus on the study of the required rate of return.
Reduce payout ratio. Although theoretically this would seem to be the best (least expensive and most efficient) method to raise capital, most companies are reticent to
This strategy is typically considered on the more expensive end of the spectrum; moreover, it is not available to many (smaller or non-public) companies. As mentioned, this is often accompanied by an increased risk (of financial distress). This increased risk translates into a higher risk premium related to the need). This increased risk translates into a higher risk premium associated with the stock's cost of capital in the future.
Increase pricing. It may become necessary for a firm to increase their prices (on goods or services sold) to reduce the growth of the business (note the obvious inverse relationship
If the latter, the company needs to do some soul-searching to identify and remove the internal constraints on company growth. So one might expect that a reduction in dividends would mean that the company is undergoing a contracting business cycle or possibly something worse (financial distress? or company-specific problems?) because the dividend is sacrosanct and the board will only cut it when things are busy is to touch. rough. Assume that the company in question experiences slow growth in its business and therefore finds few positive net present value projects to reinvest the cash flow from operations; the retention (ploughback) ratio is low and decreasing.
Buy growth. The attempt to diversify into other businesses is the quintessential modus operandi of a corporate raider, who would come into a company sell off any marginal (or
Do = Today's value of dividends. ga = Initial, abnormally high, growth rate gn= Long-term growth rate. The additional growth rate (outlier) is used to capture the possibility that changes in the industry will result in significantly lower growth than predicted by the range of analysts (worse case in the growth scenario). After this value we adjust for the value of each year below the unsustainable growth rate to yield the desired total value.
In the next step of this method, we begin by ascertaining the value of the sixth period's dividend (DIV 6 ). This dividend is crucial to our analysis for it is the first year where a new growth
From the preceding matrix, it appears that a higher long-term growth rate is much more additive to the present value than the same increase in the short-term growth rate. The long-term growth rate lasts longer and should therefore have a much more pronounced effect on the present value. This is the lesson to be learned: The part of the 2-step equation that is harder to develop a growth rate for (because things can change quite dramatically in the future) has the greater effect on present value.
Chapter 6—
Credit Analysis
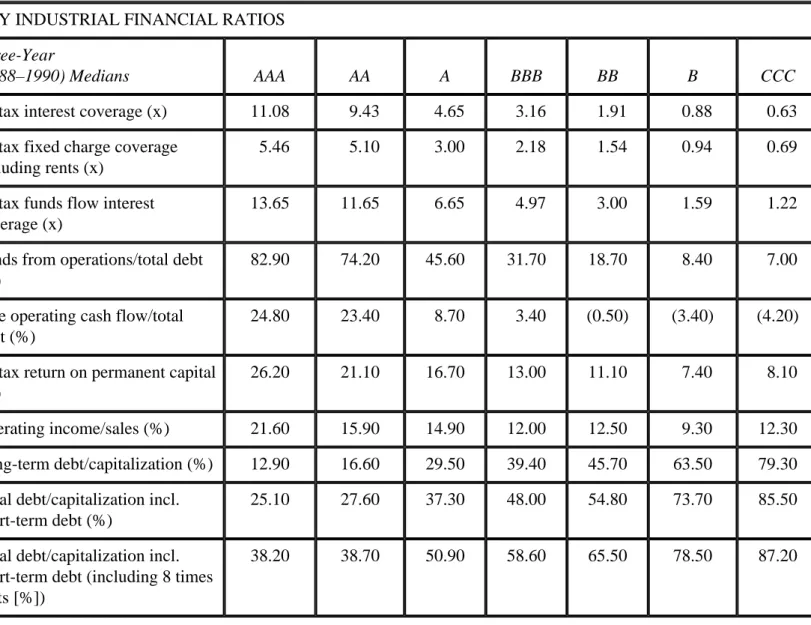
These ratios (or tools) come in four flavors, each measuring a different part of the business. In this category there are three ratios with which Myron gets a grip on the efficiency of the company. The more often the company can cover its interest costs, the better it is for the debt holder.
PART THREE—
PORTFOLIO MANAGEMENT