Saudi Arabian Monetary Agency – Insurance Supervision Department
The Saudi Insurance Market Report
2010
Introduction 4 Insurance Market Performance - Overall
– Gross Written Premiums 6
– Insurance Penetration 7
– Insurance Density 8
– Gross Written Premiums by Line of Business 9
– Net Written Premiums by Line of Business 11
– Retention Ratio by Line of Business 13
– Gross Claims Paid by Line of Business 14
– General and Health Net Earned Premiums vs. Net Claims Incurred 15
– Market Profitability 16
– Balance Sheet - Policyholders’ Assets 17
– Balance Sheet - Shareholders’ Assets 18
– Balance Sheet - Policyholders’ Liabilities and Equity 19
– Balance Sheet - Shareholders’ Liabilities and Equity 20
Insurance Market Performance - By Line of Business
– Health Insurance 22
– Protection and Savings Insurance 23
– Motor Insurance 24
– Property/ Fire Insurance 25
Table of Contents
Table of Contents
– Engineering Insurance 26
– A&L and Other Insurance 27
– Marine Insurance 28
– Energy Insurance 29
– Aviation Insurance 30
Other Market Indicators
– Commissions Incurred by Line of Business 32
– Employees Breakdown by Nationality 33
– Insurance Market Structure 34
– Capitalization of Insurance Companies 35
Appendix: Data Tables
– Table 1: Gross Written Premiums by Line of Business 37
– Tables 2 & 3: Insurance Penetration and Density 38
– Table 4: Net Written Premiums by Line of Business 39
– Table 5: Retention Ratio by Line of Business 40
– Table 6: Gross Claims Paid by Line of Business 41
– Table 7: Commissions Incurred by Line of Business 42
Introduction
Introduction
Introduction
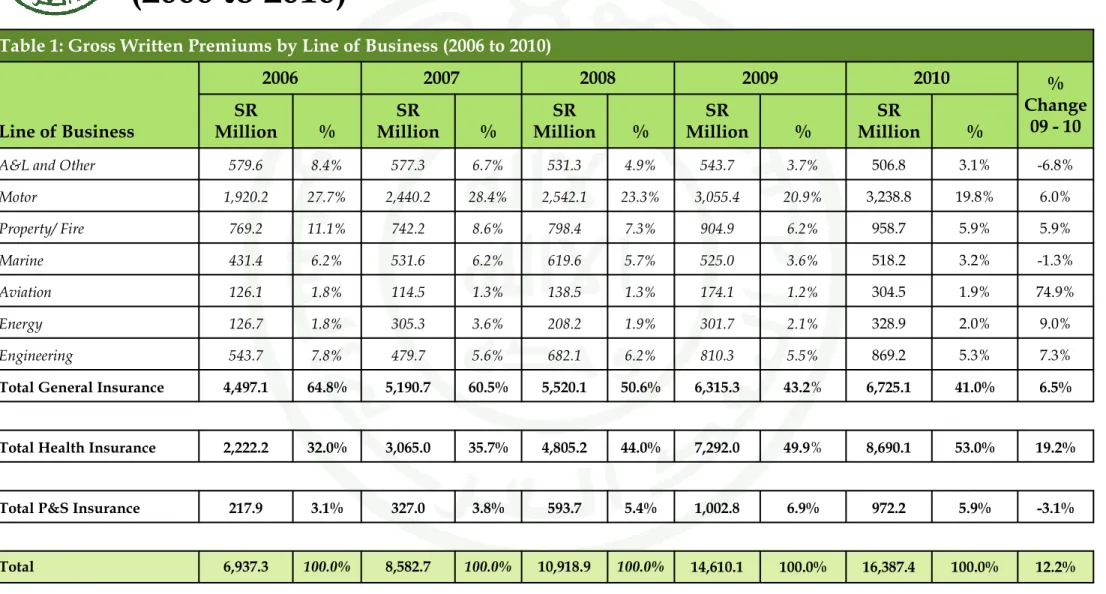
In 2010, Gross Written Premiums (GWP) in the Saudi insurance market reached SR 16.4 Billion, up from SR 14.6 Billion in 2009. This represents an increase of 12.2%, compared to a 33.8% growth rate in 2009:
– Health insurance GWP, which represent 53% of the insurance market, increased by 19.2% to SR 8.7 Billion in 2010 compared to SR 7.3 Billion in 2009
– General insurance GWP, which represent 41% of the insurance market, increased by 6.5% to SR 6.7 Billion in 2010 compared to SR 6.3 Billion in 2009
– Protection & savings (P&S) insurance GWP, which represent 6% of the insurance market, decreased by 3.1% to SR 0.97 Billion in 2010 compared to SR 1 Billion in 2009
Insurance Market Performance - Overall
Insurance Market Performance - Overall
Gross Written Premiums
Gross Written Premiums (2006 to 2010, SR Million)
% Growth 2009–10
-3.1%
19.2%
6.5%
12.2%
2,222
3,065
4,805
7,292
8,690 972 1,003
8,583
5,191 327
2006 6,937
4,497 218
2010 16,387
6,725
2009 14,610
6,315
2008 10,919
5,520 594
2007
General Health P&S
The overall insurance Gross Written Premiums increased by SR 1.77 Billion to reach SR 16.39 Billion(1)in 2010, compared to SR 14.61 Billion in 2009, which represents a growth rate of 12.2%
Health insurance remained the biggest line of business in 2010. Its contribution to total GWP increased from 50% in 2009 to 53% in 2010, while General insurance’s contribution to total business volume decreased from 43% in 2009 to 41% in 2010
Health insurance accounted for SR 1.39 Billion of the SR 1.77 Billion increase, which represents a 78.6% contribution to the market’s GWP increase
Protection and Savings insurance remained the smallest line of
business accounting for 6% of total GWP, with a decrease in its written premiums by 3.1% in 2010
In SR Million
Protection
& Savings Health Insurance
General Insurance Total
218 3%
2,222 32%
4,497 65%
6,937 100%
2006 SR (M)
% Total
327 4%
3,065 36%
5,191 60%
8,583 100%
2007 SR (M)
% Total
594 5%
4,805 44%
5,520 51%
10,919 100%
2008 SR (M)
% Total
1,003 7%
7,292 50%
6,315 43%
14,610 100%
2009 SR (M)
% Total
972 6%
8,690 53%
6,725 41%
16,387 100%
2010 SR (M)
% Total
Insurance Penetration
Insurance penetration of total Gross Domestic Product (GDP) is defined as Gross Written Premiums divided by the total GDP
Over the past five years, insurance penetration has been growing at a
compounded annual growth rate (CAGR) of 17%
In 2010, insurance penetration decreased to 1%, down from 1.06% in 2009. This is mainly due to a strong growth in total GDP (18.6% in 2010 compared to -21.2% in 2009). The oil sector accounted for a
significant part of this growth
Insurance penetration of non-oil GDP is defined as Gross Written Premiums divided by non-oil GDP
Insurance penetration of non-oil GDP increased to 2.08%, up from 2.02% in 2009 Insurance penetration of non-oil GDP has
grown at an average annual rate of 16%
between 2006 and 2010 2009
2.02%
0.14%
1.01%
0.87%
2008 1.59%
0.09%
0.70%
0.81%
2007 1.34%
0.05%
0.48%
0.81%
2006 1.15%
0.04%
0.37%
0.74%
2010 0.85%
1.10%
0.12%
2.08%
+16%
Insurance Penetration of Non-Oil GDP(2) (2006 to 2010, % of Non-Oil GDP)
0.53% 0.53%
0.27%
0.22%
+17%
2010 1.00%
0.06%
0.41%
2009 1.06%
0.07%
0.46%
2008 0.62%
0.03%
0.31%
2007 0.61%
0.02%
0.37%
2006 0.53%
0.02%
0.17%
0.34%
(1) Total GDP of SR 1,308, SR 1,414, SR 1,758, SR 1,384, and SR 1,642 Billion in 2006, 2007, 2008, 2009, and 2010, respectively (2) Non-oil GDP of SR 604, SR 642, SR 686, SR 723, and SR 788 Million in 2006, 2007, 2008, 2009, and 2010 respectively
Insurance Penetration of Total GDP(1) (2006 to 2010, % of Total GDP)
% Growth 2009–10
-10.2%
-18.3%
-5.4%
0.5%
% Growth 2009–10
-2.3%
-11.1%
2.9%
9.3%
Total P&S Insurance Total Health Insurance Total General Insurance Total P&S Insurance Total Health Insurance Total General Insurance
Insurance Density
Insurance density is defined as Gross Written Premiums per Capita. Insurance density increased from SR 576 per Capita in 2009 to SR 604 per capita in 2010, which represents a 4.9% increase
Expenditures per Capita on insurance products have increased by an average annual rate of 20% between 2006 and 2010 The density of Protection and Savings
insurance remained low in absolute terms, and relative to General and Health
insurance, at SR 36 per Capita
94 128
194
287 320
36 40
2009 576
249
2008 440
24 222
2007 358
14 216
2006 293
9 190
2010 +20%
248 604 Insurance Density(1)
(2006 to 2010, SR per Capita)
% Growth 2009–10
-0.4%
-9.4%
4.9%
11.4%
Total P&S Insurance Total Health Insurance Total General Insurance
Motor and Health insurance accounted for around 73% of total GWP in 2010
Health insurance, which includes both compulsory and non-compulsory lines of business, remained the largest line of business in 2010, accounting for 53% of total GWP
Motor compulsory and non-compulsory lines of business stood in second place with a 20% share of total GWP
Aviation insurance underwritten premiums increased by 75% in 2010 Health insurance was the second fastest
growing line of business realising a growth rate of 19%
P&S underwritten premiums decreased by 3%
Gross Written Premiums by Line of Business
(1) A&L stands for Accidents and Liabilities insurance throughout the document
In SR Million
Health
Motor
P&S
Property
Engineering
Energy
Aviation
Total
2007
2006 2008
SR M %
Total SR M %
Total SR M % Total
2,222 32% 3,065 36% 4,805 44%
1,920 28% 2,440 28% 2,542 23%
218 3% 327 4% 594 5%
769 11% 742 9% 798 7%
544 8% 480 6% 682 6%
127 2% 305 4% 208 2%
126 2% 114 1% 139 1%
6,937 100% 8,583 100% 10,919 100%
2009
SR M % Total
7,292
3,055
1,003
905
810
302
174
50%
21%
7%
6%
6%
2%
1%
14,610 100%
2010
SR M % Total
8,690
3,239
972
959
869
329
304
53%
20%
6%
6%
5%
2%
2%
16,387 100%
Growth
% 09 – 10
19%
6%
-3%
6%
7%
9%
75%
12%
A&L(1)+
Other 580 8% 577 7% 531 5% 544 4% 507 3% -7%
Marine 431 6% 532 6% 620 6% 525 4% 518 3% -1%
Gross Written Premiums by Line of Business (continued)
1,920
2,440
2,542
3,055
3,239 905
959 972 1,003
798 742
769
869 810
127
174
139 114
580 126 544 431 218
2,222
2008 10,919
577 305
532 327
3,065
2007 8,583
480
531 620 682
594
208
2010 16,387
6,937
507 +24%
518
8,690
329 304
2006
544 525302
4,805
2009 14,610
7,292
Health Motor P&S
Property/ Fire Engineering Marine
A&L and Other Energy
Aviation Gross Written Premiums by Line of Business
(2006 to 2010, SR Million)
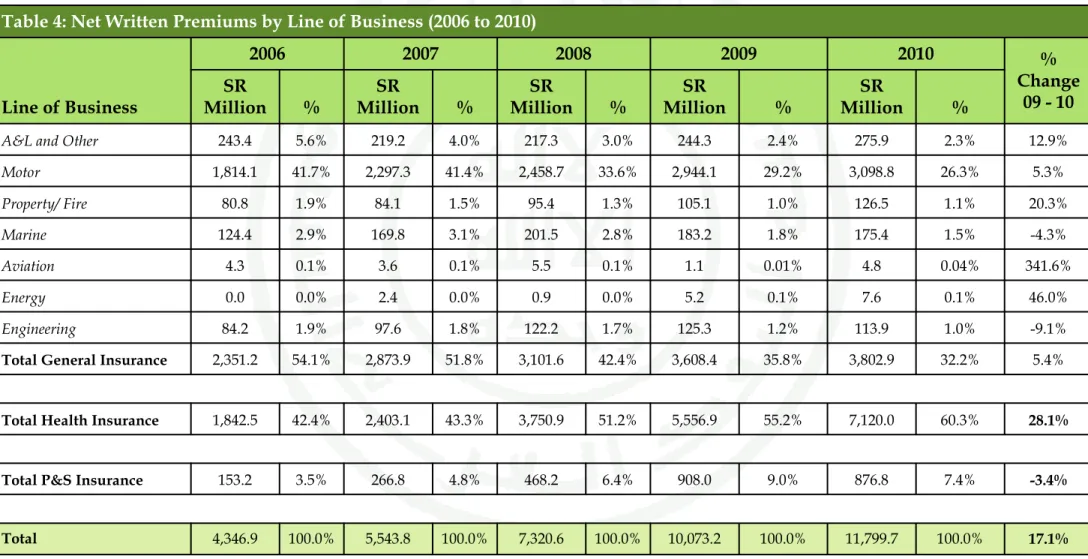
Net Written Premiums (NWP) is defined as the premiums retained by the insurance company, after the subtraction of the premiums ceded to local or international reinsurers from GWP by line of business Total NWP increased from SR 10.07 Billion
in 2009 to SR 11.80 Billion in 2010, a 17%
increase
Around 86% of total NWP in 2010 was generated by Motor and Health insurance Health insurance remained the largest line
of business accounting for 60% of total NWP compared to 55% in 2009
Motor insurance share of total NWP continued to decrease but remained in second place. Motor insurance accounted for 26% of NWP in 2010, down from 29% in 2009
Net Written Premiums by Line of Business
In SR Million
Health
Motor
P&S A&L +
Other Marine
Engineering
Property
Energy
Aviation
Total
% Total
% SR M Total
% SR M Total SR M
2008 2007
2006
1,843 42% 2,403 43% 3,751 51%
1,814 42% 2,297 41% 2,459 34%
153 4% 267 5% 468 6%
243 6% 219 4% 217 3%
124 3% 170 3% 201 3%
84 2% 98 2% 122 2%
81 2% 84 2% 95 1%
0 0% 2 0% 1 0%
4 0% 4 0% 6 0%
4,347 100% 5,544 100% 7,321 100%
% Total SR M
2009
5,557 55%
2,944 29%
908 9%
244 2%
183 2%
125 1%
105 1%
5 0%
1 0%
10,073 100%
% 09 – 10 Growth
% Total SR M
2010
7,120 60% 28%
3,099 26% 5%
877 7% -3%
276 2% 13%
175 1.5% -4%
114 1% -9%
127 1% 20%
7.6 0.1% 46%
4.8 0.04% 342%
11,800 100% 17%
Net Written Premiums by Line of Business (continued)
3,099 2,944
2,459 2,297
1,814
153
877 908
276 244
1,843 4,347
2006
98 219 267
243 84
2,403 5,544
2007
+28%
2010 11,800
7,120 175 127
2009 10,073
5,557 183 105
2008 7,321
3,751 468 217 201
Net Written Premiums by Line of Business (2006 to 2010, SR Million)
Property/ Fire Engineering
Health Marine
Motor P&S
A&L and Other Energy
Aviation
Retention Ratio by Line of Business
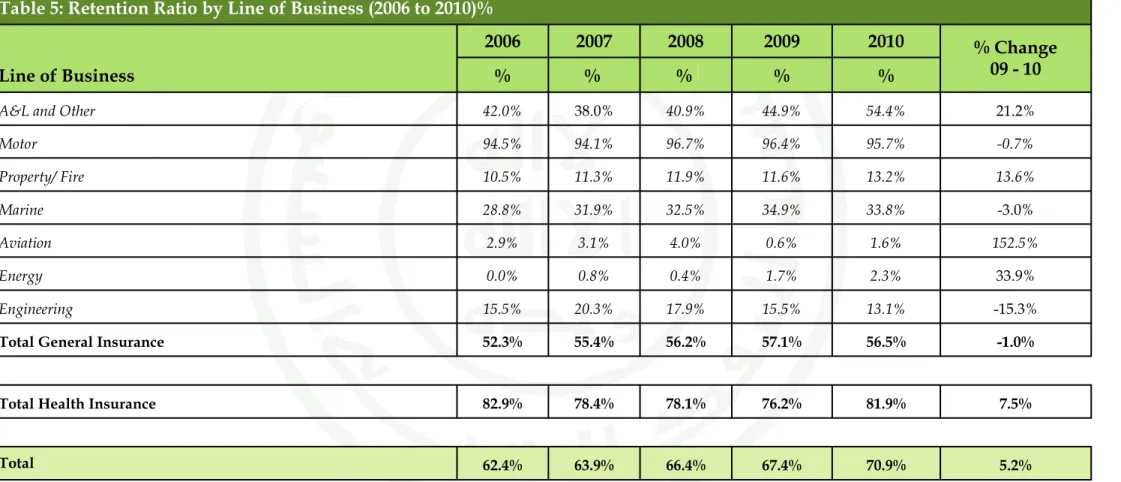
The retention ratio measures the written premiums retained by the insurance company. It is calculated by dividing the NWP by the GWP
The overall retention ratio of insurance companies in the Saudi market increased from 67.4% in 2009 to 70.9%
in 2010. This ratio is largely skewed due to the high retention ratio of Motor and Health insurance which collectively account for around 73% of total GWP. In 2010, the retention ratios for Motor and Health insurance were 96% and 82%, respectively
The weighted average retention ratio of other insurance lines of business (i.e., excluding Motor and Health insurance) reached 20.2% in 2010, down from 20.4% in 2009
Notes:
- Newly licensed companies are required to adhere to a minimum retention ratio of 30% (as per Article 40 of the Implementing Regulations)
- Retention ratios are not shown for Protection &
Savings insurance as the savings element of the contract must be retained in the Saudi Arabian company. Therefore retentions for Protection &
Savings insurance are not directly comparable with other insurance lines of business
97%
78%
41%
33%
12%
18%
4%
0%
1%
2%
15%
12%
35%
45%
76%
96%
2%
2%
70.9%
20.2%
Aviation Energy Engineering
13%
Property/ Fire
13%
Marine
34%
A&L & Other
54%
Health
82%
Motor
96%
Retention Ratios by Line of Business (2008 to 2010, % of GWP)
2010 2009 2008 Weighted average excluding
Motor and Health insurance
Weighted average including all lines of business
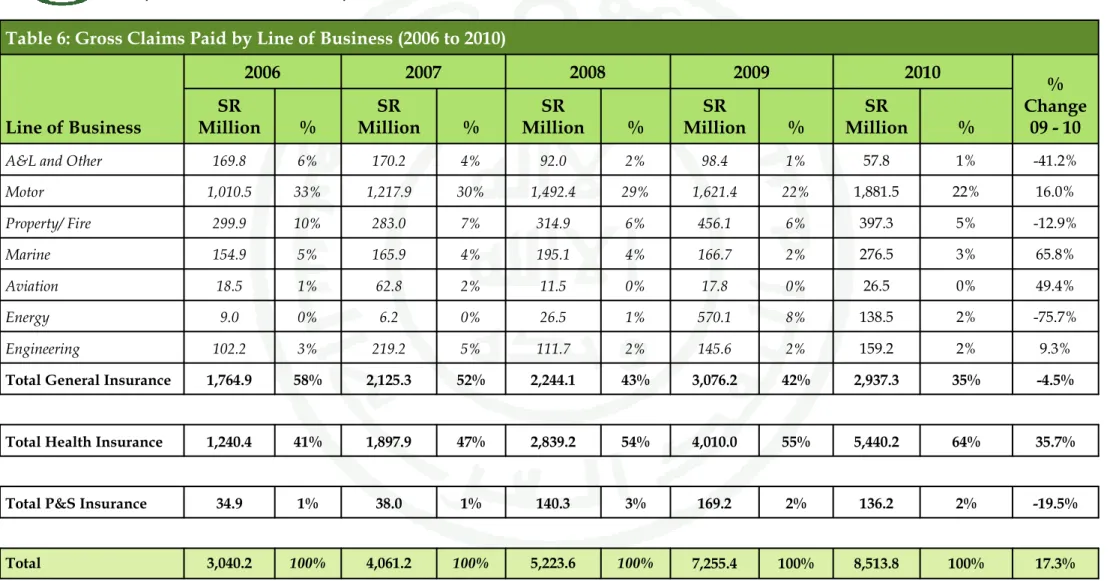
Total gross claims paid increased by 17% from SR 7.26 Billion in 2009 to SR 8.51 Billion in 2010
In 2010, Health and Motor gross claims paid grew by 36% and 16%, respectively compared to 2009 figures
In 2010, Marine
insurance recorded the highest growth rate in gross claims paid, after increasing by 66% from SR 167 Million to SR 276 Million
Table 6 in the appendix contains all the gross claims data by line of business from 2006 to 2010
Gross Claims Paid by Line of Business
Gross Claims Paid by Line of Business (2006 to 2010, SR Million)
1,011
1,218
1,492
1,621
1,882 570
92 +29%
2010 8,514
5,440 397 276 159
2009 7,255
4,010 167
2008 5,224
2,839 195 140
2007 4,061
1,898 166 170
2006 3,040
1,240 9
% Growth 2009–10
Total
Health Motor
Property/ Fire Marine
Engineering Energy P&S
A&L and Other Aviation
17%
49%
-41%
-19%
-76%
9%
66%
-13%
16%
36%
General and Health Net Earned Premiums vs. Net Claims Incurred
9,616 7,966
5,983 4,628
3,855
6,554 5,649
4,088 3,111
2,344
2009 2008
2007 2010
2006
+16%
+21%
NEP NCI
Net Earned Premiums Vs. Net Claims Incurred (2006 to 2010, SR Million)
Loss Ratio (% NEP) Net Earned Premiums
(NEP) is equal to NWP minus the change in net unearned premiums reserve
The insurance market’s General and Health NEP totaled SR 9.62 Billion in 2010, up from SR 7.97 Billion in 2009, which represents a 21% increase General and Health Net
Claims Incurred (NCI), i.e., the total of claims paid plus the change in outstanding and IBNR claims reserve, increased by 16% for the year 2010 to reach SR 6.55 Billion For 2010, General and
Health net claims ratio, i.e., the loss ratio, which is equal to NEP divided by NCI, decreased to reach 68.2%
68.2%
70.9%
68.3%
67.2%
60.8%
1,059
65
1,117 1,138
159 1,234
+7%
+144%
+10%
Net Result Investment Result
Underwriting Result
2009 2010
Insurance Market Profitability (2009-2010, SR Million)
Insurance Market ROA/ ROE (2010, % of total Assets/ Equity)
15.1%
4.7%
ROA ROE
Insurance underwriting result is the outcome of subtracting all insurance related expenses from insurance revenues (NEP)
The net result is equal to the sum of underwriting income, investment income, and other revenues minus other expenses1) In 2010, the insurance underwriting result totaled SR 1.23 Billion, which represents a 10% increase from 2009 figures
Investment income amounted to SR 159 Million in 2010 after recording SR 65 Million in 2009
The insurance market’s net result increased from SR 1.06 Billion in 2009 to SR 1.14 Billion in 2010, which represents a 7% increase Return on Assets (ROA) is the ratio of the
2010 net result to 2009 Total Assets. In 2010, insurance market’s ROA was 4.7%
Return on Equity (ROE) is the ratio of the 2010 net result to 2009 Total Equity. In 2010, Insurance market’s ROE was 15.1%
Market Profitability
2010
Balance Sheet - Policyholders’ Assets
At the end of 2010 insurance companies held SR 1.94 Billion in cash and cash
equivalents in their policyholders’ accounts Receivables accounted
for the biggest share of policyholders’ assets, with a value of SR 5.36 Billion
Total investments amounted to SR 5.25 Billion
Policyholders’
(operational) assets amounted to SR 18.84 Billion
615,655 467
615,188 Other Policyholders’ Assets
Total Insurance Protection and
Savings Insurance General and Health
Insurance Item Name
1,244 -
1,244 Investments in Subsidiaries and
Affiliates
18,842,955 2,271,423
16,571,532 Total Policyholders’ Assets [1]
2,537 -
2,537 Intangible Assets
466,711 910
465,801 Tangible Assets
2,080,884 1,904,582
176,302 Other*
9,861 -
9,861 Real Estate
210,835 -
210,835 Shares (common, preferred)
886,957 21,978
864,979 Debt, Securities and Fixed Income
9,489 9,489
- Loans
2,051,115 113,294
1,937,821 Deposits at Financial Institutions
5,250,385 2,049,343
3,201,042 Investments
366,082 268
365,814 Prepaid Expenses
477,290 2,340
474,950 Deferred Policy Acquisition Costs
4,360,526 33,987
4,326,538 Reinsurance Recoverable
5,364,629 111,073
5,253,556 Receivables, net
1,939,139 73,035
1,866,104 Cash and Cash Equivalents
Policyholders’ Assets (2010, SR Thousand)
* Other investments consists mainly of investments in funds related to saving products
Balance Sheet - Shareholders’ Assets
At the end of 2010, insurance companies’
shareholders held SR 1.96 Billion in cash and cash equivalents
Investments accounted for the biggest share of shareholders’ assets, with a value of SR 6.46 Billion
Shareholders’ assets amounted to SR 10.28 Billion
Insurance companies’
total assets amounted to SR 29.13 Billion
6,459,750 Investments
4,224,657 Deposits at Financial Institutions
1,550 Loans
1,188,957 Debt, Securities and Fixed Income
643,694 Shares (common, preferred)
- Real Estate
55,459 Investment in Subsidiaries and
Affiliates
345,433 Other
29,126,059 Total Assets [1] + [2]
625,019 Distributions due from Policyholders
Account
25,770 Accrued, Interest and Income
210,594 Other Shareholders’ Assets
Total Insurance Protection and
Savings Insurance General and Health
Insurance Item Name
10,283,104 Total Shareholders’ Assets [2]
758,313 Intangible Assets
102,815 Tangible Assets
141,621 Receivables, net
1,959,221 Cash and Cash Equivalents
Shareholders’ Assets (2010, SR Thousand)
Balance Sheet - Policyholders’ Liabilities and Equity
At the end of 2010, insurance companies held SR 11.92 Billion in technical reserves, which consist of unearned premiums, outstanding claims, IBNR and adjustment expense reserves
Mathematical reserves amounted to SR 1.54 Billion
Policyholders’ liabilities and equity amounted to SR 18.75 Billion
7,021,297 32,689
6,988,608 Unearned Premiums
18,210,515 1,794,238
16,416,277 Total Policyholders’ Liabilities
538,345 505,693
32,652 Accumulated Surplus
311,319 20,791
290,528 Other Policyholders’ Liabilities
4,895,049 50,235
4,844,814 Outstanding Claims, IBNR and
Adjustment Expense
625,019 43,958
581,061 Distributions due to Shareholders Account
1,267,923 11,821
1,256,102 Accrued Expense and Deferred Income
261,982 1,082
260,900 Unearned Reinsurance Commissions
2,691 391
2,300 Declared Dividends Payables
Total Insurance Protection and
Savings Insurance General and Health
Insurance Item Name
18,748,860 2,299,931
16,448,929 Total Policyholders’ Liabilities & Equity [3]
44,695 984
43,711 Other Reserves
1,543,022 1,543,022
- Mathematical Reserves
11,916,346 82,924
11,833,422 Technical reserves
1,705,711 40,888
1,664,823 Reinsurance Balances Payables
531,808 48,378
483,430 Policyholders’ Payables
Policyholders’ Liabilities And Equity (2010, SR Thousand)
Balance Sheet - Shareholders’ Liabilities and Equity
At the end of 2010, shareholders’ liabilities amounted to SR 1.26 Billion while
shareholders’ equity totaled SR 9.12 Billion Share capital constituted
the biggest share of shareholders’ equity with a value of SR 8.17 Billion
Shareholders’ liabilities and equity registered SR 10.38 Billion
Insurance companies’
total liabilities and equity amounted to SR 29.13 Billion
9,119,018 Total Shareholders Equity
133,008 Retained Earnings
29,126,059 Total Liabilities & Equity [3] + [4]
623,924 Statutory Reserves
439,171 Other Shareholders Liabilities
193,273 Other Shareholders’ Equity
Total Insurance Protection and
Savings Insurance General and Health
Insurance Item Name
10,377,198 Total Shareholders Liabilities & Equity [4]
8,168,814 Share Capital
1,258,180 Total Shareholders Liabilities
54,085 Accrued Expenses and Deferred Income
251,343 Zakat
513,581 Shareholders’ Payables
Shareholders’ Liabilities And Equity (2010, SR Thousand)
Insurance Market Performance - By Line of Business
Insurance Market Performance - By Line of Business
Health Insurance
8,690
7,120
6,210
4,443
Health
NCI NEP NWP GWP
66%
61%
60%
53%
% Total
Retention Ratio Loss Ratio
81.9% 71.5%
Health Insurance Performance (2010, SR Million)
Health insurance, which includes both compulsory and non-compulsory lines, accounted for 53% of the 2010 total market GWP with SR 8.69 Billion in underwritten premiums
Health insurance accounted for 60% of the market’s NWP as insurance companies retained SR 7.12 Billion of their Health insurance GWP, which represents a 81.9%
retention ratio
Health insurance’s NEP registered SR 6.21 Billion Health insurance’s NCI amounted to SR 4.44 Billion,
which translates into a 71.5% loss ratio for the year 2010
Retention ratio and loss ratio are not shown due to the savings part of the premium which distorts the ratios
Protection and Savings Insurance
972
877
501
159
P&S
NCI NEP NWP GWP
2%
5%
7%
6%
% Total
Protection and Savings Insurance Performance
(2010, SR Million) Protection and Savings insurance’s GWP totaled SR 972
Million in 2010, which represents a 6% contribution to the market’s total business volume
Protection and Savings insurance accounted for 7% of the market’s NWP as insurance companies retained SR 877 Million of GWP
Protection and Savings insurance’s NEP registered SR 501 Million, which represents a share of 5% of total NEP Protection and Savings insurance’s NCI amounted to SR
159 Million
Motor Insurance
3,239
3,099
2,822
1,892
Motor
NCI NEP NWP GWP
28%
30%
26%
20%
% Total
Retention Ratio Loss Ratio
95.7% 67.1%
Motor Insurance Performance (2010, SR Million)
Motor insurance’s GWP totaled SR 3.24 Billion in 2010, which represents a 20% share of total market GWP Motor insurance’s retention ratio of 95.7% was the highest of all business lines. Motor insurance NWP totaled SR 3.10 Billion
Motor insurance’s NEP amounted to SR 2.82 Billion and accounted for 30% of the insurance market’s NEP
Insurance companies recorded SR 1.89 Billion in Motor insurance’s NCI which resulted into a 67.1% loss ratio
Property/ Fire Insurance
959
127 95
50 Property/ Fire
GWP NWP NEP
NCI 1%
1%
1%
6%
% Total
Retention Ratio Loss Ratio
13.2% 52.6%
Property/ Fire Insurance Performance (2010, SR Million)
Property/ Fire insurance’s GWP totaled SR 959 Million in 2010, which represents a 6% share of total market GWP
Insurance companies retained only 13.2% of their Property/ Fire insurance premiums as the business line’s NWP amounted to 127 Million. Property/ Fire insurance contributed 1% to total market NWP in 2010 Property/ Fire insurance’s NEP registered SR 95 Million Insurance companies recorded SR 50 Million in
Property/ Fire insurance’s NCI which translates into a 52.6% loss ratio
Engineering Insurance
869
114 105
40 Engineering
NCI NEP NWP GWP
1%
1%
1%
5%
% Total
Retention Ratio Loss Ratio
13.1% 38.5%
Engineering Insurance Performance (2010, SR Million)
Engineering insurance’s GWP totaled SR 869 Million in 2010, a 5% contribution to total market GWP
Insurance companies retained 13.1% of their Engineering underwritten premiums. Engineering insurance NWP registered SR 114 Million
Engineering insurance NEP amounted to SR 105 Million and accounted for 1% of the insurance market’s NEP Engineering insurance recorded a loss ratio of 38.5%,
with NCI, totaling SR 40 Million
A&L and Other* Insurance
507
276
207
38 A&L and Other
NCI NEP NWP GWP
1%
2%
2%
3%
% Total
Retention Ratio Loss Ratio
54.4% 18.5%
A&L and Other Performance (2010, SR Million) Accident and Liability (A&L) insurance includes the
following lines of business: personal accident, work related, employer’s liability, third party liability, general liability, product liability, medical liability, professional liability, theft & burglary, safe burglary, fidelity and any other liability
Insurance companies underwrote SR 507 Million in A&L and Other general insurance premiums
Insurance companies retained SR 276 Million of A&L and Other general insurance underwritten premiums, a 54.4% retention ratio
A&L and Other general insurance NEP totaled SR 207 Million, which represents a 2% contribution to total NEP Insurance companies recorded SR 38 Million in A&L and
Other general insurance’s NCI which translates into a 18.5% loss ratio
* Other insurance refers to all other business lines in general insurance
Marine Insurance
518
175 161
86
Marine
NCI NEP NWP GWP
1%
2%
2%
3%
% Total
Retention Ratio Loss Ratio
33.8% 53.9%
Marine Insurance Performance (2010, SR Million)
The Marine insurance line of business includes both marine cargo and marine hull insurance
Marine insurance GWP totaled SR 518 Million in 2010, which represents a 3% contribution to total market GWP Insurance companies retained 33.8% of their Marine
insurance underwritten premiums as the business line’s NWP amounted to SR 175 Million
Marine insurance’s NEP recorded SR 161 Million, which represents a 2% share of total NEP for 2010
Marine insurance’s NCI amounted to SR 86 Million. This resulted in a loss ratio of 53.9%
Energy Insurance
329
8 12 2
Energy
NEP NWP
NCI GWP
0.02%
0.1%
2%
2%
% Total
Retention Ratio Loss Ratio
2.3% 13.9%
Energy Insurance Performance (2010, SR Million)
In 2010, Energy insurance GWP totaled SR 329 Million, which represents a 2% share of total market GWP Insurance companies ceded 97.7% of their Energy
insurance underwritten premiums. Energy insurance NWP amounted to SR 8 Million
Energy insurance’s NEP amounted to SR 12 Million, accounting for only 0.1% of the insurance market’s NEP Finally, Energy insurance’s NCI amounted to SR 2
Million resulting in a loss ratio of 13.9% for 2010
Aviation Insurance
305
5 4 1
Aviation
NCI NEP NWP GWP
0.02%
0.04%
0.04%
2%
% Total
Retention Ratio Loss Ratio
1.6% 35.8%
Aviation Insurance Performance (2010, SR Million)
Aviation insurance GWP reached SR 305 Million in 2010, a 2% contribution to total market GWP
NWP for Aviation insurance reached SR 5 Million resulting in a retention ratio of 1.6%
Aviation insurance’s NEP totaled SR 4 Million Finally, Aviation insurance’s NCI amounted to SR 1
Million resulting in a loss ratio of 35.8% for 2010
Other Market Indicators
Other Market Indicators
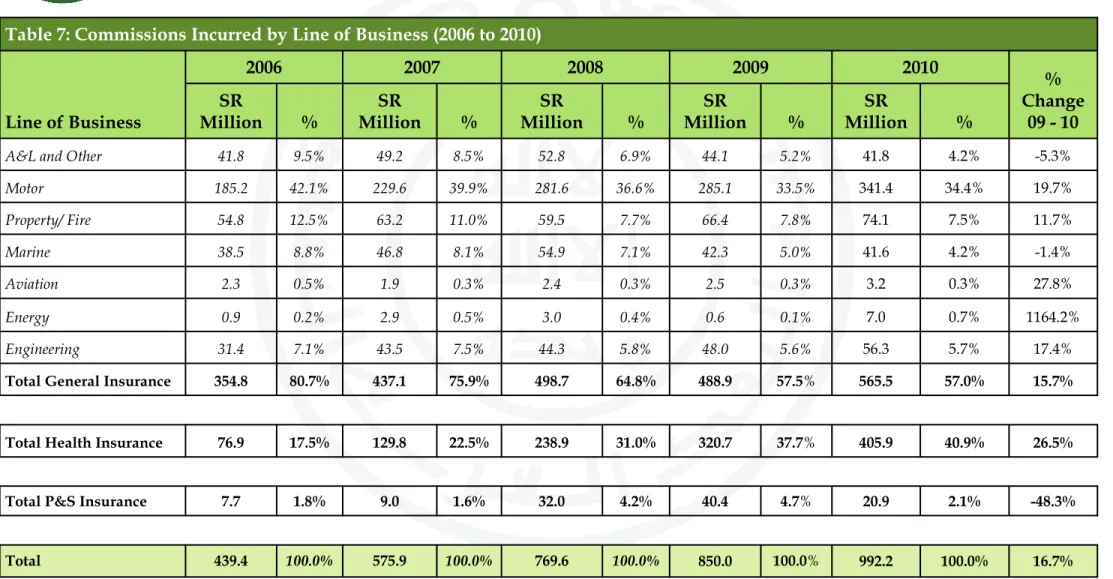
Commissions Incurred by Line of Business
Commissions Incurred by Line of Business (2006 to 2010, SR Million)
Total commissions incurred amounted to SR 992 Million in 2010, compared to SR 850 Million in 2009, which represents an increase of 17%
General insurance related commissions accounted for 57% of total commissions incurred in 2010 Health insurance’s
share of total
commissions incurred represented 41% in 2010
Protection and Savings insurance’s
commissions incurred decreased by 48% in 2010 and amounted to 2% of total
commissions incurred
185
230
282
341
63
66
74
285 60
55
56
53 49
55
7
321 421 4440
239
48
2008 770
44
428 39 439
42
77
406 850
2009
21
2010
+23% 42
31
992
130
32
43 47 9
2006 2007
576
% Growth 2009–10
28%
-48%
17%
1164%
-1%
-5%
12%
20%
26%
P&S Marine Engineering A&L and Other Energy
Aviation
Health Motor
Property/ Fire
41%
34%
7%
6%
4%
4%
2%
0.7%
0.3%
% Total
Total 17% 100%
The total number of insurance companies’ employees in Saudi Arabia reached 7,081 in 2010, up from 5,800 in 2009 Saudi nationals employed by insurance companies account
for 50% of the total workforce, an increase of 3 percentage points from 2009 figures
In 2010, the Saudization ratio for non-managerial positions increased to 53% up form 52% in 2009, while the
Saudization ratio for managerial positions increased to 33%
up form 26% in 2009
Note: Newly licensed insurance companies are required to adhere to a Saudization ratio of 30% during the first year of operations (as per Article 79 of the Implementing
Regulations)
Employees Breakdown by Nationality
Number of Employees vs. Saudization Ratio (2010)
Nationality
No. of Managerial Employees
Total No. of Employees No. of Non–
managerial Employees
2009 2010 2009 2010 2009 2010
Other Arab Other Non–
Arab Saudi
Saudization Ratio Total
1,221 1,273 361 314 1,582 1587
1,083 1,606 382 336 1,465 1942
2,488 3,225 265 327 2,753 3552
52% 53% 26% 33% 47% 50%
4,792 6,104 1,008 977 5,800 7,081 0
50 100 150 200 250 300 350 400 450 500 550 600 650 700
0 5 10 15 20 25 30 35 40 45 50 55 60 65 70 75 80 85 90 95 Saudization Ratio
Number of Employees
Minimum Saudization ratio
Insurance Market Structure
In 2010, the top 8 insurance companies generated 71.1%
of the insurance market’s GWP, an increase from 67.6% in 2009
The remaining 26 insurance companies included in the report accounted for the
remaining 28.9% of total market premiums
Gross Written Premiums by Company (2008 to 2010, SR Million)
4,034 350
370 405 424
641 941
1,406
2,349
4,736 381
389 490 500
881
1,347 1,849
4,035
4,742 523
553 565 600
851
1,749
2,623
4,181
0 500 1,000 1,500 2,000 2,500 3,000 3,500 4,000 4,500 5,000 2008 2009 2010 Remaining
26 companies
Market Share
71.1%
2008 2009 2010
Company 8 Company 7 Company 6 Company 5 Company 4 Company 3 Company 2 Company 1
21.5% 27.6% 25.5%
12.9% 12.7% 16.0%
8.6% 9.2% 10.7%
5.9% 6.0% 5.2%
3.9% 3.4% 3.7%
3.7% 3.4% 3.4%
3.4% 2.7% 3.4%
3.2% 2.6% 3.2%
36.9% 32.4% 28.9%
Capitalization of Insurance Companies
Insurance companies’ equity increased form SR 7.5 Billion at the end of 2009 up to SR 9.1 Billion at the end of 2010, with 23 companies exceeding SR 100 Million
The largest company by total equity is
Tawuniya, with total equity of SR 1.76 Billion at the end of 2010 following an increase from SR 1.4 Billion at the end of 2009
Note: the Law on Supervision of Cooperative Insurance Companies stipulates a minimum capital of SR 100 Million for insurance
companies and SR 200 Million for companies that will undertake insurance and reinsurance activities
Insurance Companies’ Equity vs. NWP (2010, SR Million)
NWP
700 600 500 400 3,000
300 2,900
200 1,900 1,800 1,700
100 0
Equity 400 300
200 1,000 1,800
100 0
Number of Companies Shareholders’ Equity (2010)
Up to SR 50 Million 7
SR 50 M to SR 100 Million 5
SR 100 M to SR 150 Million 3
SR 150 M to SR 200 Million 7
SR 200 M to SR 500 Million 9
More that SR 500 Million 3
Appendix: Data Tables
Appendix: Data Tables
Table 1: Gross Written Premiums by Line of Business (2006 to 2010)
Table 1: Gross Written Premiums by Line of Business (2006 to 2010)
14,610.1 1,002.8 7,292.0 6,315.3 810.3 301.7 174.1 525.0 904.9 3,055.4
543.7
SR Million
2009
100.0%
6.9%
49.9%
43.2%
5.5%
2.1%
1.2%
3.6%
6.2%
20.9%
3.7%
%
100.0%
5.9%
53.0%
41.0%
5.3%
2.0%
1.9%
3.2%
5.9%
19.8%
3.1%
%
16,387.4 972.2 8,690.1 6,725.1 869.2 328.9 304.5 518.2 958.7 3,238.8
506.8
SR Million
2010
12.2%
100.0%
10,918.9 100.0%
8,582.7 100.0%
6,937.3 Total
-3.1%
5.4%
593.7 3.8%
327.0 3.1%
217.9 Total P&S Insurance
19.2%
44.0%
4,805.2 35.7%
3,065.0 32.0%
2,222.2 Total Health Insurance
6.5%
50.6%
5,520.1 60.5%
5,190.7 64.8%
4,497.1 Total General Insurance
7.3%
6.2%
682.1 5.6%
479.7 7.8%
543.7 Engineering
1.9% 9.0%
208.2 3.6%
305.3 1.8%
126.7 Energy
74.9%
1.3%
138.5 1.3%
114.5 1.8%
126.1 Aviation
-1.3%
5.7%
619.6 6.2%
531.6 6.2%
431.4 Marine
5.9%
7.3%
798.4 8.6%
742.2 11.1%
769.2 Property/ Fire
6.0%
23.3%
2,542.1 28.4%
2,440.2 27.7%
1,920.2 Motor
-6.8%
4.9%
531.3 6.7%
577.3 8.4%
579.6 A&L and Other
% SR
Million
% SR
Million
% SR
Million
% Change
09 - 10 2008
2007 2006
Line of Business
Tables 2 & 3: Insurance Penetration and Density (2006 to 2010)
Tables 2: Insurance Penetration (2006 to 2010)
Tables 3: Insurance Density (2006 to 2010)
575.8 39.5 287.4 248.9 SR 2009 1.06%
0.07%
0.53%
0.46%
% 2009
603.9 4.9%
440.1 357.9
292.9 Total
-9.4%
35.8 23.9
13.6 9.2
Total P&S Insurance
11.4%
320.2 193.7
127.8 93.8
Total Health Insurance
-0.4%
247.8 222.5
216.5 189.9
Total General Insurance
SR SR
SR SR
% Change 09 - 10 2010
2008 2007
2006 Line of Business
-5.4%
1.00%
0.62%
0.61%
0.53%
Total
-18.3%
0.06%
0.03%
0.02%
0.02%
Total P&S Insurance
0.5%
0.53%
0.27%
0.22%
0.17%
Total Health Insurance
-10.2%
0.41%
0.31%
0.37%
0.34%
Total General Insurance
%
%
%
%
% Change 09 - 10 2010
2008 2007
2006 Line of Business
Table 4: Net Written Premiums by Line of Business (2006 to 2010)
Table 4: Net Written Premiums by Line of Business (2006 to 2010)
10,073.2 908.0 5,556.9 3,608.4 125.3
5.2 1.1 183.2 105.1 2,944.1
244.3
SR Million
2009
100.0%
9.0%
55.2%
35.8%
1.2%
0.1%
0.01%
1.8%
1.0%
29.2%
2.4%
%
100.0%
7.4%
60.3%
32.2%
1.0%
0.1%
0.04%
1.5%
1.1%
26.3%
2.3%
%
11,799.7 876.8 7,120.0 3,802.9 113.9
7.6 4.8 175.4 126.5 3,098.8
275.9
SR Million
2010
17.1%
100.0%
7,320.6 100.0%
5,543.8 100.0%
4,346.9 Total
-3.4%
6.4%
468.2 4.8%
266.8 3.5%
153.2 Total P&S Insurance
28.1%
51.2%
3,750.9 43.3%
2,403.1 42.4%
1,842.5 Total Health Insurance
5.4%
42.4%
3,101.6 51.8%
2,873.9 54.1%
2,351.2 Total General Insurance
-9.1%
1.7%
122.2 1.8%
97.6 1.9%
84.2 Engineering
46.0%
0.0%
0.9 0.0%
2.4 0.0%
0.0 Energy
341.6%
0.1%
5.5 0.1%
3.6 0.1%
4.3 Aviation
-4.3%
2.8%
201.5 3.1%
169.8 2.9%
124.4 Marine
20.3%
1.3%
95.4 1.5%
84.1 1.9%
Property/ Fire 80.8
5.3%
33.6%
2,458.7 41.4%
2,297.3 41.7%
1,814.1 Motor
12.9%
3.0%
217.3 4.0%
219.2 5.6%
243.4 A&L and Other
% SR
Million
% SR
Million
% SR
Million
% Change
09 - 10 2008
2007 2006
Line of Business
Table 5: Retention Ratio by Line of Business (2006 to 2010)
Retention ratios are not shown for Protection & Savings in this table as the savings element of the contract must be retained in the Saudi Arabian company, so retentions are not directly comparable with other insurance contracts.
Table 5: Retention Ratio by Line of Business (2006 to 2010)%
56.5%
13.1%
2.3%
1.6%
33.8%
13.2%
95.7%
54.4%
67.4%
76.2%
% 2009
5.2%
70.9%
66.4%
63.9%
62.4%
Total
7.5%
81.9%
78.1%
78.4%
82.9%
Total Health Insurance
-1.0%
57.1%
56.2%
55.4%
52.3%
Total General Insurance
-15.3%
15.5%
17.9%
20.3%
15.5%
Engineering
33.9%
1.7%
0.4%
0.8%
0.0%
Energy
152.5%
0.6%
4.0%
3.1%
2.9%
Aviation
-3.0%
34.9%
32.5%
31.9%
28.8%
Marine
13.6%
11.6%
11.9%
11.3%
10.5%
Property/ Fire
-0.7%
96.4%
96.7%
94.1%
94.5%
Motor
21.2%
44.9%
40.9%
38.0%
42.0%
A&L and Other
%
%
%
%
% Change 09 - 10 2010
2008 2007
2006 Line of Business
Table 6: Gross Claims Paid by Line of Business (2006 to 2010)
2010 2009
2008 2007
2006 Line of Business
Table 6: Gross Claims Paid by Line of Business (2006 to 2010)
% Change
09 - 10
% SR
Million
% SR
Million
% SR
Million
% SR
Million
% SR
Million
100%
2%
55%
42%
2%
8%
0%
2%
6%
22%
1%
7,255.4 169.2 4,010.0 3,076.2 145.6 570.1 17.8 166.7 456.1 1,621.4
98.4
17.3%
100%
8,513.8 5,223.6 100%
4,061.2 100%
3,040.2 100%
Total
-19.5%
2%
136.2 3%
140.3 1%
38.0 1%
34.9 Total P&S Insurance
35.7%
64%
5,440.2 54%
2,839.2 47%
1,897.9 41%
1,240.4 Total Health Insurance
-4.5%
35%
2,937.3 43%
2,244.1 52%
2,125.3 58%
1,764.9 Total General Insurance
9.3%
2%
159.2 2%
111.7 5%
219.2 3%
102.2 Engineering
-75.7%
2%
138.5 1%
26.5 0%
6.2 0%
9.0 Energy
49.4%
0%
26.5 0%
11.5 2%
62.8 1%
18.5 Aviation
65.8%
3%
276.5 4%
195.1 4%
165.9 5%
154.9 Marine
-12.9%
5%
397.3 6%
314.9 7%
283.0 10%
299.9 Property/ Fire
16.0%
22%
1,881.5 29%
1,492.4 30%
1,217.9 33%
1,010.5 Motor
-41.2%
1%
57.8 2%
92.0 4%
170.2 6%
169.8 A&L and Other