The rights of the editor(s) and author(s) have been asserted under the Copyright, Designs and Patents Act 1988. Inquiries regarding the use of the book should be addressed to the Rights and Permissions Department of INTECHOPEN LIMITED ([email protected]). Statements and opinions expressed in the chapters are the property of the individual authors and not necessarily the editors or publishers.
The publisher accepts no responsibility for any damage or injury to persons or property resulting from the use of any materials, instructions, methods or ideas contained in the book. Additional information is available at the end of the chapter http://dx.doi.org/10.5772/intechopen.79777. This chapter is distributed under the terms of the Creative Commons Attribution License (http://creativecommons.org/licenses/by/3.0), which permits unrestricted use, distribution, and electronic production in any medium, provided the original work is properly cited.
This chapter is distributed under the terms of the Creative Commons Attribution License (http://creativecommons.org/licenses/by/3.0), which permits unrestricted use, distribution, and reproduction in any medium, provided the original work is properly cited.
Introductory Chapter: MATLAB Applications in Power System
- Introduction
- Summary of second chapter
- Summary of third chapter
- Summary of forth chapter
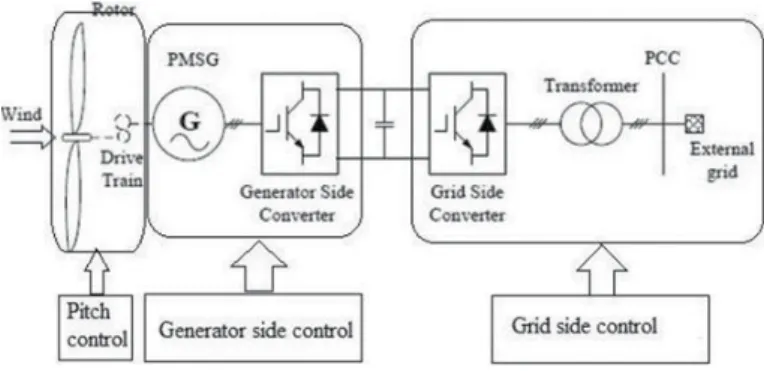
A harmonic distribution network was modeled and then the harmonic impedance was determined in different operating conditions using MATLAB Simulink. To validate the method, the results obtained have been compared with the values obtained by simulation after the connection of the capacitor bank to the network. The chapter has proven that the network harmonic impedance is a useful tool to estimate the harmonic gain caused by power factor correction using shunt capacitor banks. The stated goals are followed by Chapter 3, where Anbarasi Jebaselvi and Meenakshi present modelling, simulation and analysis of permanent magnet synchronous generator (PMSG) based wind energy conversion systems for both open- and closed-loop control strategy[8,9]. Since the choice of a wind turbine generator and its optimum power can be achieved by closely matching the load and power lines[10], maximum power from wind using PMSG has been made possible by using intelligent controllers, namely fuzzylogic controllers. Since PMSG suffers from a strong magnetic field decay, which causes the voltage generated at their stator terminals to drop dramatically when under load, it is therefore not very suitable for isolated operation and therefore the whole analysis has been carried out with a mains connected network.
MATLAB Simulink was used to simulate and analyze the PMSG-based wind energy conversion systems for both- and closed-loop control strategies [11]. First, the FEM model was used to develop the equation of motion of the power line conductor. The results of the MATLAB simulation, finite element and experimental surveys were compared to determine the accuracy of the models and evaluate the effectiveness of models simulated in MATLAB and developed using the FEM.
1] SaghafiniaA, PingHW, UddinMN, AmindoustA. Teaching simulation and variable speed drive of induction motor using MATLAB/Simulink in advanced electrical machine laboratory. Prosedia-SociallandBehavioral Sciences.
MatLab Simulink Modeling for Network-Harmonic Impedance Assessment: Useful Tool to Estimate
- Amplifying harmonic conditions assessment
- Simulation results, discussions
- MatLab implementation of the proposed model
- Conclusions
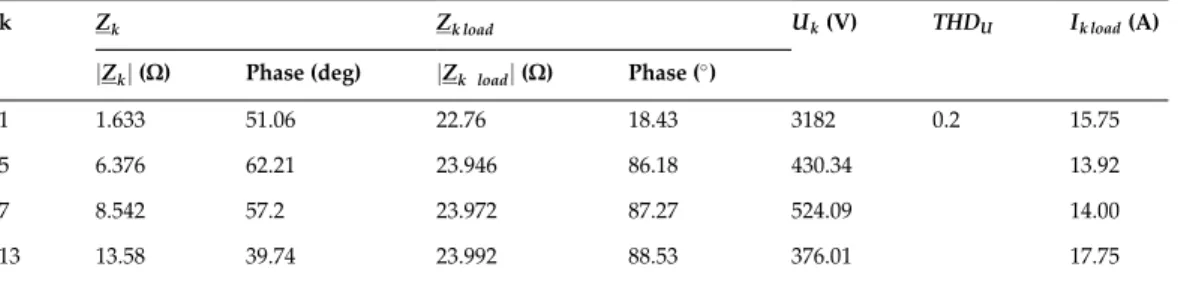
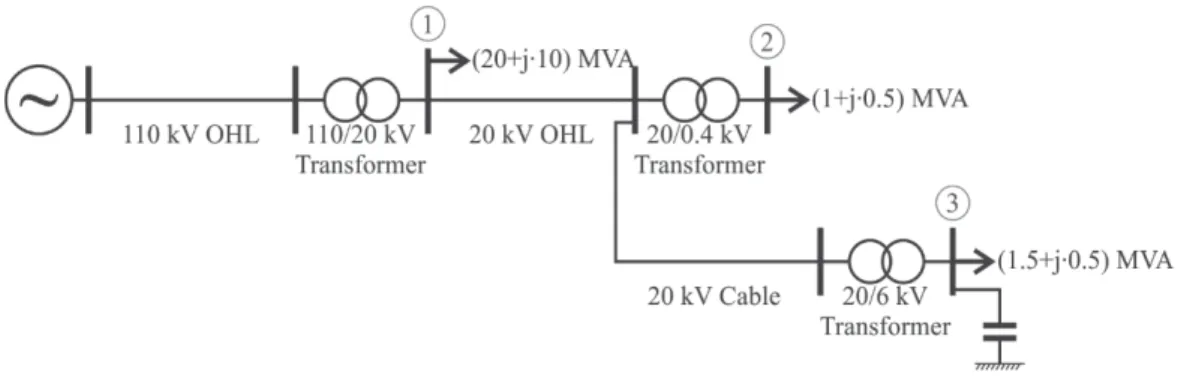
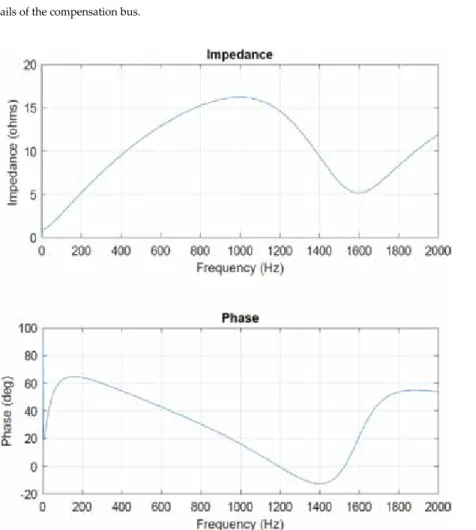
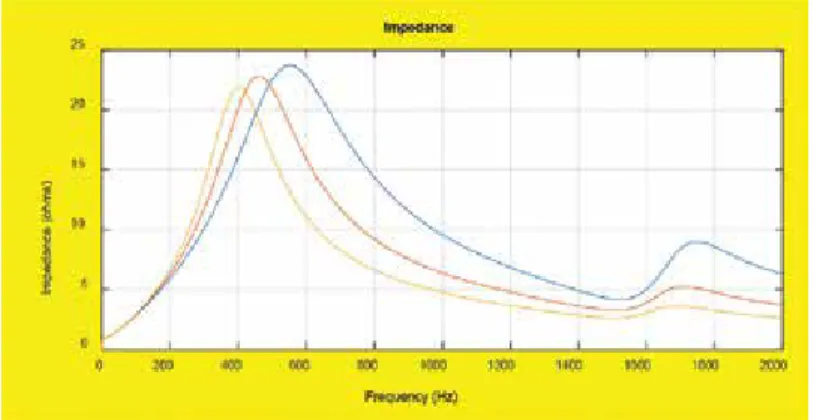
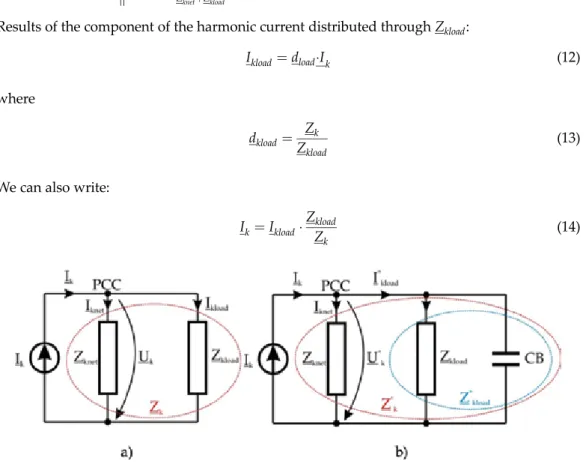
Because the harmonic impedance determined using the expression (1) is parallel impedance, to obtain the phase of the impedance, we need to transform the parallel scheme to series scheme. Changing a shunt capacitor bank to improve the power factor of a bus in a distribution network containing harmonics can result in amplification of the harmonic conditions. This is only possible when the harmonic currents flow in the network, with frequencies close to the parallel resonant frequency. To estimate the changes regarding the harmonic conditions of a bus in a network, due to the installation of transverse impedance, it meant determining the new harmonic voltages and harmonic currents using the initial state of the network.
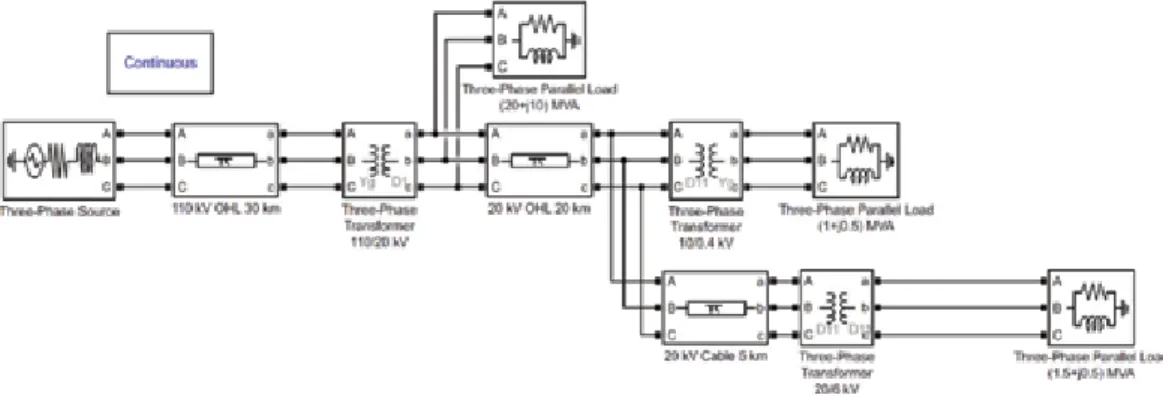
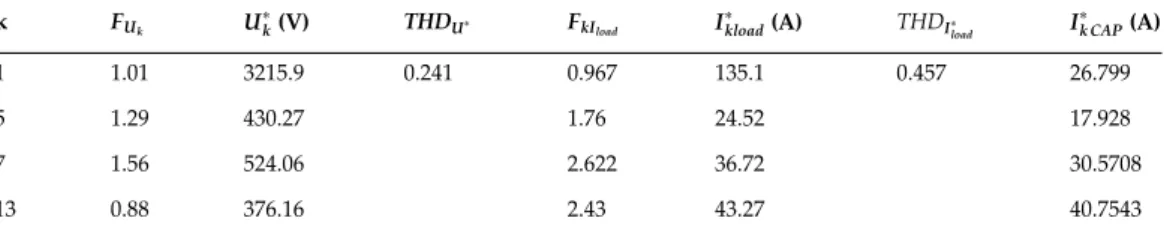
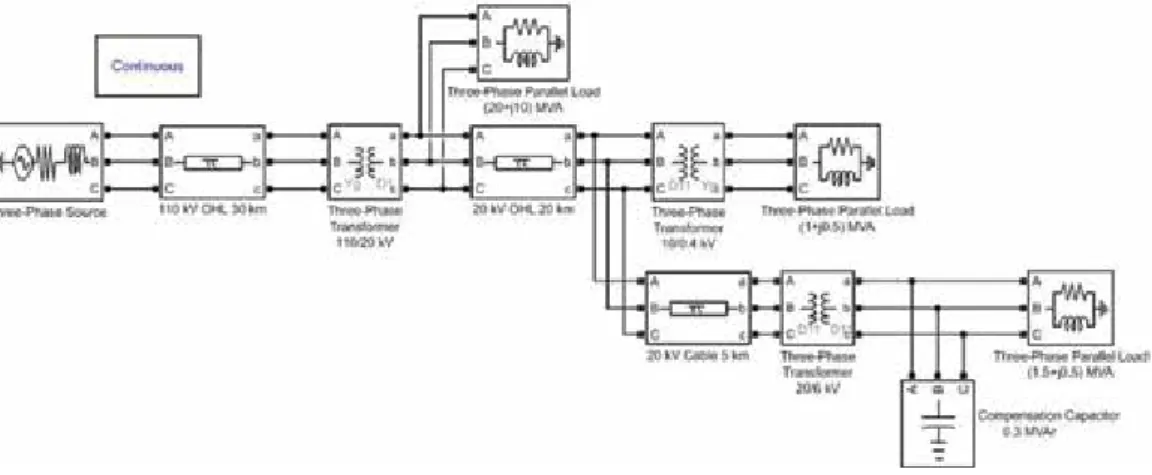
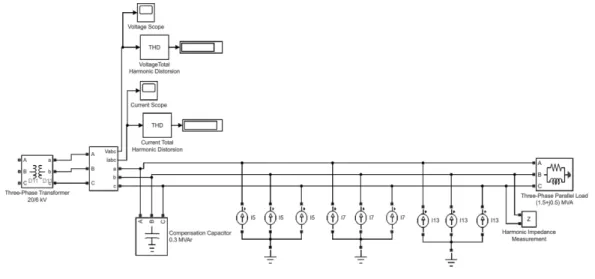
The quantities obtained by MatLab simulation before the installation of the CB are presented in Table 1. The symbol represents the equivalent impedance of the linear component of the load. A three-phase two-winding transformer model is used for all transformers in the network. The harmonic impedance of the network is measured using a dedicated block called "Impedance Measurement", which measures the impedance in the network bus as a function of frequency (harmonic impedance).
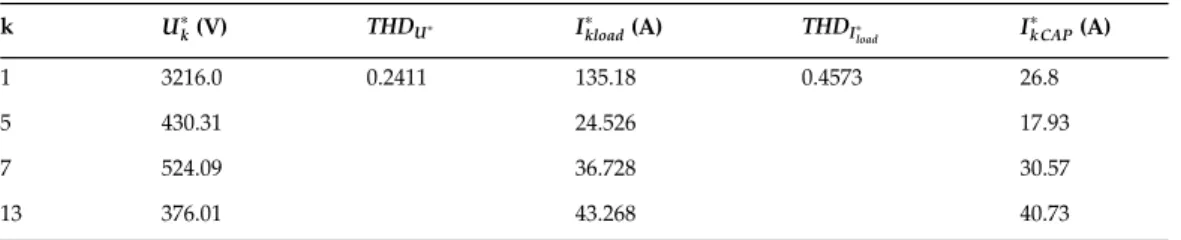
To emphasize the influence of capacitor reactive power amounts on harmonic impedance values, the following compensation steps are considered: 0.2, 0.3, and 0.4 MVAr. Switching capacitor banks leads to a gain in harmonic impedance for the frequencies close to the resonant frequency. We see good proximity between the results obtained by calculus and by simulation, with MatLab Simulink being a useful tool for energy engineering research and education.
Dynamic Modeling for Open- and Closed-loop Control of PMSG based WECS with Fuzzy Logic Controllers
- Modeling and simulation of PMSG-based WECS
- Open-loop control of PMSG-based WECS with SVM
- Closed-loop control of PMSG-based WECS with fuzzy logic controller
- Conclusion
Dynamic modeling for open-loop and closed-loop control of PMSG-based WECS with fuzzy logic controllers. Maximum power is achieved using the SVPWM modulation technique with the DC link voltage maintained at a stable level to obtain separate control of active and reactive power. The DC voltage utilization ratio is around 71% of DC voltage compared to conventional sine pulse width modulation which was found to be 61.2%. form compared to sinusoidal PWM [25]. The harmonic spectrum for load voltage and load currents with soft logic is 0.47 and 35.72%, respectively. The simulation results and the harmonic spectrum obtained in [28] show that the soft controller performs very well and exhibits very good dynamic and stable performance. The research contributions of this technical paper [29] deal with the development of a single-sided primary inductor converter. A ter (SEPIC)-based FLC-WECS that can maintain a constant output voltage with minimal ripple content and improve dynamic response using fuzzy logic controller.
Here, this chapter discusses open-loop as well as closed-loop method with intelligent controller and it is confirmed that sufficient earnings could be generated by implementing the same real-time with very little computation. The following sections deal with details of modeling of PMSG-based WECS with its simulation, open-loop and closed-loop control exceeding the control by resp. in addition to meeting the load requirements, it also delivers the battery load. The speed control is realized through field orientation, where the q-axis current is used to control the rotation speed of the generator in relation to the varying wind speed. SVM-based grid-side inverter has been implemented to keep the inverter voltage constant regardless of the wind speed variations.
Two fuzzy logic controllers (FLCs) are used to control the duty cycle ratio of boost converters located near the stator side of the PMSG. The first fuzzy controller is used to MPPT by varying the duty cycle of the first boost converter, thereby increasing the stator voltage of the generator. The duty cycle of the boost converters is changed so that the Ton and Toff periods can either increase or decrease. Membership functions used in FIS by the first FLC. a) Mamdani-based FIS editor of the first FLC, (b) velocity error input variable, (c) velocity error derivative input variable, and (d) output variable, duty cycle 1.
When the actual speed reaches 1500 rpm, the speed error is Negative Small (NS), the error derivative is "Negative", the duty cycle of the first boost converter should be "Positive" (P). As in Figure 7a, the two inputs used in the second FIS editor are change in power and state of charge (SoC) of the battery. Three outputs considered are the duty cycle of the second boost converter, the position of switch S1, and the position of switch S2. The position of switch S1 determines whether the connector should disconnect the battery from the system based on the state of the battery and the amount of excess power generated.
For example, if the change in power is "Negative" and SoC of the battery is "dead", then the duty cycle of the second boost converter is "VB" (Ton period is large and Toff is small), the. Positive Large', the duty cycle of the second inverter, the position of switch S1, and the position of switch S2 as 'open' or 'closed' and varied accordingly. If the change in power is "negative" and the battery SoC is "dead", then the duty cycle of the second inverter should be "Very Big" (VB). If the change in power is "negative" and the SoC of the battery is "average", then the duty cycle of the second inverter should be "VB".
Steady-state and transient characteristics of PMSG closed-loop control mode with fuzziological controller through which the most important parameters are obtained, shown in Figure 8 from (a–f).
High Voltage Transmission Line Vibration: Using MATLAB to Implement the Finite Element Model of a
High Voltage Transmission Line Vibration: Using MATLAB to Implement the Finite Element Model of a
- Transmission line equation of motion (EOM)
- Solution to the EOM
- Free vibration of power conductor
- Forced vibration of power conductor
- Conductor self-damping and dampers
- FEM MATLAB model setup, formulation and implementation
- FEM MATLAB model implementation strategy
- Experimental investigation of conductor vibration
- Simulation and experimental results
- Conclusion
High voltage transmission lines and network can experience vulnerabilities such as vibration, electromagnetic transient, fatigue, transmission loss, switching surges, conductor drop fluctuations[30,31]. When the conductor experiences vibration, transmission lines experience high amplitudes from wind forces and vibrations [1]. The sections in the chapter discussed the development of the transmission line equation of motion, solution of the equation of motion, free and forced vibration of the transmission line, dampers and self-damping of the conductor, FEM MATLAB setup and implementation, simulation of FEM models. Results from MATLAB simulations from finite element models and experimental results were compared to determine the accuracy of the models.
The distributed load on the conductor is replaced by effective point load that can effectively have the same resultant effect as the actual distributed load. The derived solution has an infinite number of solutions, and the solution is indexed to accommodate all the possible solutions from the model. The indexed solution is expressed in Eq. The actual system representation through system simulation strategy considers a case of distributed load through the span of the conductor.
T tð Þ ¼Ae tsin ωdtþϕ þXcosðωt�θÞ (44) The natural frequency of the current conductor under forced vibration is expressed in Eq. The FEM model allows the analysis of the dynamic behavior and response of high voltage conductors to the dynamic wind forces [33]. Where θx denotes the rotation of the power line due to the bending effect, R denotes the radius of rotation, y denotes the distance from the axis of rotation to the center axis of the conductor or transverse displacement, v denotes a rodential displacement and du xð Þ denotes the axial displacement of the power lines.
Where A represents the cross-sectional area of the power line, E represents the young modulus of the power line material, I represents the polar moment of an orbit, T represents the kinetic energy of the system. To test the validity of the previously discussed models using MATLAB, a steel-core aluminum current conductor with an overall diameter of 35.56 mm and an ultimate tensile strength of 51.51 kN was used in the setup of the MATLAB simulation. MATLAB code was written for the FEM and used to model the dynamic analysis of the conductor vibration problem.
The results were compared in terms of natural frequency of vibration or vertical displacement of the power conductor. The results showed that the implementation of the derived models in MATLAB provided a reliable strategy in determining wind-induced high dynamic properties. MATLAB as an environment can be used as a reliable simulation tool to implement and analyze high voltage conductor dynamics. The parameters obtained from the results, up to a degree of accuracy, can be used to predict the response of the conductors due to aeolian vibrations caused by the wind load.
Vibration level analyzes of an OPGWatcatenary value of 2100 m with multi-response Stockbridge dampers.