1
CITY OF JOHANNESBURG
MEDIUM-TERM BUDGET 2018/19 TO 2020/21
MAY 2018
2
Table of Contents Page No
PART1- ANNUAL BUDGET
1.1. EXECUTIVE SUMMARY 9
1.2. OPERATING BUDGET FRAMEWORK 9
1.3. CAPITAL EXPENDITURE 16
1.4. ANNUAL BUDGET TABLES 17
1.5. TARIFF SETTING 41
1.6. COUNCIL RESOLUTIONS 67
PART 2- SUPPORTING DOCUMENTATION
2.1. OVERVIEW OF ANNUAL BUDGET PROCESS 69
2.2. OVERVIEW OF ALIGNMENT OF ANNUAL BUDGET WITH IDP 72
2.3. MEASURABLE PERFORMANCE OBJECTIVES AND INDICATORS 79
2.4. BUDGET RELATED POLICIES 98
2.5. OVERVIEW OF BUDGET ASSUMPTIONS 101
2.6. OVERVIEW OF BUDGET FUNDING 104
2.7. EXPENDITURE ON GRANTS 116
2.8. MONTHLY TARGETS FOR REVENUE, EXPENDITURE AND CASH FLOW 117
2.9. LEGISLATION COMPLIANCE STATUS 123
2.10. OTHER SUPPORTING DOCUMENTS 125
2.11. MEDIUM TERM BUDGET PER CLUSTER, DEPARTMENT AND MUNICIPAL ENTITY 136
3
List of Tables
No Description
Table A1 Consolidated Budget Summary
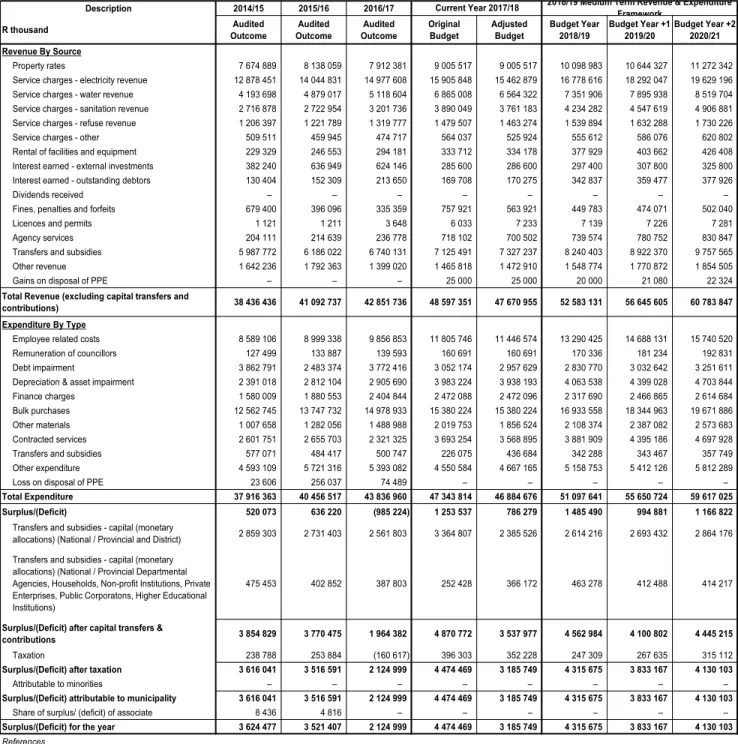
Table A2 Consolidated Budgeted Financial Performance
(revenue and expenditure by standard classification)
Table A3 Consolidated Budgeted Financial Performance
(revenue and expenditure by municipal vote)
Table A4 Consolidated Budgeted Financial Performance
(revenue and expenditure)
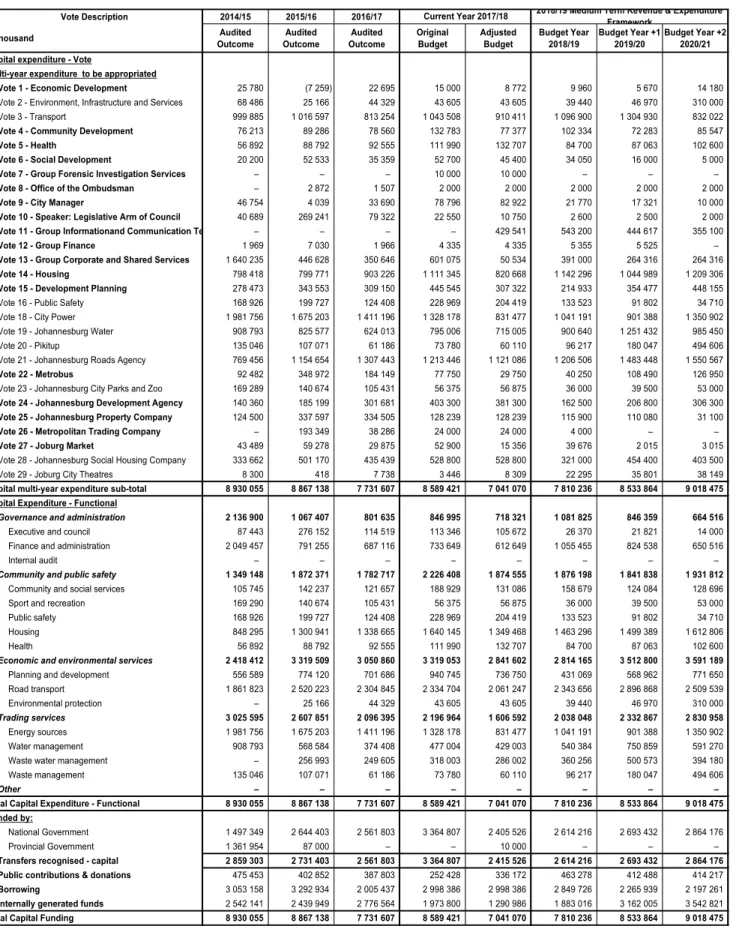
Table A5 Consolidated Budgeted Capital Expenditure by vote, (standard classification and funding)
Table A6 Consolidated Budgeted Financial Position
Table A7 Consolidated Budgeted Cash Flows
Table A8 Consolidated Cash- backed Reserves/ Accumulated
Surplus Reconciliation
Table A9 Consolidated Asset Management
Table A10 Consolidated Basic Service Delivery Measurement
SA1 Supporting detail to Budget Financial Performance
SA2 Consolidated Matrix Financial Performance
SA3 Supporting detail to Budget Financial Position
SA4 Reconciliation of IDP strategic objectives and Budget
(Operating revenue)
SA5 Reconciliation of IDP strategic objectives and Budget
(Operating expenditure)
SA6 Reconciliation of IDP strategic objectives and Budget
(Capital expenditure)
SA7 Measurable performance objectives
SA8 Performance indicators and benchmarks
SA9 Social, economic and demographic statistics and assumptions
SA10 Funding measurement
SA11 Property rates summary
SA12 and SA13 Property rates by category
SA14 Household bills
SA15 Investment particulars by type
SA16 Investment particulars by maturity
SA17 Borrowing
SA18 Transfers and grant receipts
SA19 Expenditure on transfers and grant programme
SA21 Transfers and grants made by the municipality
4
SA22 Summary councillor and staff benefits
SA23 Salaries, allowances and benefits (political office bearers, Councillors and senior managers)
SA24 Summary of personnel numbers
SA25 Budgeted monthly revenue and expenditure
SA26 Budgeted monthly revenue and expenditure by municipal vote
SA27 Budgeted revenue and expenditure by standard classification
SA28 Budgeted monthly capital expenditure by municipal vote
SA29 Budgeted monthly capital expenditure by standard classification
SA30 Consolidated budgeted monthly cash flow
SA31 Aggregated entity budget
SA32 List of external mechanisms
SA34 Consolidated capital expenditure by asset class
SA35 Consolidated future financial implications of the capital budget
5
Abbreviations and Acronyms
ALCO Assets and Liabilities Committee
Budget Lekgotla A planning forum aimed at identifying key spending priorities for the City for a specific planning cycle.
BSC Budget Steering Committee
BRT Bus Rapid Transit, a project initiated to improve public transport within the City.
CAPEX Capital expenditure, spending on municipal assets such as land, buildings, roads, etc.
CFO Chief Financial Officer
CIF Capital Investment Framework
CIMS Capital Investment Management System, a system used to prioritise capital projects in the City
CM City Manager
CoJ City of Johannesburg
CPI Consumer Price Index.
DED Department of Economic Development, one of the City’s core departments
DMTN Domestic Medium-Term Note.
DoRA Division of Revenue Act
EM Executive Mayor
ESP Expanded Social Package
FBE Free basic electricity
FBS Free basic services
FBW Free basic water
GAAP Generally Accepted Accounting Practice
GAMAP Generally Accepted Municipal Accounting Practice GRAP Generally Recognised Accounting Practice
GDS Growth and Development Strategy, the City’s long- term strategy for development.
GDP Gross domestic product
GMS Growth Management Strategy, the City’s strategy for the management of growth within the City.
HSDG Human Settlement Development Grant
IBT Inclining Block Tariff
IDP Integrated Development Plan, a strategic document detailing the City’s medium- term plan for development.
IGR Intergovernmental relations
Kl kiloliter
Km kilometer
KPA Key Performance Area
KPI Key Performance Indicator
LED Local economic development
MEs Municipal entities, companies in which the City is the sole shareholder, established to provide services to residents on behalf of the City.
6
MBRR Municipal Budgeting and Reporting Regulations
MFMA Municipal Finance Management Act, Act 56 of 2003, legislation providing a framework for financial management in local government
MIG Municipal Infrastructure Grant
MMC Member of the Mayoral Committee
MPRA Municipal Properties Rates Act MSA Municipal Systems Act, Act 32 of 2000
MTB Medium Term Budget, a three-year financial plan of a municipality MTEF Medium- term Expenditure Framework
NERSA National Electricity Regulator South Africa
NGO Non- governmental organisations
NT National Treasury of South Africa
OPEX Operating expenditure, spending on the day to day operational activities such as salaries and wages, repairs and maintenance, general expenses
PBO Public benefit organisations
PMS Performance Management System
PPP Public- Private Partnerships
RSC Regional Services Council
SA South Africa
SALGA South African Local Government Association SARB South African Reserve Bank
SDBIP Service Delivery and Budget Implementation Plan, a detailed plan containing quarterly performance targets and monthly budget estimates
SMME Small, Micro and Medium Enterprises
VOTE Segments (Departments/Municipal Entities/Programmes) into which a budget is divided for the appropriation of funds
7
List of Votes
Economic Development
Environment and Infrastructure Transport Department
Community Development Health
Social Development
Group Forensic Investigation Services Ombudsman
City Manager
Speaker: Legislative Arm of Council
Group Information Communication Technology Group Finance
Group Corporate and Shared Services Housing
Development Planning Public Safety
Municipal Entities Accounts City Power
Johannesburg Water Pikitup
Johannesburg Roads Agency Metrobus
Johannesburg Parks and Zoo Johannesburg Development Agency Johannesburg Property Company Metropolitan Trading Company Joburg Market
Johannesburg Social Housing Company Joburg City Theatres
8 Purpose
The purpose of this document is to submit the 2018/19 Medium Term Budget for approval.
The Budget has been compiled within the framework of the Municipal Financial Management Act (MFMA), Municipal Budget and Reporting Regulations (MBRR), MFMA Circulars No 51, 54, 55, 59, 66, 67, 70, 74, 75, 78, 79, 82, 85, 89 and 91.
9
PART 1 – ANNUAL BUDGET 1.1 EXECUTIVE SUMMARY
On 1 July 2018, marks the second full year of this administration since the 2016 local government elections.
This budget seeks to deliver the electoral mandate for real change, “Diphetogo”. As we approached the 2018/19 budget, we have identified a need to focus on ensuring the basics in service delivery are addressed while accelerating implementation of Diphetogo programmes, for the benefit of all residents.
Over the past year, we have focused on identifying key interventions required to address historic infrastructure backlogs to ensure the City is a functional metropolitan municipality. We have reviewed our financial models to strengthen financial indicators that will ensure the City remains financially sustainable, whilst making funding available to effectively respond to the huge needs that exist. We remain vigilant in enforcing the rule of law, through the Buya Mthetho initiatives. The institutional review and skill audit processes will ensure optimal alignment of resources in implementing the strategic objectives, magnify the impact of our programmes, to ensure maximum benefit to all who live in Johannesburg.
In approaching the 2018/19 Medium Term Budget (MTB), we recognized a need to recognize the performance of the organization against key financial matrices and therefore build from the right budget base. We further complemented these initiatives with a reprioritization of priorities; entrenching cost containment measures and eliminating unnecessary expenditure. We are focusing on delivering service with pride in utilizing public resources.
The inner city revitalization is being prioritized to restore the core of Johannesburg, and stimulate economic activity in the hub of the South African economy. It is in this regard that we continue to focus on addressing the scourge of hijacked properties and lawlessness.
We are building from the initiatives embarked on in 2016/17 financial year including the appointment of 1500 JMPD recruits; the improvement of cleaning levels especially in the Inner City; functional road and traffic signage and increasing the number of building and environmental health inspectors. Law enforcement still needs to be strengthened in outdoor advertising, vandalism and theft of the City’s infrastructure, and bypassed meters. The City has elevated the levels of service delivery through extending operating hours in clinics and libraries; capacitation of the Johannesburg Roads Agency amongst others. Through the Group Forensic Investigation Services, we remain committed to effectively dealing with corruption and fraud.
We continue to receive recognition locally and internationally in some of the programmes and infrastructure projects implemented.
The 2018/19 MTB therefore continues the implementation of the key IDP priorities of this government:
10
• Promote economic development and attract investment towards achieving 5% economic growth that reduces unemployment by 2021;
• Ensure pro-poor development that addresses inequality and poverty and provides meaningful redress;
• Create a culture of enhanced service delivery with pride;
• Create a sense of security through improved public safety;
• Create an honest and transparent City that fights corruption;
• Create a City that responds to the needs of citizens, customers, stakeholder and businesses.
• Enhance our financial sustainability;
• Encourage innovation and efficiency through the Smart City programme; and
• Preserve our resources for future generations.
These are complemented by the game changers we have identified through the Diphetogo. The 2018/19 budget is centralized around three core principles:
• Strengthening the existing revenue capacity and fiscal efforts by improving the culture of payment, ownership of revenue activities, efficiency of customer service and improving meter reading performance throughout the city;
• Improving the capacity to spend especially on grant funding in the implementation of the City’s capital programme; and
• Managing the cost of governance in relation to the implementation of programmes and intensifying austerity measures in both the operating and capital budget planning processes;
The 2018/19 allocations and budget process continue to safeguard the levers on which the City’s financial sustainability is premised and re-affirms the commitment towards the prudent management of the City’s finances. With respect to the City’s funding strategy and the cost of borrowing, there is hope that the renewed optimism in the economy will result in increased economic activity, decreased cost of borrowing and recovery of the value of earnings. But there are worrying signs for the local government revenue envelope, characterized by changes in the patterns of consumption especially for metered services. These consumption changes challenge organizational cost structure that needs to be maintained and highlights a need to understand the appropriate organizational capital structure that should be maintained going forward.
The allocations below therefore respond to the 2018/19 priority programmes, within the available resources.
1.2 OPERATING BUDGET FRAMEWORK
The proposed operating revenue budget is approximately R52.6 billion and the operating expenditure budget is totalling R51.1 billion for the 2018/19 financial year. Revenue is increasing by 10.3% and expenditure by 9%
over the 2017/18 financial year.
11
The table below sets out the Medium Term Revenue and Expenditure Budget for the 2018/19- 2020/21 financial years.
Adjusted
Budget Budget Estimate Estimate
2017/18 2018/19 % 2019/20 2020/21
R 000 R 000 R 000 R 000
Revenue 47 670 955 52 583 131 10.3% 56 645 605 60 783 847
Internal revenue 6 317 452 7 154 727 13.3% 7 680 213 8 389 496
53 988 407 59 737 858 10.6% 64 325 818 69 173 343
Expenditure 46 884 676 51 097 641 9.0% 55 650 724 59 617 025
Internal expenditure 6 317 452 7 154 727 13.3% 7 680 213 8 389 496 53 202 128 58 252 368 9.5% 63 330 937 68 006 521
Surplus (Deficit) 786 279 1 485 490 994 881 1 166 822
Taxation 352 228 247 309 -29.8% 267 635 315 112
Surplus (Deficit) for the year 434 051 1 238 181 727 246 851 710
Capital grants and contributions 2 751 698 3 077 494 3 105 920 3 278 393 Surplus (Deficit) for the year including
capital grants and contributions 3 185 749 4 315 675 3 833 167 4 130 103
The City is budgeting for a surplus (before taxation and capital grants) of R1.5 billion for 2018/19. The surplus will be applied towards the City’s working capital and funding of capital investment.
Revenue Analysis
In 2017/18, the direct revenues were budgeted at R47.7 billion with revenue estimated to be R52.6 billion in 2018/19.
Adjusted
Budget Budget Estimate Estimate
Revenue 2017/18 2018/19 % 2019/20 2020/21
R million R million R million R million
Property rates 9 006 10 099 12.1% 10 644 11 272
Electricity 15 463 16 779 8.5% 18 292 19 629
Water 6 564 7 352 12.0% 7 896 8 520
Sanitation 3 761 4 234 12.6% 4 548 4 907
Refuse 1 463 1 540 5.2% 1 632 1 730
Rental 334 378 13.1% 404 426
Interest earned 287 297 3.8% 308 326
Fines, penalties and forfeits 450 450 0.0% 474 502
Agency services 701 740 5.6% 781 831
Operating Grants 7 327 8 240 12.5% 8 922 9 758
Other revenue 2 316 2 474 6.9% 2 745 2 883
Total revenue 47 671 52 583 10.3% 56 646 60 784
The increase of 10.3% in total revenue is made up of the 12.1% increase in property rates, 8.5% in electricity revenue, 12% increase in water, 12.6% increase in sewerage revenue, 5.2% increase in refuse, 13.1% increase
12
in rental of facilities, 3.8% increase in interest earned, 5.6% increase agency services, 12.5% increase in operating grants and 6.9% increase in other revenue.
The graph below reflects the percentages per revenue category of the total revenue of the City.
Property rates 19.2%
Electricity 31.9%
Water 14.0%
Sanitation 8.1%
Refuse 2.9%
Rental 0.7%
Interest earned 0.6%
Fines, penalties and forfeits
0.9% Agency services
1.4%
Operating Grants 15.7%
Other revenue 4.7%
The 2018/19 revenue budget for property rates, electricity, water, sewerage and refuse amounts to R40 billion and it represents approximately 76.1% of the total revenue budget of R52.6 billion.
The table below sets out the average tariff increases for 2018/19 - 2020/21 financial years.
Service Base Year
2017/18
Budget Year 2018/19
Budget Year +1 2019/20
Budget Year +2 2020/21
Property rates 6.20% GV 2018 5.40% 5.90%
Electricity 2.28% 7.17% 9.02% 7.31%
Water 12.20% 13.20% 7.40% 7.90%
Sanitation 12.20% 13.20% 7.40% 7.90%
Refuse 6.20% 6.80% 5.40% 5.90%
The proposed tariff increases in the table above are averages; i.e. some customers may pay more and others less than the average.
13
Property rates: The property rates revenue is projected to increase by 12.1% on the 2017/18 adjusted budget, the increase is based on the new valuation roll that will be implemented as from 1 July 2018 in line with the requirements of the Municipal Property Rates Act (MPRA). The residential value exclusion will increase from R200 thousand to R350 thousand to ease the burden that the new property valuation might have on residents.
Service charges - electricity: The projected electricity revenue of R16.8 billion is approximately 8.5% increase from the 2017/18 financial year, the increase is based on a proposed average tariff increase for electricity of 7.17% and the strategic drive to reduce total electricity losses to a level of 17% in the 2018/19 financial year.
The bulk purchase price increase is assumed at 7%.
Service charges - water and sewerage: Projected water and sewerage charges are estimated at R11.6 billion, approximately 12.2% increase from the 2017/18 financial year. The increase is based on an average tariff increase of 13.2%, based on a proposed Rand Water tariff increase of 12.2% plus a retail margin of 1%.
Service charges – refuse: The projected refuse revenue of R1.5 billion is approximately 5.2% increase from the 2017/18 financial year, the increase is based on a proposed average tariff increase of 6.2% and a proposed stepped tariff to ensure affordability for lower priced properties.
Rental of facilities are increasing by approximately by 13.1% and is mainly due to the increase in rental housing unit and the increase in revenues on commercial leases and renewals of all social leases.
Interest earned increases by R10 million in line with payment and liquidity levels of the City.
Income from fines, penalties and forfeits remain the same as in the 2017/18 financial year and agency services increases by R39 million or 5.6%.
Operating grants are increasing by R913 million or 12.5% from the 2017/18 financial year. The increase mainly relates to increased allocations for the Equitable Share, Fuel Levy, and Public Transport Network (PTNG) grant funding.
Other revenue reflects an increase of R158 million or 6.9%.
The tariffs for minor services will mainly increase in line with estimated inflation of 5.4%.
Expenditure Analysis
The City adopted the 2017/18 Adjusted Operating Budget of R46.9 billion. 2018/19 presents a budget of R51.1 billion, an increase of 9% from the 2017/18 adjusted budget.
14
Adjusted
Budget Budget Estimate Estimate
Expenditure 2017/18 2018/19 % 2019/20 2020/21
R million R million R million R million
Employee related cost 11 447 13 290 16.1% 14 688 15 741
Remuneration of councillors 161 170 6.0% 181 193
Debt impairment 2 958 2 831 -4.3% 3 033 3 252
Depreciation and asset impairment 3 938 4 064 3.2% 4 399 4 704
Finance charges 2 472 2 318 -6.2% 2 467 2 615
Bulk purchases 15 380 16 934 10.1% 18 345 19 672
Contracted services 3 569 3 882 8.8% 4 395 4 698
Grants and subsidies 437 342 -21.6% 343 358
Other expenditure 6 524 7 267 11.4% 7 799 8 386
Total expenditure 46 885 51 098 9.0% 55 651 59 617
The increase of 9% in expenditure is a result of the increase in employee related cost 16.1%, remuneration of councillors 6%, debt impairment -4.3% depreciation 3.2%, finance charges -6.2%, bulk purchases 10.1%
(Eskom/Kelvin Power Station and Rand Water), contracted services 8.8%, grants and subsidies paid -21.6% and other expenditure 11.4%.
The graph below reflects the percentages per expenditure category of the total expenditure of the City.
Employee related cost
26.0%
Remuneration of councillors
0.3%
Debt impairment
5.5%
Depreciation and asset impairment
8.0%
Finance charges
4.5%
Bulk purchases
33.1%
Contracted services
7.6%
Grants and subsidies
0.7%
Other expenditure
14.2%
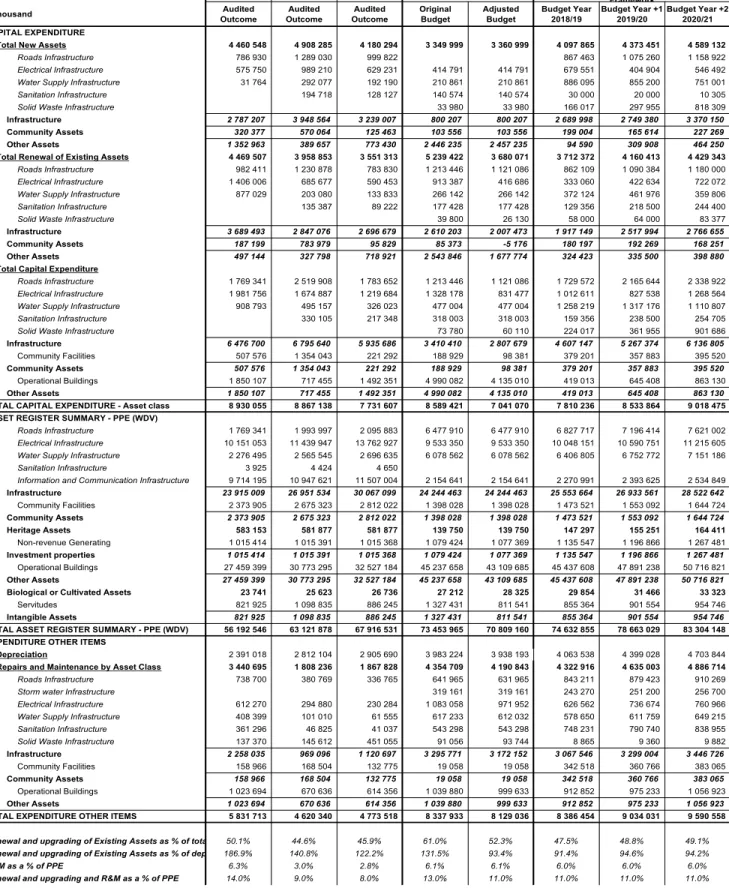
Repairs and Maintenance
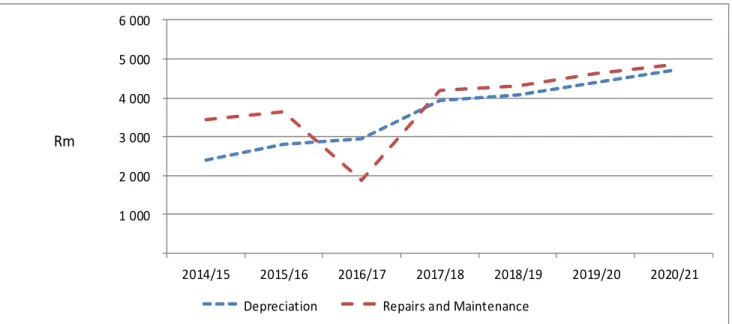
The City is placing a greater emphasis on preserving and maintaining its current infrastructure. Repairs and maintenance as a percentage of PPE has grown from 5.2% in 2013/14 to 6% in 2018/19. The 2018/19 repairs and maintenance represent 8.4% of total operating expenditure. In terms of the Municipal Budget and Reporting Regulations, operational repairs and maintenance is not considered a direct expenditure driver but an outcome of certain other expenditures, such as remuneration, purchases of materials and contracted services. The following table is a consolidation of all the expenditures associated with repairs and maintenance:
15
Description 2014/15 2015/16 2016/17 Current Year 2017/18 2018/19 Medium Term Revenue & Expenditure Framework
R thousand Audited Outcome Audited Outcome Audited Outcome Original Budget Adjusted Budget Budget Year 2018/19
Budget Year +1 2019/20
Budget Year +2 2020/21 Repairs and maintenance expenditure by Asset
Class
Roads Infrastructure 738 700 783 022 336 765 641 965 631 965 843 211 879 423 910 269
Storm water Infrastructure 319 161 319 161 243 270 251 200 256 700
Electrical Infrastructure 612 270 649 006 230 284 1 083 058 971 952 626 562 736 674 760 966
Water Supply Infrastructure 408 399 432 903 61 555 617 233 612 032 578 650 611 759 649 215
Sanitation Infrastructure 361 296 382 974 41 037 543 298 543 298 748 231 790 740 838 955
Solid Waste Infrastructure 137 370 145 612 451 055 91 056 93 744 8 865 9 360 9 882
Community Facilities 158 966 168 504 132 775 19 058 19 058 342 518 360 766 383 065
Other assets 1 023 694 1 085 116 614 356 1 039 880 999 633 912 852 975 233 1 056 923
Total 3 440 695 3 647 137 1 867 828 4 354 709 4 190 843 4 304 159 4 615 155 4 865 974
Financial Position
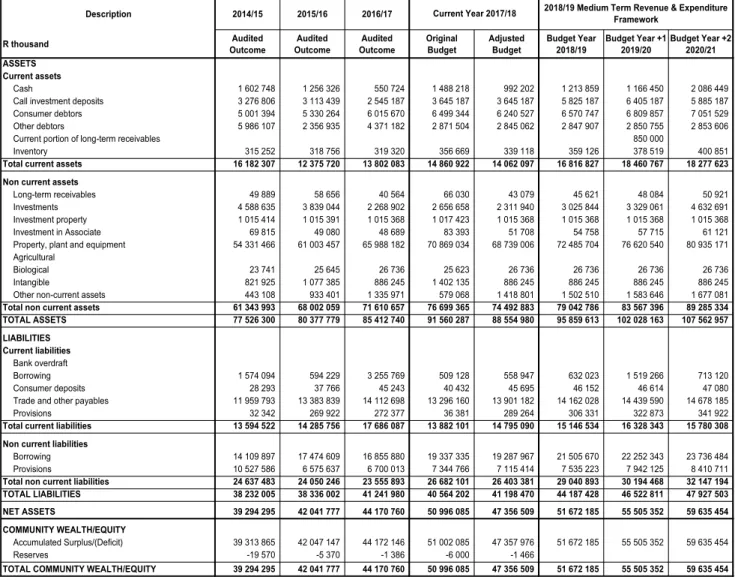
The table below reflects the summary of the proposed financial position.
Financial position Adjusted
Budget Budget Estimate Estimate 2017/18 2018/19 2019/20 2020/21 R million R million R million R million
Total current assets 14 062 16 817 18 461 18 278
Total non current assets 74 493 79 043 83 567 89 285
Total current liabilities 14 795 15 147 16 328 15 780
Total non current liabilities 26 403 29 041 30 194 32 147
Community wealth/equity 47 357 51 672 55 505 59 635
The projected current ratio over the medium term is projected to be above 1:1. Cash reserves are used to fund capital investment, hence no material improvement in the current ratio.
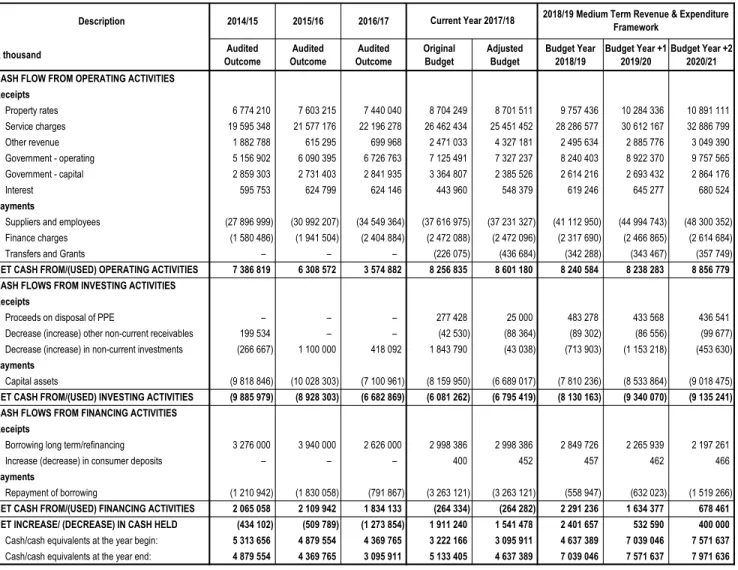
Cash Flow
The table below reflects the summary of the proposed cash flow.
Cash flow Adjusted
Budget Budget Estimate Estimate 2017/18 2018/19 2019/20 2020/21 R million R million R million R million
Net cash from (used) operating 8 601 8 704 8 651 9 271
Net cash from (used) investing (6 795) (8 593) (9 753) (9 549)
Net cash from (used) financing (264) 2 291 1 634 678
Cash/cash equivalents at the year begin: 3 096 4 637 7 039 7 572 Cash/cash equivalents at the year end 4 637 7 039 7 572 7 972
The cash of the City is projected to be approximately R7 billion at the end of the 2018/19 financial year. It will be approximately R8 billion in the outer year. Cash reserves are applied towards capital infrastructure
spending.
To achieve financial stabilisation and long-term sustainability the City has a set of parameters within which financial planning should be aligned. These key financial indicators are included in the table below.
16
Key Financial Indicators
Actual Adjusted Bench-
2016/17 Budget marks Budget Estimate Estimate
2017/18 2018/19 2019/20 2020/21
Current ratio 0.8:1 1:1 Above 1:1 1.1:1 1.1:1 1.2:1
Solvency ratio 2.1:1 2.1:1 Above 2:1 2.2:1 2.2:1 2.2:1
Debt to Revenue ratio 51% 45% Below 45% 45% 45% 43%
Remuneration as % of Total Operating
Expenditure ratio 22.9% 24.6% Below 30% 26.2% 26.6% 26.6%
Repairs and Maintenance as a % of PPE
ratio 2.8% 6.1% 8% 5.9% 6.0% 6.0%
Capital cost (interest and redemption) as a
% of total operating expenditure 7% 12% Below 7% 6% 6% 7%
Net Operating Surplus Margin 5% 6% Above 15% 8% 6% 6%
Cash / Cost coverage (days) 30.0 36.7 45 days 52.2 51.5 50.6
Ratios
1.3 CAPITAL EXPENDITURE
The level of capital expenditure and borrowing are based on affordability, prudential indicators and
sustainability (debt ratio, current ratio, operating surplus and the impact or return of the capital investment on the operating account). The table below reflects the medium term capital budget over the next three years.
Adj Bud Budget Budget Budget
Funding source 2017/18 2018/19 2019/20 2020/21
R 000 R 000 R 000 R 000
Loan funding 2 998 386 2 849 726 2 265 939 2 197 261
CRR and surplus cash 1 290 986 1 883 016 3 162 005 3 542 821 Grants and contributions 2 751 698 3 077 494 3 105 920 3 278 393
Total 7 041 070 7 810 236 8 533 864 9 018 475
The capital budget of the City projects a spending plan of approximately R25.4 billion over the next three-year period. The capital budget for the 2018/19 financial year amounts to approximately R7.8 billion.
Approximately R4.7 billion of the capital budget will be funded by the City and R3.1 billion from grants and public contributions.
17
Funding Sources for 2018/19
COJ - Loans 36.5%
COJ - Cash 24.1%
National 9.8%
USDG 23.7%
Other 5.9%
R2.9 billion of capital will be funded from loans.
R1.9 billion of capital will be funded through cash surpluses.
R0.8 billion will be funded from grants received from National (PTIS - R627 million, NDPG - R40.1 million, Integrated City Development Grant - R63.5 million and National Electrification - R31.3 million).
R1.9 billion will be funded through the Urban Settlement Development Grant (USDG).
R463.3 million will be funded from other sources (public and bulk service contributions).
1.4 ANNUAL BUDGET TABLES
The following pages present the main budget tables as required in terms of section 8 of the Municipal Budget and Reporting Regulations. These tables set out the municipality’s 2018/19 budget and the MTB.
18
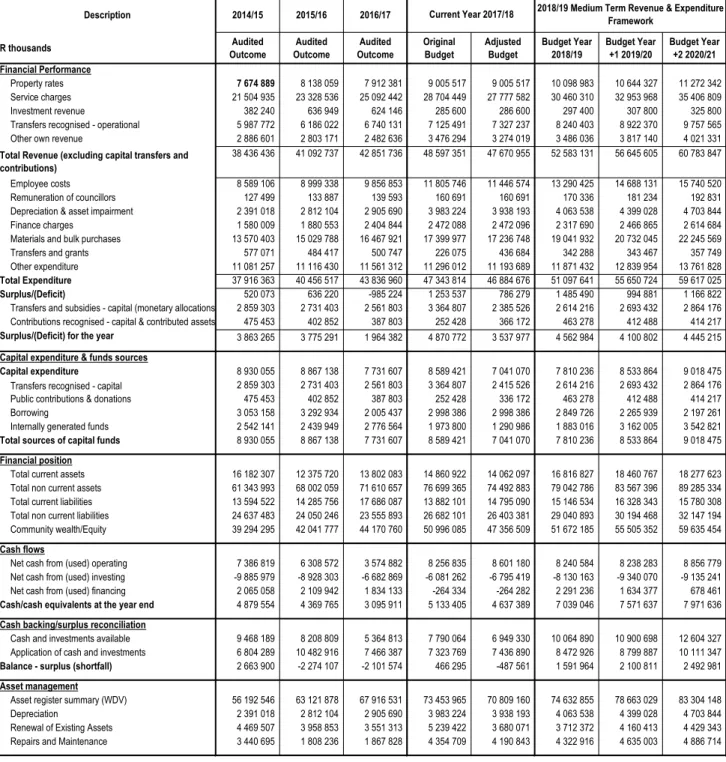
Table A1: Consolidated Budget Summary
Description 2014/15 2015/16 2016/17
R thousands Audited
Outcome
Audited Outcome
Audited Outcome
Original Budget
Adjusted Budget
Budget Year 2018/19
Budget Year +1 2019/20
Budget Year +2 2020/21 Financial Performance
Property rates 7 674 889 8 138 059 7 912 381 9 005 517 9 005 517 10 098 983 10 644 327 11 272 342
Service charges 21 504 935 23 328 536 25 092 442 28 704 449 27 777 582 30 460 310 32 953 968 35 406 809
Investment revenue 382 240 636 949 624 146 285 600 286 600 297 400 307 800 325 800
Transfers recognised - operational 5 987 772 6 186 022 6 740 131 7 125 491 7 327 237 8 240 403 8 922 370 9 757 565
Other own revenue 2 886 601 2 803 171 2 482 636 3 476 294 3 274 019 3 486 036 3 817 140 4 021 331
Total Revenue (excluding capital transfers and contributions)
38 436 436 41 092 737 42 851 736 48 597 351 47 670 955 52 583 131 56 645 605 60 783 847
Employee costs 8 589 106 8 999 338 9 856 853 11 805 746 11 446 574 13 290 425 14 688 131 15 740 520
Remuneration of councillors 127 499 133 887 139 593 160 691 160 691 170 336 181 234 192 831
Depreciation & asset impairment 2 391 018 2 812 104 2 905 690 3 983 224 3 938 193 4 063 538 4 399 028 4 703 844
Finance charges 1 580 009 1 880 553 2 404 844 2 472 088 2 472 096 2 317 690 2 466 865 2 614 684
Materials and bulk purchases 13 570 403 15 029 788 16 467 921 17 399 977 17 236 748 19 041 932 20 732 045 22 245 569
Transfers and grants 577 071 484 417 500 747 226 075 436 684 342 288 343 467 357 749
Other expenditure 11 081 257 11 116 430 11 561 312 11 296 012 11 193 689 11 871 432 12 839 954 13 761 828
Total Expenditure 37 916 363 40 456 517 43 836 960 47 343 814 46 884 676 51 097 641 55 650 724 59 617 025
Surplus/(Deficit) 520 073 636 220 -985 224 1 253 537 786 279 1 485 490 994 881 1 166 822
Transfers and subsidies - capital (monetary allocations) (National / Provincial and District)2 859 303 2 731 403 2 561 803 3 364 807 2 385 526 2 614 216 2 693 432 2 864 176
Contributions recognised - capital & contributed assets 475 453 402 852 387 803 252 428 366 172 463 278 412 488 414 217
Surplus/(Deficit) for the year 3 863 265 3 775 291 1 964 382 4 870 772 3 537 977 4 562 984 4 100 802 4 445 215
Capital expenditure & funds sources
Capital expenditure 8 930 055 8 867 138 7 731 607 8 589 421 7 041 070 7 810 236 8 533 864 9 018 475
Transfers recognised - capital 2 859 303 2 731 403 2 561 803 3 364 807 2 415 526 2 614 216 2 693 432 2 864 176
Public contributions & donations 475 453 402 852 387 803 252 428 336 172 463 278 412 488 414 217
Borrowing 3 053 158 3 292 934 2 005 437 2 998 386 2 998 386 2 849 726 2 265 939 2 197 261
Internally generated funds 2 542 141 2 439 949 2 776 564 1 973 800 1 290 986 1 883 016 3 162 005 3 542 821
Total sources of capital funds 8 930 055 8 867 138 7 731 607 8 589 421 7 041 070 7 810 236 8 533 864 9 018 475
Financial position
Total current assets 16 182 307 12 375 720 13 802 083 14 860 922 14 062 097 16 816 827 18 460 767 18 277 623
Total non current assets 61 343 993 68 002 059 71 610 657 76 699 365 74 492 883 79 042 786 83 567 396 89 285 334
Total current liabilities 13 594 522 14 285 756 17 686 087 13 882 101 14 795 090 15 146 534 16 328 343 15 780 308
Total non current liabilities 24 637 483 24 050 246 23 555 893 26 682 101 26 403 381 29 040 893 30 194 468 32 147 194
Community wealth/Equity 39 294 295 42 041 777 44 170 760 50 996 085 47 356 509 51 672 185 55 505 352 59 635 454
Cash flows
Net cash from (used) operating 7 386 819 6 308 572 3 574 882 8 256 835 8 601 180 8 240 584 8 238 283 8 856 779
Net cash from (used) investing -9 885 979 -8 928 303 -6 682 869 -6 081 262 -6 795 419 -8 130 163 -9 340 070 -9 135 241
Net cash from (used) financing 2 065 058 2 109 942 1 834 133 -264 334 -264 282 2 291 236 1 634 377 678 461
Cash/cash equivalents at the year end 4 879 554 4 369 765 3 095 911 5 133 405 4 637 389 7 039 046 7 571 637 7 971 636
Cash backing/surplus reconciliation
Cash and investments available 9 468 189 8 208 809 5 364 813 7 790 064 6 949 330 10 064 890 10 900 698 12 604 327
Application of cash and investments 6 804 289 10 482 916 7 466 387 7 323 769 7 436 890 8 472 926 8 799 887 10 111 347
Balance - surplus (shortfall) 2 663 900 -2 274 107 -2 101 574 466 295 -487 561 1 591 964 2 100 811 2 492 981
Asset management
Asset register summary (WDV) 56 192 546 63 121 878 67 916 531 73 453 965 70 809 160 74 632 855 78 663 029 83 304 148
Depreciation 2 391 018 2 812 104 2 905 690 3 983 224 3 938 193 4 063 538 4 399 028 4 703 844
Renewal of Existing Assets 4 469 507 3 958 853 3 551 313 5 239 422 3 680 071 3 712 372 4 160 413 4 429 343
Repairs and Maintenance 3 440 695 1 808 236 1 867 828 4 354 709 4 190 843 4 322 916 4 635 003 4 886 714
Current Year 2017/18 2018/19 Medium Term Revenue & Expenditure Framework
19
Explanatory notes to table A1: Budget Summary
1. Table A1 is a budget summary and provides an overview of the City’s budget that includes all major financial components (i.e. operating, capital expenditure, financial position, cash flow, and MFMA funding compliance).
2. Financial management reforms emphasise the importance of the municipal budget being funded. This requires the simultaneous assessment of the Financial Performance, Financial Position and Cash Flow Budgets, along with the Capital Budget. The Budget Summary provides the key information in this regard:
a. The operating surplus is positive over the medium term;
b. The capital budget is growing from approximately R7.8 billion in 2018/19 to R9 billion in 2020/21. The City’s is accelerating service delivery through an intensive capital investment programme;
c. Borrowing is incorporated in the net cash from financing on the Cash Flow Budget;
d. Internally generated funds are financed from a combination of the current operating surplus and accumulated cash-backed surpluses from previous years; and
e. The cash of the City is projected to be approximately R7 billion at the end of the 2018/19 financial year. It will be approximately R8 billion in the outer year.
3. The City's cash backing / surplus reconciliation over the medium term budget shows a positive
outcome, which is an indication that the City will be able to afford its commitments over the next three years.
20
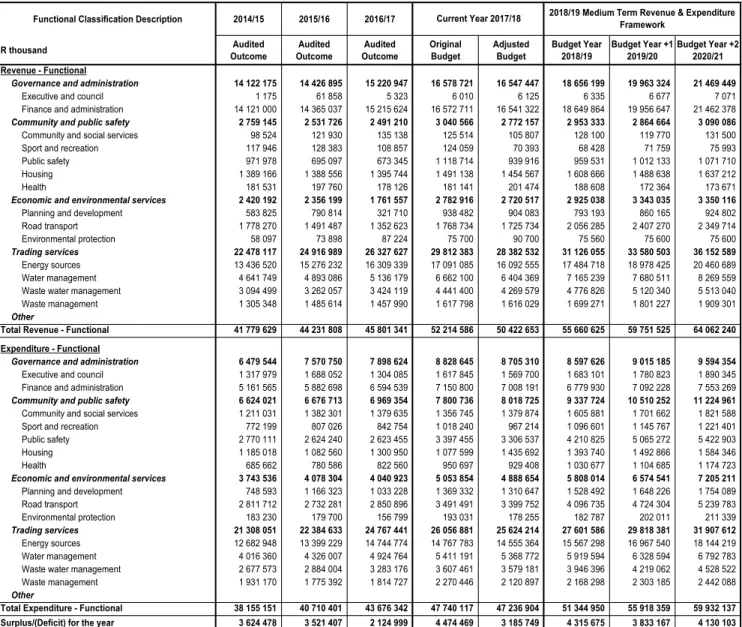
Table A2: Consolidated Budgeted Financial Performance (revenue and expenditure by standard classification)
Functional Classification Description 2014/15 2015/16 2016/17
R thousand Audited
Outcome
Audited Outcome
Audited Outcome
Original Budget
Adjusted Budget
Budget Year 2018/19
Budget Year +1 2019/20
Budget Year +2 2020/21 Revenue - Functional
Governance and administration 14 122 175 14 426 895 15 220 947 16 578 721 16 547 447 18 656 199 19 963 324 21 469 449
Executive and council 1 175 61 858 5 323 6 010 6 125 6 335 6 677 7 071
Finance and administration 14 121 000 14 365 037 15 215 624 16 572 711 16 541 322 18 649 864 19 956 647 21 462 378
Community and public safety 2 759 145 2 531 726 2 491 210 3 040 566 2 772 157 2 953 333 2 864 664 3 090 086
Community and social services 98 524 121 930 135 138 125 514 105 807 128 100 119 770 131 500
Sport and recreation 117 946 128 383 108 857 124 059 70 393 68 428 71 759 75 993
Public safety 971 978 695 097 673 345 1 118 714 939 916 959 531 1 012 133 1 071 710
Housing 1 389 166 1 388 556 1 395 744 1 491 138 1 454 567 1 608 666 1 488 638 1 637 212
Health 181 531 197 760 178 126 181 141 201 474 188 608 172 364 173 671
Economic and environmental services 2 420 192 2 356 199 1 761 557 2 782 916 2 720 517 2 925 038 3 343 035 3 350 116
Planning and development 583 825 790 814 321 710 938 482 904 083 793 193 860 165 924 802
Road transport 1 778 270 1 491 487 1 352 623 1 768 734 1 725 734 2 056 285 2 407 270 2 349 714
Environmental protection 58 097 73 898 87 224 75 700 90 700 75 560 75 600 75 600
Trading services 22 478 117 24 916 989 26 327 627 29 812 383 28 382 532 31 126 055 33 580 503 36 152 589
Energy sources 13 436 520 15 276 232 16 309 339 17 091 085 16 092 555 17 484 718 18 978 425 20 460 689
Water management 4 641 749 4 893 086 5 136 179 6 662 100 6 404 369 7 165 239 7 680 511 8 269 559
Waste water management 3 094 499 3 262 057 3 424 119 4 441 400 4 269 579 4 776 826 5 120 340 5 513 040
Waste management 1 305 348 1 485 614 1 457 990 1 617 798 1 616 029 1 699 271 1 801 227 1 909 301
Other
Total Revenue - Functional 41 779 629 44 231 808 45 801 341 52 214 586 50 422 653 55 660 625 59 751 525 64 062 240 Expenditure - Functional
Governance and administration 6 479 544 7 570 750 7 898 624 8 828 645 8 705 310 8 597 626 9 015 185 9 594 354
Executive and council 1 317 979 1 688 052 1 304 085 1 617 845 1 569 700 1 683 101 1 780 823 1 890 345
Finance and administration 5 161 565 5 882 698 6 594 539 7 150 800 7 008 191 6 779 930 7 092 228 7 553 269
Community and public safety 6 624 021 6 676 713 6 969 354 7 800 736 8 018 725 9 337 724 10 510 252 11 224 961
Community and social services 1 211 031 1 382 301 1 379 635 1 356 745 1 379 874 1 605 881 1 701 662 1 821 588
Sport and recreation 772 199 807 026 842 754 1 018 240 967 214 1 096 601 1 145 767 1 221 401
Public safety 2 770 111 2 624 240 2 623 455 3 397 455 3 306 537 4 210 825 5 065 272 5 422 903
Housing 1 185 018 1 082 560 1 300 950 1 077 599 1 435 692 1 393 740 1 492 866 1 584 346
Health 685 662 780 586 822 560 950 697 929 408 1 030 677 1 104 685 1 174 723
Economic and environmental services 3 743 536 4 078 304 4 040 923 5 053 854 4 888 654 5 808 014 6 574 541 7 205 211
Planning and development 748 593 1 166 323 1 033 228 1 369 332 1 310 647 1 528 492 1 648 226 1 754 089
Road transport 2 811 712 2 732 281 2 850 896 3 491 491 3 399 752 4 096 735 4 724 304 5 239 783
Environmental protection 183 230 179 700 156 799 193 031 178 255 182 787 202 011 211 339
Trading services 21 308 051 22 384 633 24 767 441 26 056 881 25 624 214 27 601 586 29 818 381 31 907 612
Energy sources 12 682 948 13 399 229 14 744 774 14 767 783 14 555 364 15 567 298 16 967 540 18 144 219
Water management 4 016 360 4 326 007 4 924 764 5 411 191 5 368 772 5 919 594 6 328 594 6 792 783
Waste water management 2 677 573 2 884 004 3 283 176 3 607 461 3 579 181 3 946 396 4 219 062 4 528 522
Waste management 1 931 170 1 775 392 1 814 727 2 270 446 2 120 897 2 168 298 2 303 185 2 442 088
Other
Total Expenditure - Functional 38 155 151 40 710 401 43 676 342 47 740 117 47 236 904 51 344 950 55 918 359 59 932 137
Surplus/(Deficit) for the year 3 624 478 3 521 407 2 124 999 4 474 469 3 185 749 4 315 675 3 833 167 4 130 103
Current Year 2017/18 2018/19 Medium Term Revenue & Expenditure Framework
Explanatory notes to table A2: Budgeted Financial Performance (revenue and expenditure by standard classification)
1. Table A2 is a view of the budgeted financial performance in relation to revenue and expenditure per standard classification. The standard classification divides the municipal services into functional areas.
Municipal revenue, operating expenditure and capital expenditure are then classified in terms of each of these functional areas which enable the National Treasury to compile "whole of government”
report.
2. The total revenue on this table includes capital transfers and expenditure includes taxation.
21
The table below reflects the surplus/(deficit) of trading services accounts.
Description 2014/15 2015/16 2016/17
R thousand Audited
Outcome
Audited Outcome
Audited Outcome
Original Budget
Adjusted Budget
Budget Year 2018/19
Budget Year +1 2019/20
Budget Year +2 2020/21 Electricity
Revenue (incl. capital grants) 13 526 14 577 16 015 17 091 16 093 17 485 18 978 20 461
Expendture 12 689 13 621 15 041 14 768 14 555 15 567 16 968 18 144
Surplus/(Deficit) for the year 837 956 973 2 323 1 537 1 917 2 011 2 316
% Surplus/(Deficit) 6.2% 6.6% 6.1% 13.6% 9.6% 11.0% 10.6% 11.3%
Water and Wastewater Management
Revenue (incl. capital grants) 7 826 8 637 9 154 11 104 10 674 11 942 12 801 13 783
Expendture 6 973 7 784 8 520 9 019 8 948 9 866 10 548 11 321
Surplus/(Deficit) for the year 853 853 634 2 085 1 726 2 076 2 253 2 461
% Surplus/(Deficit) 10.9% 9.9% 6.9% 18.8% 16.2% 17.4% 17.6% 17.9%
Waste management
Revenue (incl. capital grants) 1 333 1 474 1 522 1 618 1 616 1 699 1 801 1 909
Expendture 1 932 1 774 1 930 2 270 2 121 2 168 2 303 2 442
Surplus/(Deficit) for the year -599 -299 -408 -652 -505 -469 -502 -532
% Surplus/(Deficit) -44.9% -20.3% -26.8% -40.3% -31.2% -27.6% -27.9% -27.9%
Current Year 2017/18 2018/19 Medium Term Revenue & Expenditure Framework
1. The electricity trading surplus is R1.9 billion, R2 billion and R2.3 billion over the medium.
2. The surplus on the water and wastewater management account are increasing over the medium term translating into a surplus of R2.1 billion, R2.3 billion and R2.5 billion for each of the respective financial years.
3. The deficit on waste management are relatively stable over the medium term from R469 million in 2018/19 to R532 million in 2020/21. The deficit of waste management is cross-subsidised by the property rates account.
4. The surpluses on the trading accounts are utilised as an internal funding source for the capital investment (asset renewal, refurbishment and the development of new asset infrastructure).