COASTLINE IMPACTS OF TROPICAL CYCLONES AND CLIMATE CHANGE ON MAURITIUS
Yanick Douce
Submitted in fulfillment of the academic requirements for the degree of Master of Science in Civil Engineering, College of Agriculture,
Engineering and Science, University of KwaZulu-Natal, Durban
November 2014
Supervisor: Prof. Derek Stretch Co-Supervisor: Dr. Stefano Corbella
DECLARATION 1 – PLAGIARISM
I, Yanick Douce, declare that
1. The research reported in this thesis, except where otherwise indicated, is my original research.
2. This thesis has not been submitted for any degree or examination at any other university.
3. This thesis does not contain other persons’ data, pictures, graphs or other information, unless specifically acknowledged as being sourced from other persons.
4. This thesis does not contain other persons' writing, unless specifically acknowledged as being sourced from other researchers. Where other written sources have been quoted, then:
a. Their words have been re-written but the general information attributed to them has been referenced.
b. Where their exact words have been used, then their writing has been placed in italics and inside quotation marks, and referenced.
5. This thesis does not contain text, graphics or tables copied and pasted from the Internet, unless specifically acknowledged, and the source being detailed in the thesis and in the References sections.
Signed ________________________ Date ___________
Mr. Yanick Douce
As the candidate’s supervisor, I agree/do not agree to the submission of this thesis.
Signed ________________________ Date ___________
Prof. Derek Stretch
As the candidate’s co-supervisor, I agree/do not agree to the submission of this thesis.
ACKNOWLEDGEMENT
I would like to express my infinite gratitude to Doctor Stefano Corbella for his priceless assistance throughout the study. Thanks to my supervisor, Professor Derek Stretch, for his support and guidance.
Thanks to the Ministry of Environment of the Republic of Mauritius and the Mauritius Meteorological Services for the wave data and the reports on the coastal studies. Thanks to my friends and ex-colleagues at GIBB (Mauritius) Ltd for providing valuable information.
Thanks to Dylan Bruce Kime and his team at DHI Group (South Africa) for their help with the MIKE 21 model.
A special thanks to my wife, Nathalie, my parents and my friends who have provided support and encouragement in completing this study.
ABSTRACT
The tourism industry has grown to become the third pillar of the Mauritian economy, due mainly to its prestigious beaches. However, Mauritius is prone to severe tropical cyclones which can have detrimental impacts on its coastal environment and ultimately its economy. It is predicted that the frequency and intensity of these tropical cyclone will increase under the influence of climate change. This may accelerate the rate of coastal erosion as a result of rising sea level, tidal waves and storm surges.
Prior to 2003, no preventive coastal management framework was available in Mauritius to address the impact of tropical cyclones. Since, various studies have recommended that wave prediction models be adopted to assess and quantify the amount of sediment transport resulting from tropical cyclones.
In this research, the relative coastal erosion due to the predicted impact of climate change on tropical storm waves at Belle Mare beach in Mauritius was studied. This was achieved by, firstly, the generation of cyclone wind fields as the primary driving mechanism for the wave model using the MIKE 21 Cyclone Wind Generation model. This required cyclone parameters such as the cyclone tracks, maximum wind speeds and maximum pressures which were extracted from the “Australian Severe Weather” centre.
Mike 21 SW model, a 2D-spectral numerical modelling software, was then used to generate cyclone-induced waves and surges. This required the creation of a regular grid defining the shoreline and bathymetry which was obtained from “NOAA data centre”.
Based on the published expected effect of climate change on cyclones, the intensity of cyclone Davina (1999) was increased by 5%, 10% and 15% respectively. The resulting wave outputs for each scenario were applied in the XBeach model to assess and quantify the coastal erosion at Belle-Mare. The outputs from XBEACH revealed that the reef surrounding Mauritius reduces the cyclone wave height before it reaches the beach by some 85%. Despite the beneficial influence of the coral reefs on storm surge, the relative volume of sediment erosion resulting from the various intensified cyclone scenarios for Davina is significantly high;
15.36m3/m for a 5% cyclone intensification, 18.16m3/m for 10% and 21.45m3/m for 15%.
CONTENTS
Contents ... iv
List of Figures ... viii
List of Tables ... x
Nomenclature ... xi
Chapter 1: Introduction ... 1
1.1 Effects of cyclone wave on coastline ... 1
1.2 Problem definition (Motivation, aim, objective) ... 1
Research question ... 1
1.2.1 Motivation ... 2
1.2.2 Aim & Objectives ... 3
1.2.3 1.3 Approach ... 3
Belle Mare Public Beach ... 3
1.3.1 1.4 Structure of Dissertation ... 5
Chapter 2: Literature Review ... 6
2.1 Introduction ... 6
2.2 Waves and Tropical cyclones ... 6
2.3 Climate change and tropical cyclones ... 8
Predicted effect of climate change on tropical cyclone ... 9
2.3.1 Discussion: ... 11
2.3.2 2.4 Cyclone Potential Intensity increase for Case Study ... 13
2.5 Global sea level trend ... 13
Sea level rise ... 13
2.5.1 2.6 Tides ... 14
2.7 Storm surge ... 14
2.8 Sources of coastal sediment ... 14
2.9 Resulting effect of climate change on coastlines on predicted surge and erosion ... 15
2.10 Numerical modelling ... 15
MIKE 21 Cyclone Wind Generation ... 15
2.10.1 MIKE 21 Spectral Wave (SW) module ... 20
2.10.2 XBEACH ... 23
2.10.3 2.11 Shoreline defence and preservation ... 25
Hard protection measures ... 26
2.11.1 Soft protection measures ... 26
2.11.2 Preservation of the coral reefs ... 27
2.11.3 2.12 Literature review conclusion ... 28
Chapter 3: Case Study: Data for Tropical Cyclones in the INdian Ocean ... 29
3.1 Classification of cyclones ... 29
3.2 Cyclone trend in the Indian Ocean ... 29
Improved Cyclone Data ... 30
3.2.1 3.3 Modelled tropical cyclones ... 33
Calibration and Validation ... 33
3.3.1 Quantification of predicted erosion ... 33
3.3.2 3.4 Summary ... 34
Chapter 4: Case Study: General Description ... 35
4.1 Coastal Livelihoods and degradation ... 35
4.2 Previous coastal studies in Mauritius ... 36
Extent of coastal studies ... 36
4.2.1 4.3 The coastal geology of Mauritius ... 37
4.4 The wave climate of Mauritius ... 38
4.8 Cyclone Return Period ... 40
4.9 Coastal Vulnerability and Selection of Pilot site ... 43
4.10 Coastal features of Belle Mare beach ... 45
4.11 COSMOS model output ... 46
4.12 Coral reef degradation ... 47
4.13 Proposed mitigation for erosion at Belle Mare ... 48
4.14 Limitations and Constraints ... 48
4.15 Summary ... 49
Chapter 5: Model Data and Methods ... 50
5.1 Mike 21: Model Setup, Calibration and Validation ... 50
Model extent, bathymetry and mesh grid ... 50
5.1.1 MIKE 21 Cyclone Wind Generation ... 52
5.1.2 Spectral Wave (SW) module ... 52
5.1.3 Calibration and Validation ... 53
5.1.4 5.2 XBEACH: Application and Model Setup ... 56
Application ... 56
5.2.1 Model bathymetry ... 56
5.2.2 Model setup ... 57
5.2.3 5.3 Summary ... 59
Chapter 6: Results and Discussion ... 60
6.1 Introduction ... 60
6.2 MIKE 21 SW ... 60
6.3 XBEACH ... 68
6.3.1 Predicted Erosion ... 68
6.3.2 Wave energy dissipation ... 69
6.4 Discussion of results ... 74
Chapter 7: Shoreline Defence ... 76
7.1 Assessment of various coastal defences for Belle Mare ... 76
7.1.1 Alternative 1: “Do-Nothing” ... 76
7.1.2 Alternative 2: Vegetated dunes ... 77
7.1.3 Alternative 3: GSCs with vegetated dunes ... 77
7.1.4 Alternative 4: Beach nourishment ... 77
7.1.5 Alternative 5: Hard measures ... 77
7.2 Selection of coastal defence alternative ... 78
Chapter 8: Conclusion ... 79
8.1 Recommendations for future work ... 81
References ... 82
Appendix A Cyclone Data From The Australian Severe Weather Between
1997 And 2011 App A - 1
Appendix B XBEACH set-up file for Belle Mare: Scenario 1 App B - 1
LIST OF FIGURES
Figure 1-1 Map of Mauritius showing Belle Mare Beach 4
Figure 3-1 Cyclone activity in the South Indian Ocean (longitude 15°E to
135°E) between 1945 and 2011 30
Figure 3-2 Graphical representation for the classification of the total number of
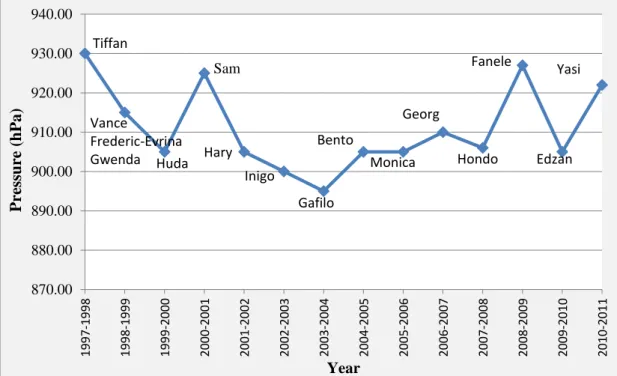
cyclones and frequency between 1997 and 2011 in the SIO 31 Figure 3.3 Annual most severe TC between 1997 and 2011 in the SIO based
on Pressure (hPa) 32
Figure 3-4 Annual most severe TC between 1997 and 2011 in the SIO based
on Maximum wind speed (m/s) 33
Figure 3-5 Trajectory of Tropical cyclone Davina (1999) 34
Figure 4-1 The estimated percentage of coastal types and land usage for
Mauritius 37
Figure 4-2 Geographical location of Mauritius 39
Figure 4-3 Interannual variation in sea level since 1990 40
Figure 4-4 Geographical representation showing vulnerability of beaches listed
in Table 4-2 44
Figure 4-5 Location site Map of Belle Mare 45
Figure 5-1 Map of study area showing the bathymetry 50
Figure 5-2 Model mesh grid showing different scales for the model domain 51 Figure 5-3 Measured and predicted significant wave heights for cyclone Darius
(2003) 54
Figure 5-4 Cyclone Darius track (2003) from the Australian Severe Weather
website 55
Figure 5-5 Measured and predicted significant wave heights for cyclone
Hennie (2005) 55
Figure 5-6 Location of surveyed alignment along Belle Mare beach 56
Figure 5-7 Beach Profile along Belle Mare beach shown in different scales 57 Figure 6-1
(a to d)
Cyclone Davina (1999) trajectory on 09 March 2014 61
Figure 6-2 Trajectory of cyclone Davina (1999) from the Australian Severe
Weather website 63
Figure 6-3 Significant wave heights for scenario 1 to 4 at latitude 20.09°S and longitude 57.47°E at Belle Mare for cyclone Davina (1999) using
MIKE 21 SW (outside lagoon) 64
Figure 6-4 Wave rose diagrams (in metres) for scenario 1 to 4 for cyclone Davina (1999) at at latitude 20.09°S and longitude 57.47°E
(offshore of Belle Mare beach) 65
Figure 6-5 Measured beach profiles and surveyed bathymetry at Belle Mare
before and after Cyclone Davina shown in different scales 68 Figure 6-6 XBEACH wave decay for cyclone Davina at time step “0000-01-01
03:00:00” at Belle Mare 71
Figure 6-7 (a to d)
Wave run-up and extent of erosion for Scenarios 1 to 4 from
XBEACH for cyclone Davina at Belle Mare 72
Figure 6-8 Relation between erosion (m3/m) and Hm0 (m) for various cyclone
intensities (%) for cyclone Davina 75
LIST OF TABLES
Table 2-1 Summary of the resulting effect of climate change on the main
parameters that affects the formation of tropical cyclones 11 Table 2-2 Effect of climate change on the intensity of tropical cyclones as
predicted by various studies 12
Table 3-1 Classification of tropical cyclones in the Indian Ocean based on
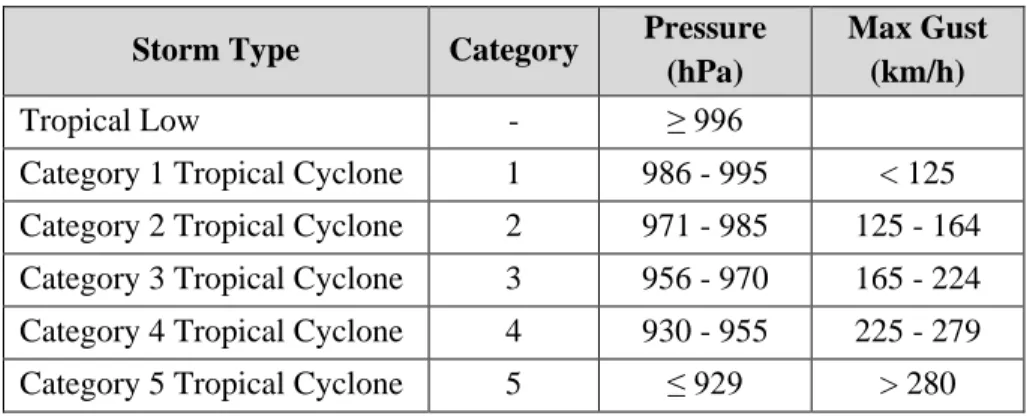
pressure (hPa) and wind speed (km/h) 29
Table 3-2 The improved cyclone track information w the maximum wind
speed and minimum pressure from 1997 to 2011 in the SIO 31 Table 4-1 Design wave conditions in Mauritius as determined by Baird [2003] 41 Table 4-2 Summary of the degree of vulnerability of public beaches in
Mauritius with regards to erosion as identified by Baird [2003] and
JICA [2013] 43
Table 4-3 Lateral Retreat and Eroded Volume for a Range of Cyclones at
Belle Mare [Baird, 2003] 46
Table 5-1 Spectral Wave (SW) input parameters used for wave simulations 52 Table 5-2 XBEACH input parameters used for sediment transport 58 Table 6-1 XBEACH predicted erosion (m3/m) for scenarios 1 to 4 for cyclone
Davina at Belle Mare beach 69
Table 6-2 Comparison between the significant wave heights offshore
(MIKE 21) and inside the lagoon (XBEACH) for cyclone Davina 70 Table 6-3 XBEACH output results for surge (m) and wave run-up (m) for
cyclone Davina 71
NOMENCLATURE Acronyms
1D One dimension
2D Two dimension
CD cyclone Davina
DHI Danish Hydraulic Institute
GEBCO General Bathymetric Chart of the Oceans
GHG greenhouse gases
GDP Gross domestic product
GLM Generalized Lagrangian Mean
GoM Government of Mauritius
GSC geotextile sand filled containers HAT highest astronomical tide
LAT lowest astronomical tide
MoE Ministry of Environment
MMS Mauritius Meteorological Services
N/A Not Applicable
NCEP National Centers for Environmental Prediction NOAA National Oceanic and Atmospheric Administration
RH relative humidity
SE South East
SH Southern Hemisphere
SIO South Indian Ocean
SST Sea Surface Temperature
SW Spectral Wave
TC Tropical Cyclone
USD US Dollar
Greek Symbols
Ϛ Low level relative vorticity
angle between the radial arm and the line of maximum winds air density
free breaking parameter Mean wave direction
Roman Symbols
B Shape Parameter
Dissipation Coefficient Drag Coefficient
Sediment Diffusion Coefficient
Directionally Integrated Total Wave Energy Dissipation due to Wave Breaking
E Ocean Thermal Energy
Total Wave Energy Eulerian Mean Velocity f Coriolis Parameter
Wave Frequency Local Water Depth Maximum Wave Height
Hrms Root Mean Square Height of wave Hs / Hm0 Significant Wave Height
Bed Slope
Mean Wave Number Nikuradse Roughness
Zeroth Moment of the spectra Wave Action Density Spectrum
P Pressure
Pc Central Pressure Pn Neutral Pressure
Fraction Of Breaking Waves Rm Radius to Maximum Winds
Specific Weight of the Sediment
Source Term for Energy Balance Equation Bottom-Friction Parameter
White-Capping Parameter Wave Growth by Wind Action
Wave Energy Transfer due to Non-Linear Wave-Wave Interaction Depth-Induced Wave Breaking Parameter
SZ Vertical Shear
Tp Peak Wave Period
Time
T0 Mean Wave Period
Adaptation Time For Entrainment of the Sediment
Minimum Water Velocity at which sediment sets in motion
V Total Wind Speed
V10 Surface Wind
Vf Forward Speed
Forward Cyclone Speed Gradient Wind
Vmax Maximum Wind Speed
Propagation Velocity of a wave group in the Four-Dimensional Phase Four-Dimensional Differential Operator
Sediment Fall Velocity
CHAPTER 1 INTRODUCTION
1.1 Effects of cyclone wave on coastline
Extreme natural phenomena such as cyclones and storm surges greatly affect the socio- economic activities of Mauritius [JICA, 2013]. Although these natural catastrophic events occur over a short temporal cycle, their impacts can be detrimental. Coastal erosion, one of the adverse effects of tropical cyclones, has contributed significantly to the deterioration of the coastal environment of Mauritius. The extent of coastal erosion produced by cyclones depends on several influential factors such as the frequency, intensity, duration and the trajectory.
Climate change, a consequence of natural and anthropogenic forcings, may amplify the intensity of tropical cyclones (refer to Chapter 2). Furthermore, a rise in the sea level has been observed over the last decades which has been attributed to climate change [IPCC, 2013]. The combined effect of these two products of climate change is believed to increase the reach of bigger storm surges which will accelerate coastal erosion.
It is therefore advisable to quantify the possible impacts of cyclone intensities on coastal vulnerability in Mauritius for planning purposes.
1.2 Problem definition (Motivation, aim, objective)
The repeated actions of cyclones on the coastal zone can be disastrous. It is vital to re-create these phenomena with the aid of models in order to accurately predict, quantify and mitigate their impacts.
Research question 1.2.1
What is the coastal erosion associated with tropical cyclones under the influence of climate change for the Island of Mauritius?
Tropical cyclones generally approach Mauritius from an Easterly direction and hence have a bigger influence on this part of the Island. The Belle Mare public beach has been selected as a case study for this research since it is situated on the east coast of Mauritius. Belle Mare also comprises numerous luxurious hotels along the coast. Therefore the research question may be posed more specifically as what is the coastal erosion associated with tropical cyclones under the influence of climate change for the Belle Mare public beach.
Motivation 1.2.2
The tourism industry has experienced considerable growth in Mauritius since 2007, becoming an important pillar of its economy [JICA, 2013]. This growth is mainly due to the attractive coastal landscape which has led to extensive development along the shoreline. Over the past decades, this coastline has been subject to increasing stress as a result of anthropogenic and natural forcings. Tropical cyclones in the Indian Ocean, one of the most significant natural forcings, generally occur during the summer season, between the months of November and April.
The average number of cyclones recorded in the Indian Ocean from 1997 to 2011 is 22 per year, with an average of 10 per year having direct effects on the Island of Mauritius (refer to Chapter 3). These cyclones vary in intensity and therefore have different degrees of coastal impact. Severe tropical cyclones have proven to be of real concern to the coastal zone, social- economic development and human life. This being said, the only evidence pertaining to extreme coastal erosion in Mauritius was recorded and reported in 1960 which was caused by severe tropical cyclone Carol [Baird, 2003]. Its impacts were reported in the form of surveyed beach profile transformation both pre and post-cyclonic activity. Cyclone Carol was responsible for the destruction of coastal infrastructure and serious beach degradation. Notwithstanding the above, little information relating to the characteristics of cyclone Carol and its wave climate is readily available. Furthermore, no proper record of subsequent severe cyclones was available until 1979. Meanwhile, the disastrous effects of tropical cyclones have been experienced in Mauritius [Baird, 2003; JICA, 2013]. Today, various mitigating measures to combat erosion can be observed around Mauritius but very few, if any, are based on design wave characteristics factors. In addition, climate change and sea level rise are undisputed factors that affect the impacts of cyclones. Consequently, reliable engineering models need to be developed to replicate these events to understand and design appropriate mitigating measures. This research aims at quantifying the risks associated solely to the effects of tropical cyclones and climate change and adopting appropriate protective measures.
Aim & Objectives 1.2.3
Aim 1.2.3.1
The aim of this dissertation is to estimate the vulnerability of Mauritius to tropical cyclones under the influence of climate change and recommend appropriate coastal defence(s).
Objectives 1.2.3.2
To use the available cyclone data to calibrate and validate deep water waves using MIKE 21 by DHI.
To generate, through a return period calculation for tropical cyclones, a trend for the occurrence of severe coastal storms in the region.
To simulate a tropical cyclone with different intensities, based on the predicted effect of climate change, using the MIKE 21model
To use the generated data to create an XBEACH model [Deltares & TUDelft] and simulate the erosion impacts of the different cyclone intensities.
To estimate the predicted relative potential erosion for the return period
To propose a suitable shoreline protection defence based on prevailing conditions
1.3 Approach
Belle Mare Public Beach 1.3.1
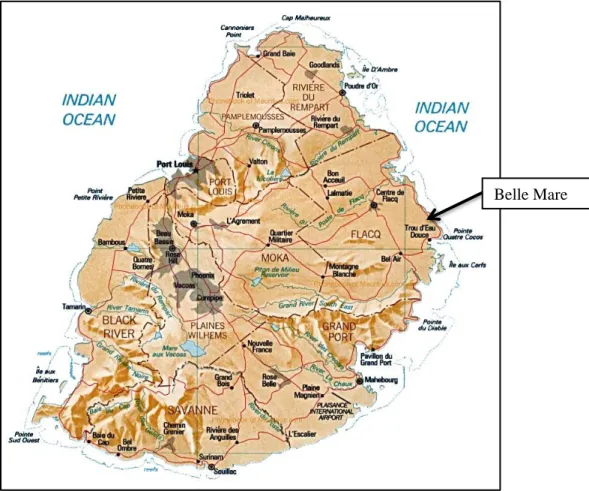
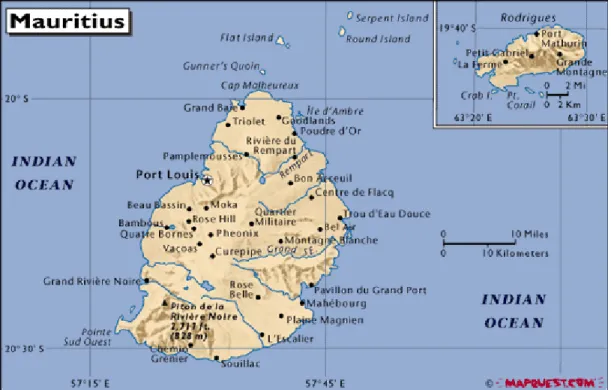
Belle Mare, one of the popular beaches along the east coast of Mauritius, stretches from the north of Trou D’Eau Douce (southern part) to Pointe de Flacq (northern part), see Figure 1-1.
This represents a length of about 10km over which more than a dozen luxury hotels such as Lux Belle Mare, Le Prince Maurice, One & Only Le Saint Geran, La Residence, etc. are found. Belle Mare is a good representation of the reef-lagoon-beach system surrounding the Island. The coastline is mainly comprised of sand spanning approximately 30m wide from the vegetated dune inland to the mean sea level. The reef extends over 500m offshore which, in general, offers a good dampening effect to extreme storm surges. Nevertheless high erosion has been observed over the years, especially during cyclone Carol [Baird, 2003].
Figure 1-1: Map of Mauritius showing Belle Mare Beach (Source of imagery: Google Earth, 2014)
Historical cyclone wave data and beach profiles are very limited in Mauritius. Owing to the lack of information, the Government of Mauritius has recognized the need to address the coastal degradation and, through the Ministry of Environment, has initiated various studies to identify the causes and to propose mitigating measures to preserve its resources. Studies conducted by Baird [2003] and JICA [2013] categorize vulnerable locations around the island of Mauritius based on limited information. Both reports have identified the Belle Mare public beach as a medium to high priority zone for potential erosion.
Historical cyclones from 1998 to 2011 with sufficient data were extracted from the global database for the entire Indian Ocean region. The MIKE 21 SW [DHI] model was used to calibrate and validate the wave output against available recorded wave data. Thereafter, the intensity of the most influential cyclone identified from the historic record, Davina, was
Belle Mare
1.4 Structure of Dissertation
The following chapters cover the influence of climate change on tropical cyclones and its related impacts on the coastline of Mauritius as a case study. A brief recommendation on the suitability of various coastal defences is also presented.
Chapter 2: contains basic information about the parameters that affect the formation of cyclones (cyclo-genesis) and the predicted effect of climate change on cyclo-genesis. It also contains an overview of the numerical software used for modelling: (i) the propagation of tropical cyclones using MIKE 21 Cyclone Wind Generation [DHI], (ii) the growth, decay and transformation of offshore cyclone waves using MIKE 21 Spectral Wave module and (iii) the computation of nearshore processes, especially for sandy coastlines using XBEACH. The chapter also presents the various coastal protection measures available.
Chapter 3: provides information about the trends in occurrence of tropical cyclones in the Indian Ocean. The chapter also provides information on the methodological approach used to conduct the research project.
Chapter 4: provides information on the wave climate of Mauritius and the coastal vulnerability of various beaches around Mauritius as predicted by previous studies undertaken by the Government of Mauritius. The physical characteristics of the Belle Mare beach (as the case study) are presented, as well as the findings on the predicted rate of erosion at Belle Mare by the previous studies.
Chapter 5: provides information about the methods used to conduct the research project.
The chapter also provides information on MIKE 21 Cyclone Wind Generation, MIKE 21 Spectral Wave module and XBEACH used to model the relative rate of coastal erosion by tropical cyclones under the influence of climate change for the case study.
Chapter 6: presents the output results obtained from MIKE 21 Spectral Wave module and XBEACH simulation analysis for the case study. It also analyses the results and highlights possible shortcomings of the simulation and mentions future considerations.
Chapter 7: discusses the merits for a suitable erosion control based on a theoretical approach only.
Chapter 8: is a summary and conclusion on the research topic.
CHAPTER 2
LITERATURE REVIEW
2.1 Introduction
This section presents the background information pertaining to the various contributing factors of this dissertation namely the mechanisms related to wind-generated waves, climate change, trends in sea level rise and trends in the evolution of tropical cyclones in the Indian Ocean. This background is required for the prognosis of the wave climate and its effect on the coastal erosion faced on the Island of Mauritius.
2.2 Waves and Tropical cyclones
The theory of wind-generated waves is well documented [Goda, 2008]. Waves are characterized by a random and irregular surface undulance. However, short parameterized wave records (i.e.
varying wave heights, periods and wavelengths over a timescale of typically 20 minutes) passing a stationary point in space have been found to approximate a sinusoidal variation. Some important wave parameters associated with short-term statistical analyses of waves are:
o Significant wave height, Hs defined as the average of the highest one-third of the waves o Mean wave period, T0 defined as the mean of all the wave periods.
Wind-generated waves are a major supplier of energy to the coastal system [Bosboom &
Stive, 2012] that continuously affects the coastal morphology through sediment transport. Wind waves are a function of the wind speed, the duration of the wind and the distance over the water over which the wind blows [Baird, 2003]. These factors are significantly amplified in the case of a tropical cyclone. Therefore, although of short duration and seasonal, a tropical cyclone may have devastating effects on the coastal environment.
Tropical cyclones are low-pressure systems that form over tropical oceans as a result of various complex factors. Gray [1968] defines tropical storms as warm-core cyclonically rotating wind systems in which the maximum sustained winds are 35 knots (64.82 km/hour) or more.
These formations have been observed in the latitude belts of 5 to 15° [Gray, 1975]. To this day, the early stages in the formation of tropical cyclone are not fully understood and cyclo-genesis is beyond the scope of this dissertation. However, an understanding of the causative factors of
The formation of tropical cyclones is dependent on the combination of the following six factors, amongst others [e.g. Gray 1968, 1975, 1998]:
i. Low level relative vorticity (Ϛ):
A continuous low level import of mass, momentum and water vapour is necessary for the formation of tropical cyclones [Gray, 1975]. These are thought to be related to the strength of the Ekman-type of frictional wind veering. These low pressure areas occur when the atmospheric pressure at sea level is below the surrounding regions which are caused by wind divergence at the upper levels of the troposphere.
ii. Coriolis parameter (f):
Gray [1975] states that cyclones do not form within 4 to 5° of the equator and therefore the influence of the earth’s rotation appear to be of primary importance in the formation of cyclones. Furthermore, Gray [1975] states that winds on the equator are very weak and assumes that cyclone genesis cannot proceed if Boundary Layer velocities cannot be maintained. Significant Coriolis force allows the developing vortex to achieve gradient wind balance which allows latent heat to concentrate near the storm core. This results in the maintenance or intensification of the vortex.
iii. The inverse of the vertical shear of the horizontal wind between the lower and upper troposphere (1/SZ):
Minimum vertical shear of the horizontal wind between the lower and upper troposphere is required for the formation of tropical cyclones [Gray, 1975]. This means that tropical cyclones are fuelled by the temperature gradient between the warm tropical ocean and the colder upper atmosphere. The absence of ventilation coupled with an enthalpy gain at the upper levels of the troposphere plays an important role in the formation of tropical cyclones.
iv. Ocean thermal energy or sea temperature above 26°C to a depth of 60m (E):
Tropical cyclones require warm waters of at least 26°C to form and maintain the warm core that fuels tropical systems. Gray [1975] makes reference to various researches that have shown that storms consume a significant amount of calories per day. This energy consumption is associated with an oceanic upwelling within and around the storm’s centre causing a reduced air pressure at this position.
v. Vertical gradient of potential temperature between the surface and 500mb (∂Ɵe/∂p):
Vertical coupling of lower and upper tropospheric flow pattern produced by deep cumulus convection favours the development of cyclones. In this atmospheric instability, a lifted parcel of air will be warmer than the surrounding air at altitude. Since it is warmer, the air is less dense and is prone to further ascent. This vertical motion is associated with the formation of weather systems and their severities.
vi. Middle troposphere relative humidity (RH) :
High middle tropospheric humidity is essential for the formation of tropical cyclones [Wu et al., 2012]. High humidity encourages deep cumulus convection and precipitation which influences the enthalpy change [Gray 1975].
Gray [1975] further states that the product of the above parameters influences directly the cyclone genesis frequency as follows:
𝑆𝑒𝑎𝑠𝑜𝑛𝑎𝑙 𝐺𝑒𝑛𝑒𝑠𝑖𝑠 𝐹𝑟𝑒𝑞𝑢𝑒𝑛𝑐𝑦 ∝ (Ϛ × 𝑓 × 1
𝑆𝑍 × 𝐸 × 𝜕𝜃𝑒
𝜕𝑝 × 𝑅𝐻 ) Dynamic
potential
Thermal Potential
2.3 Climate change and tropical cyclones
Global consensus regarding climate change has been established from historic records and continuous monitoring [IPCC, 2013]. Climate change is the result of an increase in the emission of greenhouse gases (GHG) such as carbon dioxide, methane and nitrous oxide through both natural and anthropogenic processes. The IPCC [2013] reports, with high confidence, that these increases in GHGs have been associated with changes in atmospheric and surface (ocean and land) temperature, water vapour, sea level, ocean acidification and climate extremes. Human activities are responsible for a 40% increase in the emission of carbon dioxide into the atmosphere between 1750 and 2011.
Climate change greatly affects the oceanic environment and influences the occurrence and intensity of natural processes that form over the ocean such as tropical cyclones.
Sellers at al., 1998; Knutson et al., 2004, 2010; Webster et al., 2005; Emanuel, 2005; Bengtsson et al., 1996, 2007] have monitored the trend in the frequency and intensity of tropical cyclones since the emergence of the focus on climate change and have attempted to relate these two phenomena. However, the lack of reliable cyclone data, especially before the satellite era in 1970, does not give great confidence in this relationship.
It is obvious that the impact of climatic changes on one or a combination of the causative factors in the formation of tropical cyclone may alter its physical characteristics. One must consider this in the holistic planning and design of coastal developments in a dynamic coastal environment. The topic of climate change is not explicitly dealt with in this research but its potential effect on tropical cyclones is a key theme.
The previous section laid the foundation associated with the formation of tropical cyclones. The next section looks at the predicted effects of climate change on parameters associated with the formation of tropical cyclones.
Predicted effect of climate change on tropical cyclone 2.3.1
Coastal engineers, scientists and government bodies have recognized the importance of understanding wave climate to adequately predict, plan and mitigate its effects on the coastline as well as coastal developments, especially under extreme conditions such as tropical cyclones/storms.
The influence of climate change on each of the causative parameters is presented below.
It is important to note that Bengtsson et al. [2005] and Caron & Jones [2007] report a discrepancy across the various genesis regions.
i. Low level relative vorticity (Ϛ):
Elevated low-level relative vorticity is required, amongst other factors, for the formation of tropical cyclones [Gray 1968, 1975, 1997; Tory et al., 2013]. Bengtsson [1996] predicts a decrease in the low-level relative vorticity with an increase in CO2 level. Bengtsson [1996]
associates this effect with a reduction in the frequency of tropical cyclones.
ii. Coriolis parameter (f):
The coriolis parameter is a function of the earth’s angular velocity and is dependent on the latitudinal position [Elsner et al., 2009]. Therefore, no change is expected under the influence of climate change.
iii. The inverse of the vertical shear in the horizontal wind between the lower and upper troposphere (1/SZ):
Thatcher and Pu [2011] and Knutson et al. [2004] report that high vertical wind shear (above 10s-1) has a negative effect on the intensity of tropical cyclone and vice-versa. Knutson at al.
[2004] and Vecchi & Soden [2007] also report an observed increase in vertical wind shear under the influence of high CO2 levels. Emanuel [2006] suggests that a 10% increase in wind shear would decrease the TC intensity by 12%.
iv. Ocean thermal energy or sea temperature above 26°C to a depth of 60m (E):
Recent climate changes are associated with a global increase in the sea surface temperature (SST). IPCC [2013] attributes this temperature increase in part to anthropogenic forcing.
IPCC [2013] also reports a global SST increase ranging between 0.5°C to 1.3°C over the period of 1951 to 2010. Many studies [Emanuel, 1987; Evans, 1993; DeMaria and Kaplan, 1993; Walsh and Pittock, 1998; Knutson, 2004; Webster et al.,2005; Emanuel, 2006; Vitart et al., 2007; Bengtsson et al., 2007; Yu and Wang, 2009; Yamada et al., 2010; Knutson et al., 2010] have linked the increase in SST to the potential increase in intensity of tropical cyclones. Furthermore, Emanuel [2006] predicts that a 10% increase in water temperature would increase TC intensity by 65%.
v. Vertical gradient of potential temperature between the surface and 500mb (∂Ɵe/∂p):
Li et al. [2010] states that climate change is responsible for a larger increase in air temperature in the upper troposphere than in the lower troposphere over the lower latitudes.
This results in the stabilization of the atmospheric temperature and pressure between these two regions and, is associated with the decrease in the frequency of tropical cyclones in some basins. Whilst the troposphere is warming up, cooling of the stratosphere is observed under climate change [Held, 1978; Bengtsson et al., 1995; Rind et al., 2005; Sherwood et al., 2010; Akperov and Mokhov, 2013]. This causes the warm air to rise poleward and cold air to sink as it moves equatorward. Hence energy is transported towards the poles through the process of baroclinic instability resulting in a poleward shift of the storms.
vi. Middle troposphere relative humidity (RH) :
The effect of climate change on relative humidity is said to be minimal according to various researchers [Emanuel, 1987; Paltridge et al., 2009; Held and Shell, 2012; IPCC, 2013]. This
Table 2-1 summarizes the predicted effect of climate change on the causative parameters for cyclo-genesis.
Table 2-1: Summary of the resulting effect of climate change on the main parameters that affects the formation of tropical cyclones.
Primary Parameters
Magnitude required for development of tropical cyclone
Effect of Climate Change on Magnitude
Result on tropical cyclone
Relative vorticity (Ϛ) High ↓ Decrease in
frequency
Coriolis parameter (f) Low → N/A
Vertical wind shear
(1/SZ) Low ↑ Decrease in
intensity
Sea temperature (E) High ↑ Increase in
intensity Temperature gradient
(∂Ɵe/∂p) High ↓ Decrease in
frequency Relative humidity
(RH) High → Nil
‘↓’ = predicted decrease; ‘↑’ = predicted increase; ‘→’ = no predicted change
Discussion:
2.3.2
The influences of climate change on the various parameters necessary for cyclo-genesis have been reviewed. Although detailed consensus does not exist within the climatology community, a summary on the impacts of climate change on cyclo-genesis is given in Table 2-1.
The net combined effect of the above causative parameters necessary for cyclo-genesis, under the influence of climate change, is believed to yield the following:
A potential increase in intensity,
A potential decrease in frequency in the tropics.
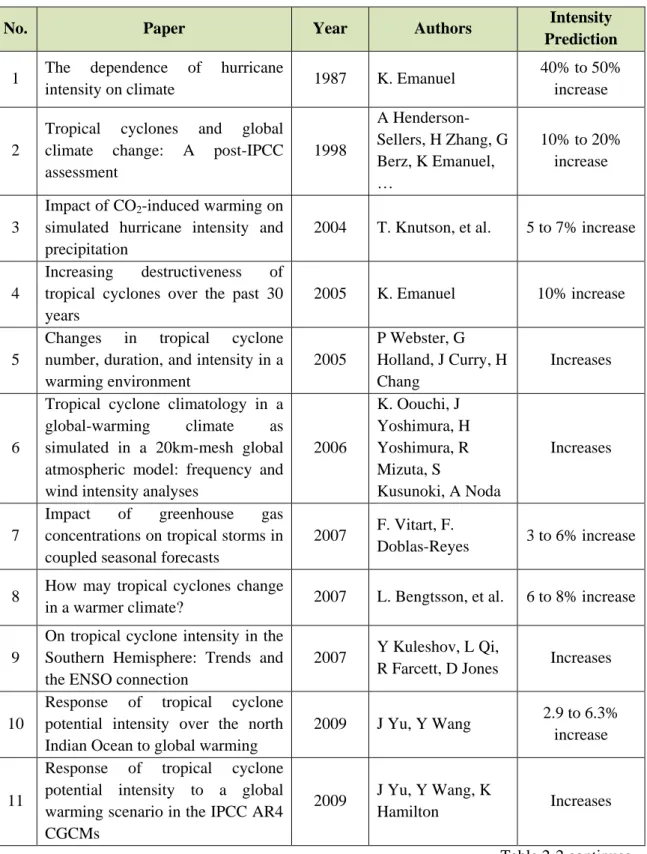
Table 2-2 summarizes the predictions of climate change on tropical cyclones by various studies. A potential increase ranging from 3% to 20% is widely predicted with lower confidence over this range.
Table 2-2: Effect of climate change on the intensity of tropical cyclones as predicted by various studies.
No. Paper Year Authors Intensity
Prediction 1 The dependence of hurricane
intensity on climate 1987 K. Emanuel 40% to 50%
increase
2
Tropical cyclones and global climate change: A post-IPCC assessment
1998
A Henderson- Sellers, H Zhang, G Berz, K Emanuel,
…
10% to 20%
increase
3
Impact of CO2-induced warming on simulated hurricane intensity and precipitation
2004 T. Knutson, et al. 5 to 7% increase
4
Increasing destructiveness of tropical cyclones over the past 30 years
2005 K. Emanuel 10% increase
5
Changes in tropical cyclone number, duration, and intensity in a warming environment
2005
P Webster, G Holland, J Curry, H Chang
Increases
6
Tropical cyclone climatology in a global-warming climate as simulated in a 20km-mesh global atmospheric model: frequency and wind intensity analyses
2006
K. Oouchi, J Yoshimura, H Yoshimura, R Mizuta, S
Kusunoki, A Noda
Increases
7
Impact of greenhouse gas concentrations on tropical storms in coupled seasonal forecasts
2007 F. Vitart, F.
Doblas-Reyes 3 to 6% increase 8 How may tropical cyclones change
in a warmer climate? 2007 L. Bengtsson, et al. 6 to 8% increase 9
On tropical cyclone intensity in the Southern Hemisphere: Trends and the ENSO connection
2007 Y Kuleshov, L Qi,
R Farcett, D Jones Increases 10
Response of tropical cyclone potential intensity over the north Indian Ocean to global warming
2009 J Yu, Y Wang 2.9 to 6.3%
increase
11
Response of tropical cyclone potential intensity to a global warming scenario in the IPCC AR4 CGCMs
2009 J Yu, Y Wang, K
Hamilton Increases
Table 2-2 continues
Table 2-2: Effect of climate change on the intensity of tropical cyclones as predicted by various studies (contd)
No. Paper Year Authors Intensity
Prediction 12 Tropical cyclones and climate
change 2010 T. Knutson, et al. 2 to 11%
increase
13
Projection of changes in tropical cyclone activity and cloud due to greenhouse warming: global cloud- system-resolving approach
2010
Y Yamada, K Oouchi, M Satoh, etc
Increases
14 Tropical cyclone intensification
trends during satellite era 2012 C Kishtawal, N
Jaiswal 30% increase
2.4 Cyclone Potential Intensity increase for Case Study
Based on the predicted increases in the intensity of tropical cyclones shown in Table 2.2, this research investigates the coastal vulnerability when the intensity of a tropical cyclone (Section 3.3.2) is increased by 5%, 10% and 15%.
2.5 Global sea level trend
The fluctuation of the sea level plays an important role in coastal engineering and coastal management. The water level at any particular location is dependent on various global and local factors such as oceanic conditions, atmospheric forcing, storm surge, waves, tides, land subsidence or uplift, wind, warming or cooling of the ocean, continents and ice sheets, and river flow [Ewing, 2010]. It is evident how variations in sea level coupled with an intensified tropical cyclone can influence coastal conditions.
Sea level rise 2.5.1
Various tide gauges installed across the Northern and Southern hemispheres have recorded global average rate of increase in sea level of 1.7mm yr-1 between 1901 and 2010 [IPCC, 2013].
This translates to a rise in sea level of 0.19m in 110 years. Since the introduction of high- precision satellite altimetry record, an accelerated mean rate in sea level rise of 3.2mm yr-1 between 1993 and 2010 has been reported [IPCC, 2013]. The projections of IPCC [2013], based on a 95% probability model, show a global mean sea level rise of 0.72m between 1990 and 2100. Ewing [2010] uses the Bruun’s rule to predict that, for gently sloping beaches, for every meter of sea level rise 50 to 100m of beach width is lost.
2.6 Tides
Tides are generated by the gravitational forces of the earth-moon and the earth-sun. The frequency of tides follows a diurnal and semi-diurnal trend due to the interaction between the earth, moon and sun. Bosboom and Stive [2012] state that the sun contributes to about 30% of the tidal amplitudes with the moon accounting for the remaining 70%. The daily variations in water level affect the coastal morphology through constant sediment transport. Due to the difference in the rotating axes between these 3 solar systems, daily inequalities occur i.e. the high and low tides are not equal in amplitude. The largest inequality occurs at a cycle of 18.3 years.
The coastal environment is affected the most during high tides and the impacts are greater in the event of storms. Moreover, the effect of sea level rise will cause the water during high tide to move further inland and this migration may extend the reach of storms.
2.7 Storm surge
Storm surge are sudden, short-term fluctuations in the water surface caused by high winds which are generated by a storm field. These fluctuations can be significant in the case of severe storms. As discussed in the previous section, storm surges occurring during high tides can be disastrous to the coastal system.
2.8 Sources of coastal sediment
Fine sediments (i.e. sand) deposited along the coast come primarily from the continent. These emanates from weathered rock which consist of quartz and feldspar [Bosboom and Stive, 2012].
Rivers determine the availability of sediments to the coastal system. The other source of sand to the coast is carbonate sediments. These come from fragment of shells and/or remains of marine life [Bosboom and Stive, 2012]. Prior to the 2000’s, sand was used to make concrete in Mauritius. Due to the depletion of the sand along the beach and degradation thereof, this practice was banned. Also, beach sediment recovery following erosion may be hampered by the action of dams which retain the sediments. This dissertation does not investigate the availability of sediments to the coastal system of Mauritius.
Longshore sediment transport is the movement of sediments across the shoreline. The sediments
In Mauritius, in general, the coastal morphology is dominated by longshore sediments transport [Baird, 2003].
2.9 Resulting effect of climate change on coastlines on predicted surge and erosion
The coastal environment is subjected to perpetual changes through anthropogenic and/or natural forcing of which erosion is one of the major concerns in coastal degradation. In this dissertation, the rate of erosion caused by a potential intensified tropical cyclone resulting from climate change is addressed. As mentioned in the previous section, it is obvious that a potential increase in the intensity of the tropical cyclone coupled with a sea level rise may have devastating impacts on the coastal morphology.
2.10 Numerical modelling
The dynamics associated with coastal processes are very complex and the development of various modelling software has aided in simulating, to a high degree of accuracy, these dynamics. As such, the aims and objectives of this dissertation were achieved through the use of numerical modelling tools namely the MIKE 21 suite developed by the Danish Hydraulic Institute (DHI) and the XBEACH software by UNESCO-IHE, Deltares (Delft Hydraulics), Delft University of Technology and the University of Miami. Descriptions of the numerical models used are given in Section 2.10.1 to 2.10.3 and these literatures are available in the MIKE 21 Toolbox [DHI, 2011], the Mike 21 SW Scientific Documentation [DHI, 2011] and the XBEACH Model Description and Manual [Unesco-IHE Institute for Water Education, Deltares and Delft University of Technology, 2010].
MIKE 21 Cyclone Wind Generation 2.10.1
The wind and pressure fields generated by a travelling cyclone can often be described through a few parameters as cyclones are normally nearly circular. By obtaining these parameters from meteorological publications (or extracting them from synoptic weather charts), MIKE 21 Cyclone Wind Generation generates the space and time varying pressure and wind field within a model area for later use in a hydrodynamic or offshore wave simulation. In this way cyclonic surges or waves can readily be computed using MIKE 21 Spectral Wave (SW) module.
Parametric Models 2.10.1.1
Mike 21 Cyclone Wind Generation consists of various parametric models which can be chosen, depending on the available cyclone parameters. Several parameters are common for these parametric models. These parametric models are as follows:
A.1 Young & Sobey [1981]
A.2 Holland [1980] [Holland, 1980]
A.3 Holland – double vortex [Holland, 1980; Thompson and Cardone, 1996]
A.4 Rankine [Wood & White, 2013]
A.1 Young & Sobey parametric model
Wind field parameters
The parameters required to simulate the wind fields are as follows:
o Radius to maximum winds, Rmw
o Maximum wind speed, Vmax
o Cyclone track
o Forward speed, Vf and o direction
The wind field consists of a rotational and a translational component. At a distance, R, from the centre of the cyclone, the rotational wind speed, Vf, is given as
𝑉𝑟 = 𝑉𝑚𝑎𝑥 × ( 𝑅 𝑅𝑚𝑤)
7
× 𝑒[7(1− 𝑅 𝑅⁄ 𝑚𝑤)] ; 𝑓𝑜𝑟 𝑅 < 𝑅𝑚𝑤 and
𝑉𝑟 = 𝑉𝑚𝑎𝑥 × 𝑒[(0.0025𝑅𝑚𝑤+ 0.05)(1−𝑅 𝑅⁄ 𝑚𝑤)] ; 𝑓𝑜𝑟 𝑅 ≥ 𝑅𝑚𝑤 where R and Rmw are given in km.
The translational component, Vt, is given by
𝑉𝑡= −0.5 × 𝑉𝑓× (− cos 𝜑)
where 𝜑 is the angle between the radial arm and the line of maximum winds.
The total wind speed, V, is the sum of translational and rotational components 𝑉 = 𝑉𝑟+ 𝑉𝑡
Pressure field parameters
The pressure, P, at a particular location is given as 𝑃 = 𝑃𝑐+ (𝑃𝑛− 𝑃𝑐) × 𝑒(−𝑅𝑚𝑤⁄ )𝑅 where the pressure field is comprised of:
o Central pressure, Pc
o Neutral pressure, Pn
A.2 Holland parametric model
Pressure field parameters
Holland defines the pressure, P as follows
𝑃 = 𝑃𝑐+ (𝑃𝑛− 𝑃𝑐) × 𝑒(−𝑅𝑚𝑤⁄ )𝑟 𝐵
where B is a shape parameter to match different kind storm pressure profiles, and is referred to as the Holland parameter or profile “peakedness”. The magnitude of B varies between 1 and 2.5 and can be obtained from:
𝐵 = 2.0 − (𝑃𝑐− 900 160 )
Wind field parameters
The wind, as defined by Holland, can be obtained as follows 𝑉𝑔(𝑟) = √(𝑃𝑛− 𝑃𝑐) × 𝐵
𝜌𝐴 × (𝑅𝑚𝑤 𝑟 )
𝐵
× 𝑒(−𝑅𝑚𝑤𝑟 )
𝐵
+ (𝑟 × 𝑓
2 )
2
− 𝑟|𝑓|
2 where 𝜌𝐴 is the air density and 𝑓 the Coriolis parameter.
Neglecting the Coriolis effect, it follows that
𝑉𝑚𝑎𝑥= √(𝑃𝑛− 𝑃𝑐) × (𝐵 × 𝑒 𝜌𝐴 )
If the maximum wind speed (Vmax) is known, an alternative method to determine B is given by
𝐵 = 𝜌𝐴 × 𝑒 × 𝑉𝑚𝑎𝑥2 (𝑃𝑛− 𝑃𝑐)
A.3 Holland – double vortex parametric model
Pressure field parameters
The Holland – double vortex model includes a secondary vortex as follows 𝑃 = 𝑃𝑐+ [∆𝑝1× 𝑒(−
𝑅𝑚𝑤1
⁄ )𝑟 𝐵1
] + [∆𝑝2× 𝑒(−
𝑅𝑚𝑤2
⁄ )𝑟 𝐵2
]
where ∆𝑝1+ ∆𝑝2= 𝑃𝑛− 𝑃𝑐= ∆𝑝
Wind field parameters The gradient wind is given by
𝑉𝑔(𝑟) =
{√
[(𝑅𝑚𝑤1 𝑟 )
𝐵1
× (𝐵1× ∆𝑝1
𝜌𝐴 ) × 𝑒(−𝑅𝑚𝑤1𝑟 )𝐵1] + [(𝑅𝑚𝑤2
𝑟 )
𝐵2
× (𝐵2× ∆𝑝2
𝜌𝐴 ) × 𝑒(−𝑅𝑚𝑤2𝑟 )𝐵2] + [(𝑟 × 𝑓
2 )
2
] }
− 𝑟|𝑓|
2
A.4 Rankine parametric model
The modified Rankine vortex model uses the following velocity distribution:
𝑉𝑔(𝑟) = {
𝑉𝑚𝑎𝑥 × ( 𝑟
𝑅𝑚𝑤) , 𝑓𝑜𝑟 0 ≤ 𝑟 < 𝑅𝑚𝑤 𝑉𝑚𝑎𝑥 × (𝑅𝑚𝑤
𝑟 )
𝑋
, 𝑓𝑜𝑟 𝑟 < 𝑅𝑚𝑤
where 𝑋 ranges between 0.4 and 0.6
Wind Correction 2.10.1.2
B.1 Geostrophic correction
MIKE 21 Cyclone Wind Generation allows for a boundary layer wind speed correction to be applied to the gradient wind to obtain surface winds. This surface wind, V10, is given by
𝑉10 (𝑟) = 𝐾𝑚 × 𝑉𝑔 (𝑟) where the Km parameter can be obtained from
𝐾𝑚 = {
0.81 , 𝑓𝑜𝑟 𝑉𝑔 < 6𝑚/𝑠 0.81 − [(2.86 × 10⁻³) × (𝑉𝑔− 6) ] , 𝑓𝑜𝑟 6 ≤ 𝑉𝑔 < 19.5 0.77 − [(4.31 × 10⁻³) × (𝑉𝑔− 19.5) ] , 𝑓𝑜𝑟 19.5 ≤ 𝑉𝑔 < 45 0.66 , 𝑓𝑜𝑟 𝑉𝑔 > 45 𝑚/𝑠
B.2 Forward motion asymmetry
Cyclonic winds circulate in a clockwise direction in the Southern Hemisphere. The wind field is asymmetric and this results in the winds being typically stronger to the left of the cyclone track and lower to the right.
Hence the forward motion at surface level is given by
𝑉10 (𝑟, 𝜃) = [𝐾𝑚 × 𝑉𝑔(𝑟)] + [𝛿𝑓𝑚× 𝑉𝑓𝑚× cos(𝜃𝑚𝑎𝑥− 𝜃)]
where;
𝛿𝑓𝑚 is the correction factor used to adjust the added forward cyclone speed, 𝑉𝑓𝑚 and typical value of 𝛿𝑓𝑚 is 0.5 or 1.
𝜃𝑚𝑎𝑥 is the angle measured relative to the cyclone movement direction.
The cyclone movement direction and speed are computed based on the position of the centre of the storm given in the Best Track Data table in MIKE 21 Cyclone Wind Generation.
B.3 Wind inflow angle
Frictional effects cause the inflow of winds towards the centre of the storm. The inflow angle, β is typically 25° and decreases towards the storm centre. This wind inflow is implemented as follows in MIKE 21 Cyclone Wind Generation
𝐾𝑚= {
10 𝑟
𝑅𝑚𝑤 , 𝑓𝑜𝑟 0 ≤ 𝑟 < 𝑅𝑚𝑤 10 + 75 ( 𝑟
𝑅𝑚𝑤− 1) , 𝑓𝑜𝑟 𝑅𝑚𝑤 ≤ 𝑟 < 1.2𝑅𝑚𝑤 25 , 𝑓𝑜𝑟 𝑟 ≥ 1.2𝑅𝑚𝑤
MIKE 21 Spectral Wave (SW) module 2.10.2
The MIKE 21 SW model, developed by DHI, simulates the growth, decay and transformation of offshore cyclone waves in offshore and coastal areas. MIKE 21 SW uses a fully spectral formulation and a directional decoupled parametric formulation.
Fully spectral formulation 2.10.2.1
The fully spectral formulation is based on the wave action conservation equation whereby the wave field is represented by the wave action density spectrum, 𝑁(𝜎, 𝜃). The wave phase parameters have been chosen as the relative (intrinsic) angular frequency, 𝜎 = 2𝜋𝑓 and the direction of the wave propagation, 𝜃.
The wave action density spectrum, N, is related to the energy density spectrum as follows 𝑁(𝜎, 𝜃) = 𝐸(𝜎, 𝜃)
𝜎
In this dissertation, the wave action conservation spectrum is formulated in horizontal Cartesian co-ordinate and the conservation equation for wave action is as follows
𝜕𝑁
𝜕𝑡 + [∇ × (𝑣̅𝑁)] = 𝑆 𝜎 where;
𝑁(𝑥̅, 𝜎, 𝜃, 𝑡) is the action density
𝑡 is the time
𝑥̅ = (𝑥, 𝑦) is the Cartesian co-ordinates
𝑣̅ = (𝑐𝑥, 𝑐𝑦, 𝑐𝜎, 𝑐𝜃) is the propagation velocity of a wave group in the four-
The energy source term (𝑆) represents the superposition of source functions which describe the following phenomena:
o wave growth by wind action (𝑆𝑖𝑛)
o wave energy transfer due to non-linear wave-wave interaction (𝑆𝑛𝑙) o dissipation due to;
white-capping (𝑆𝑑𝑠)
bottom-friction (𝑆𝑏𝑜𝑡) calibration parameters
depth-induced wave breaking (𝑆𝑠𝑢𝑟𝑓)
The relationship for these phenomena is given by
𝑆 = 𝑆𝑖𝑛+ 𝑆𝑛𝑙+ 𝑆𝑑𝑠+ 𝑆𝑏𝑜𝑡+ 𝑆𝑠𝑢𝑟𝑓
Calibration Parameters:
White-capping
Energy dissipation due to white-capping is the result of the steepness-induced wave- breaking which occurs in deeper water when the wave height becomes too large compared to its wavelength. The source function was adjusted in MIKE 21 SW to obtain a proper balance between wind input and dissipation at higher frequencies. This is given as follows
𝑆𝑑𝑠(𝜎, 𝜃) = −𝐶𝑑𝑠(𝑘̅̅̅𝑚2 0)2{(1 − 𝛿)𝑘
𝑘+ 𝛿 (𝑘 𝑘)
2
} 𝜎̅𝑁(𝜎, 𝜃) where;
𝐶𝑑𝑠 and 𝜎 are calibration parameters (The values used for these parameters are given in Section 5.1.3)
𝛿, 𝑘̅ and 𝑚0 represent the dissipation coefficient, the mean wave number and the zeroth moment of the spectra respectively
Bottom-friction
As the term suggests, energy dissipations due to bottom-friction occurs when waves propagate into shallow water and are affected by the friction due to the wave-bottom interaction. This source function is as follows
𝑆𝑏𝑜𝑡(𝜎, 𝜃) = −𝐶𝑓 𝑘
sinh 2𝑘ℎ𝐸(𝜎, 𝜃) where 𝐶𝑓 is a dissipation coefficient.
For this dissertation, the bottom friction is described by the Nikuradse roughness (𝑘𝑁) and the optimum value is given in Section 5.2.2.
Depth-induced wave breaking
Depth-induced wave breaking occurs when waves propagate into shallow areas and the wave height can no longer be supported by the water depth. The source term is as follows
𝑆𝑠𝑢𝑟𝑓(𝜎, 𝜃) = −𝛼𝑄𝑏𝜎̅𝐻𝑚2 8𝜋
𝐸(𝜎, 𝜃) 𝐸𝑡𝑜𝑡 where;
𝛼 ≈ 1.0 is a calibration constant
𝑄𝑏 is the fraction of breaking waves
𝜎̅ is the mean relative frequency
𝐸𝑡𝑜𝑡 is the total wave energy
𝐻𝑚 is the maximum wave height given by 𝛾𝑑 with 𝛾 being the free breaking parameter (default values vary from 0.5 to 1.0). The adopted value is specified in Section 5.2.2.
Lowe et al. [2005], amongst others, states that the presence of coral reefs further contributes to the dissipation of the surface wave energy through wave breaking and bottom friction. This fact was considered in the present case study, as highlighted in Section 4.9.
Directional decoupled parametric formulation 2.10.2.2
The directional decoupled parametric formulation is suitable for the near shore conditions and uses the zeroth and first moment of the action spectrum.
Model Output 2.10.2.3
Similar to other models, this module of MIKE 21 requires the user to set up a mesh using bathymetry data which contains geographical information. Boundary conditions, representing the wind-generating body, are then assigned to the mesh which will enable the software to generate and propagate the waves within the defined grid. MIKE 21 SW uses a time and space varying approach which generates output data at any specified time interval for any given point within the domain.
The following wave output data, amongst others, are obtained from MIKE 21 SW at any particular point within the domain:
o Peak wave period, Tp, which is the peak wave with the highest energy given by 𝑇𝑝= 1
𝑓𝑝 where 𝑓𝑝 is the peak wave frequency
o Mean wave direction, 𝜃𝑚 given by
𝜃𝑚 = 270 − tan−1(𝑏 𝑎⁄ ) where;
𝑎 = 𝑚1
0∫ ∫ cos(𝜃 − 270)𝐸(𝑓, 𝜃)𝑑𝑓 𝑑𝜃02𝜋 0∞
𝑏 = 1
𝑚0∫ ∫ sin(𝜃 − 270) 𝐸(𝑓, 𝜃)𝑑𝑓 𝑑𝜃02𝜋 0∞
XBEACH 2.10.3
XBEACH is one of various numerical models that have been used for the computation of nearshore processes, especially for sandy coastlines [Corbella & Stretch, 2013a; Roelvink et al., 2009]. The XBEACH model comprises the following:
Short wave (wind and swell) action balance
Roller energy equations
Non-stationary shallow water equations of mass and momentum
Sediment transport and
Bed update.
The short wave transformations are achieved using a wave action balance in 2D space, time and direction. A roller energy balance is used to parameterise complex wave breaking processes in shallow water and also represents momentum stored in surface rollers which leads to a shoreward shift in wave forcing. Using these formulations, directionally-spread infragravity waves and time-varying currents can be generated.
The directionally integrated total wave energy dissipation due to wave breaking, 𝐷̅̅̅̅𝑤, is given as 𝐷𝑤
̅̅̅̅ = 2 𝛼
𝑇𝑟𝑒𝑝𝑄𝑏𝐸𝑤 where;
𝑄𝑏= 1 − 𝑒{−(𝐻𝑚𝑎𝑥𝐻𝑟𝑚𝑠)
𝑛}
is the fraction of breaking waves
𝐻 = √8𝐸𝜌𝑔𝑤
𝐻𝑚𝑎𝑥= 𝛾 tanh 𝑘ℎ
𝑘 ; 𝛾 represents the breaker parameter given by (𝐻 ℎ⁄ )
𝐸𝑤(𝑥, 𝑦, 𝑡) = ∫ 𝑆02𝜋 𝑤(𝑥, 𝑦, 𝑡, 𝜃) 𝑑𝜃 is the directional wave energy over one wave period
Based on the wave group varying mass influx associated with the short waves and rollers, XBEACH uses the Generalized Lagrangian Mean (GLM) approach to represent the depth- averaged undertow.
During the swash and collision regime, the mass flux carried by the waves and rollers returns offshore as return flow. The offshore directed flows keep the erosion process going by removing sand from the slumping dune face. In the collision regime, the transport of sediment from dry dune face to wet swash (i.e. slumping or avalanching) is modelled with an avalanching model accounting for the fact that saturated sand moves more easily than dry sand, by introducing both a critical wet slope and dry slope. Through the advection-diffusion equation, XBEACH computes the bed level changes.
The sediment transport is modelled with a depth-averaged advection diffusion equation, namely
𝜕ℎ𝐶
𝜕𝑡 + 𝜕ℎ𝐶𝑢𝐸
𝜕𝑥 +𝜕ℎ𝐶𝑣𝐸
𝜕𝑦 + 𝜕
𝜕𝑥[𝐷ℎℎ𝜕𝐶
𝜕𝑥] + 𝜕
𝜕𝑦[𝐷ℎℎ𝜕𝐶
𝜕𝑦] = ℎ𝐶𝑒𝑞− ℎ𝐶 𝑇𝑠
Where;
𝐶 is the depth-averaged sediment concentration which varies on the wave-group time scale
𝐷ℎ is the sediment diffusion coefficient
The entrainment of the sediment is represented by an adaptation time, 𝑇𝑠 given by 𝑇𝑠= 𝑚𝑎𝑥 (0.05 ℎ
𝑤𝑠, 0.2) 𝑠 where;
ℎ is the local water depth
𝑤𝑠 is the sediment fall velocity
𝑠 is the specific weight of the sediment, 𝜌𝑠𝑒𝑑 𝜌𝑤𝑎𝑡
⁄
Entrainment or deposition is determined by the mismatch between the actual sediment concentration, 𝐶, and the equilibrium concentration, 𝐶𝑒𝑞, thus representing the source term in the sediment transport equation. The equilibrium sediment concentration formulation is given by
𝐶𝑒𝑞= 𝐴𝑠𝑏+ 𝐴𝑠𝑠
ℎ [(|𝑢𝐸|2+ 0.018𝑢𝑟𝑚𝑠2 𝐶𝑑 )
0.5
− 𝑢𝑐𝑟]
2.4
(1 − 𝛼𝑏𝑚)
where;
𝑢𝑟𝑚𝑠 =𝑇 𝜋𝐻𝑟𝑚𝑠
𝑟𝑒𝑝√2 sinh(𝑘ℎ+𝛿𝐻𝑟𝑚𝑠) is the near bed short wave orbital velocity
𝐶𝑑 is the drag coefficient due to the flow velocity only
�